The same plot in 14 other libraries — JavaScript: Chart.js, D3.js, Apache ECharts, MUI X Charts; Python: Altair, Bokeh, lets-plot, Matplotlib, Plotly, plotnine, Pygal, Seaborn; R: ggplot2; Julia: Makie.jl. Compare all 15 side by side: Basic Funnel Chart in Python, R, Julia and JavaScript.
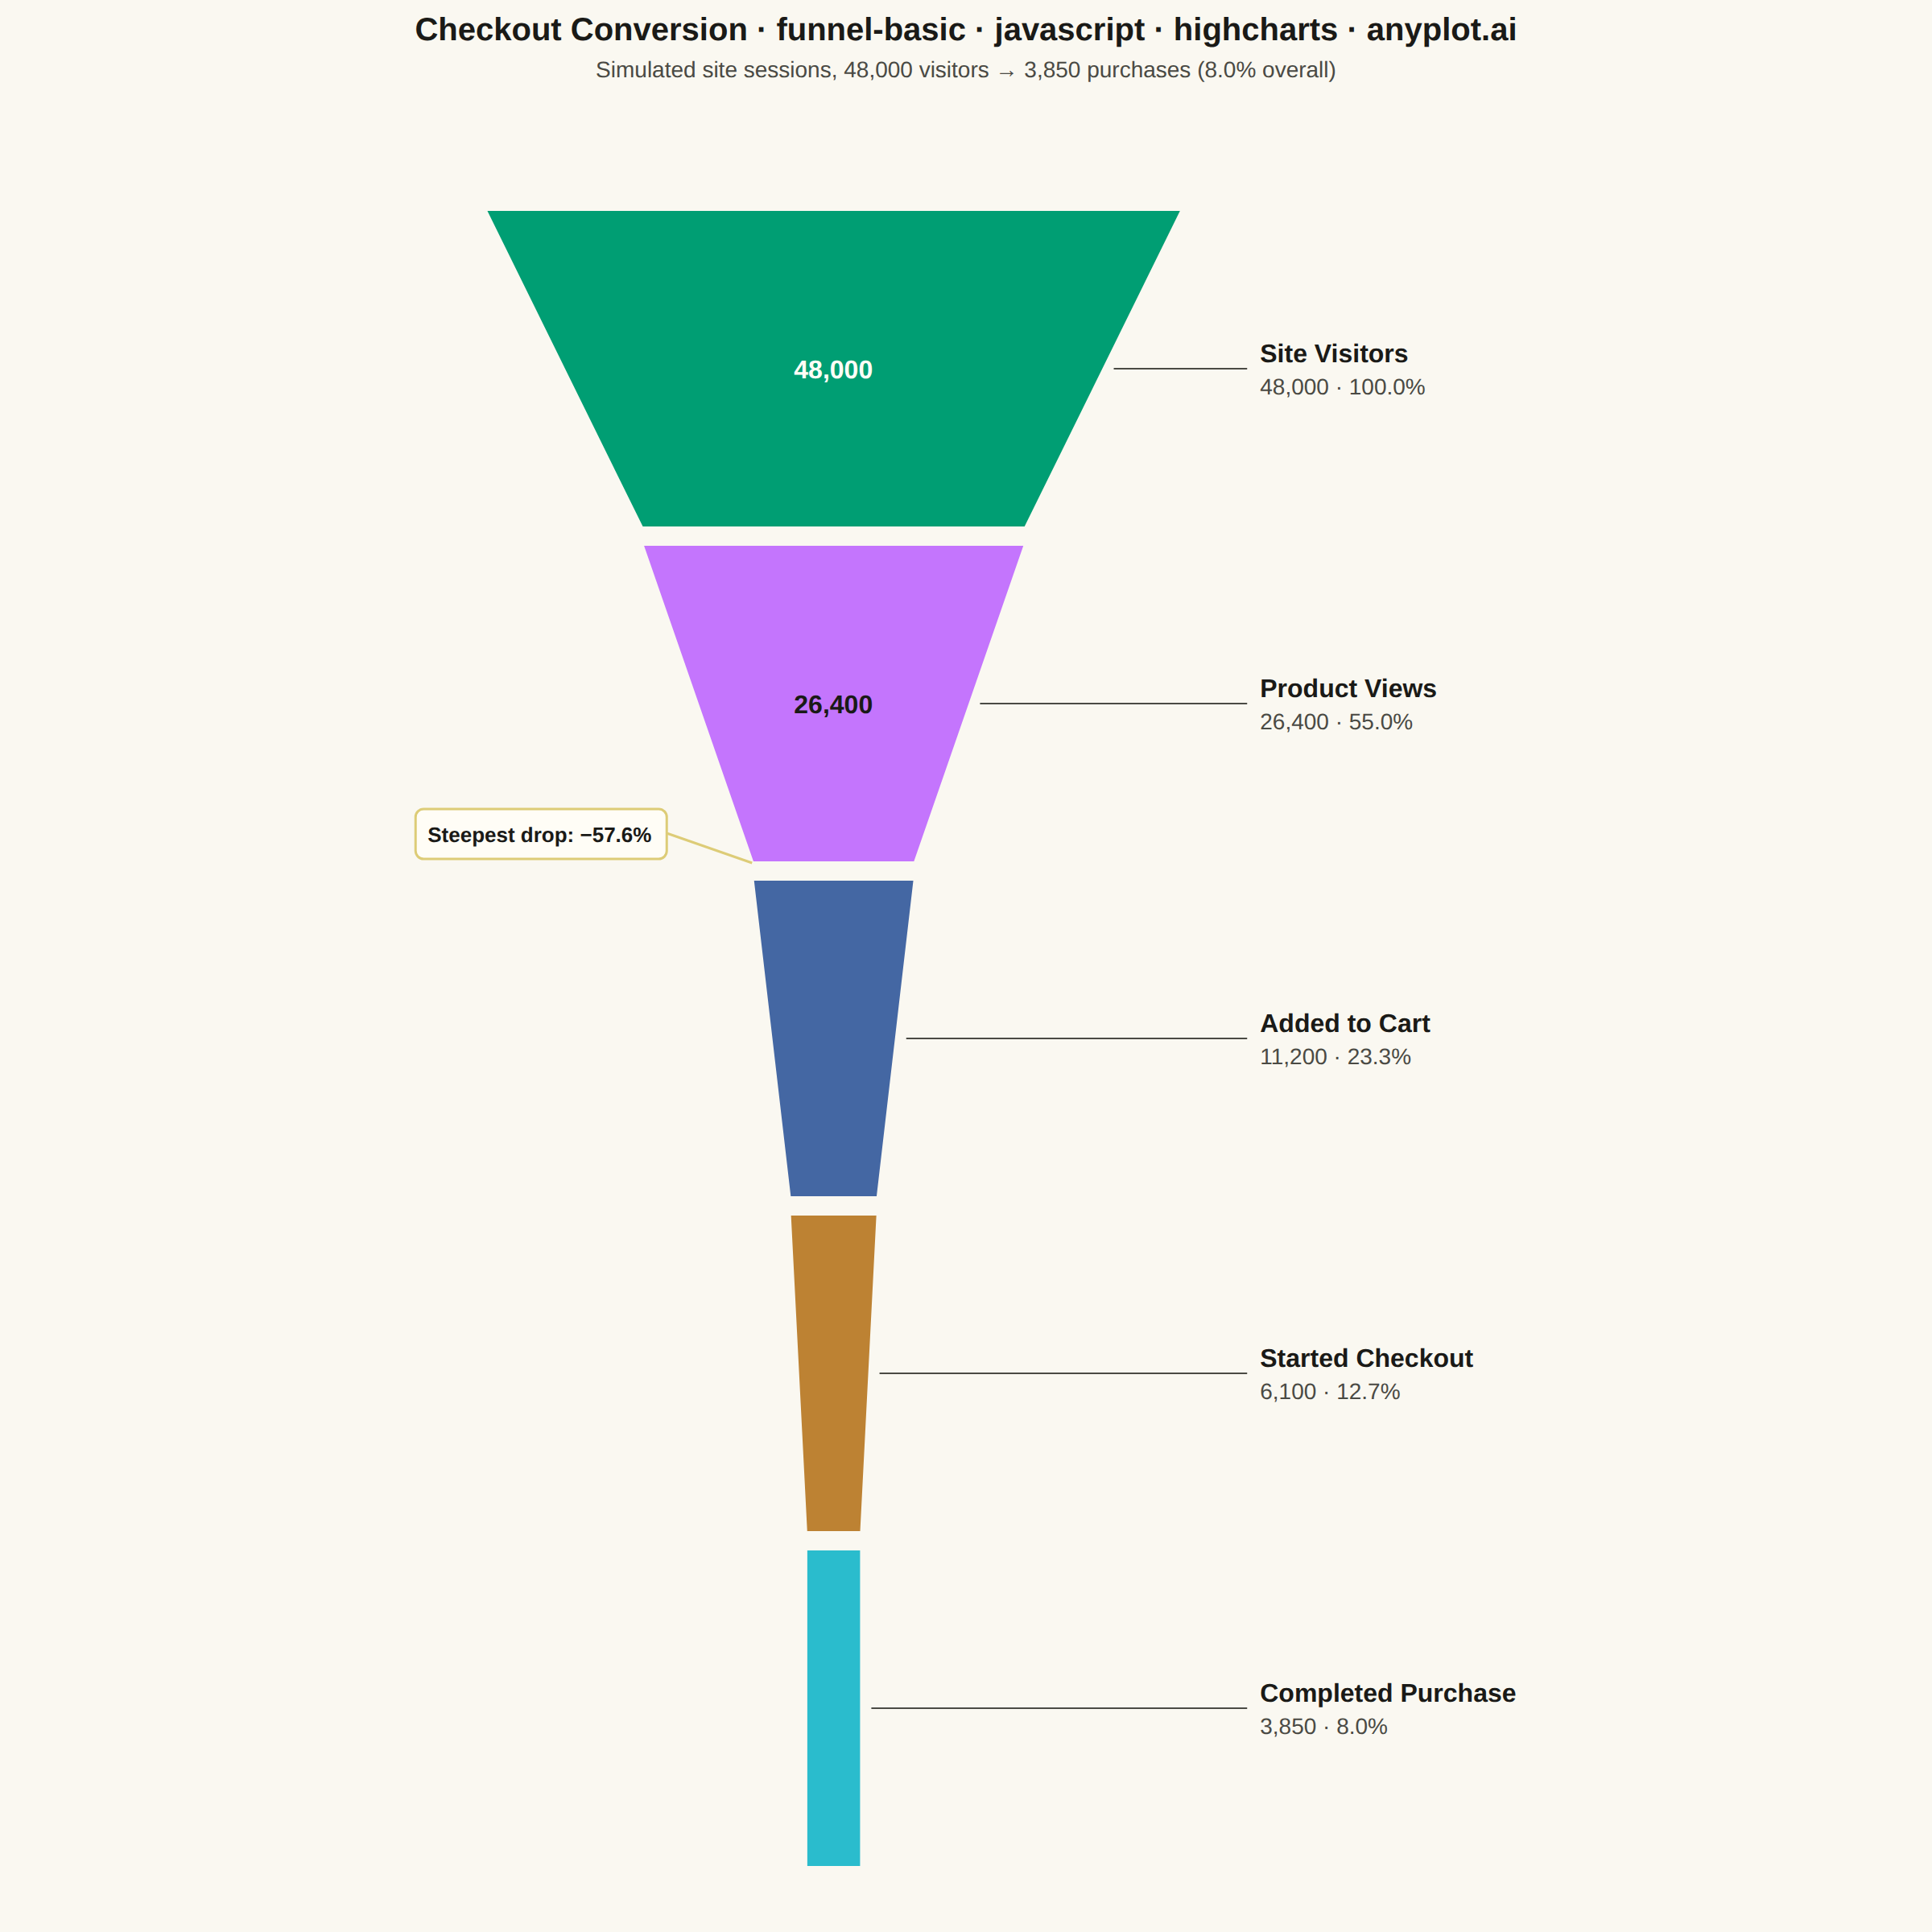
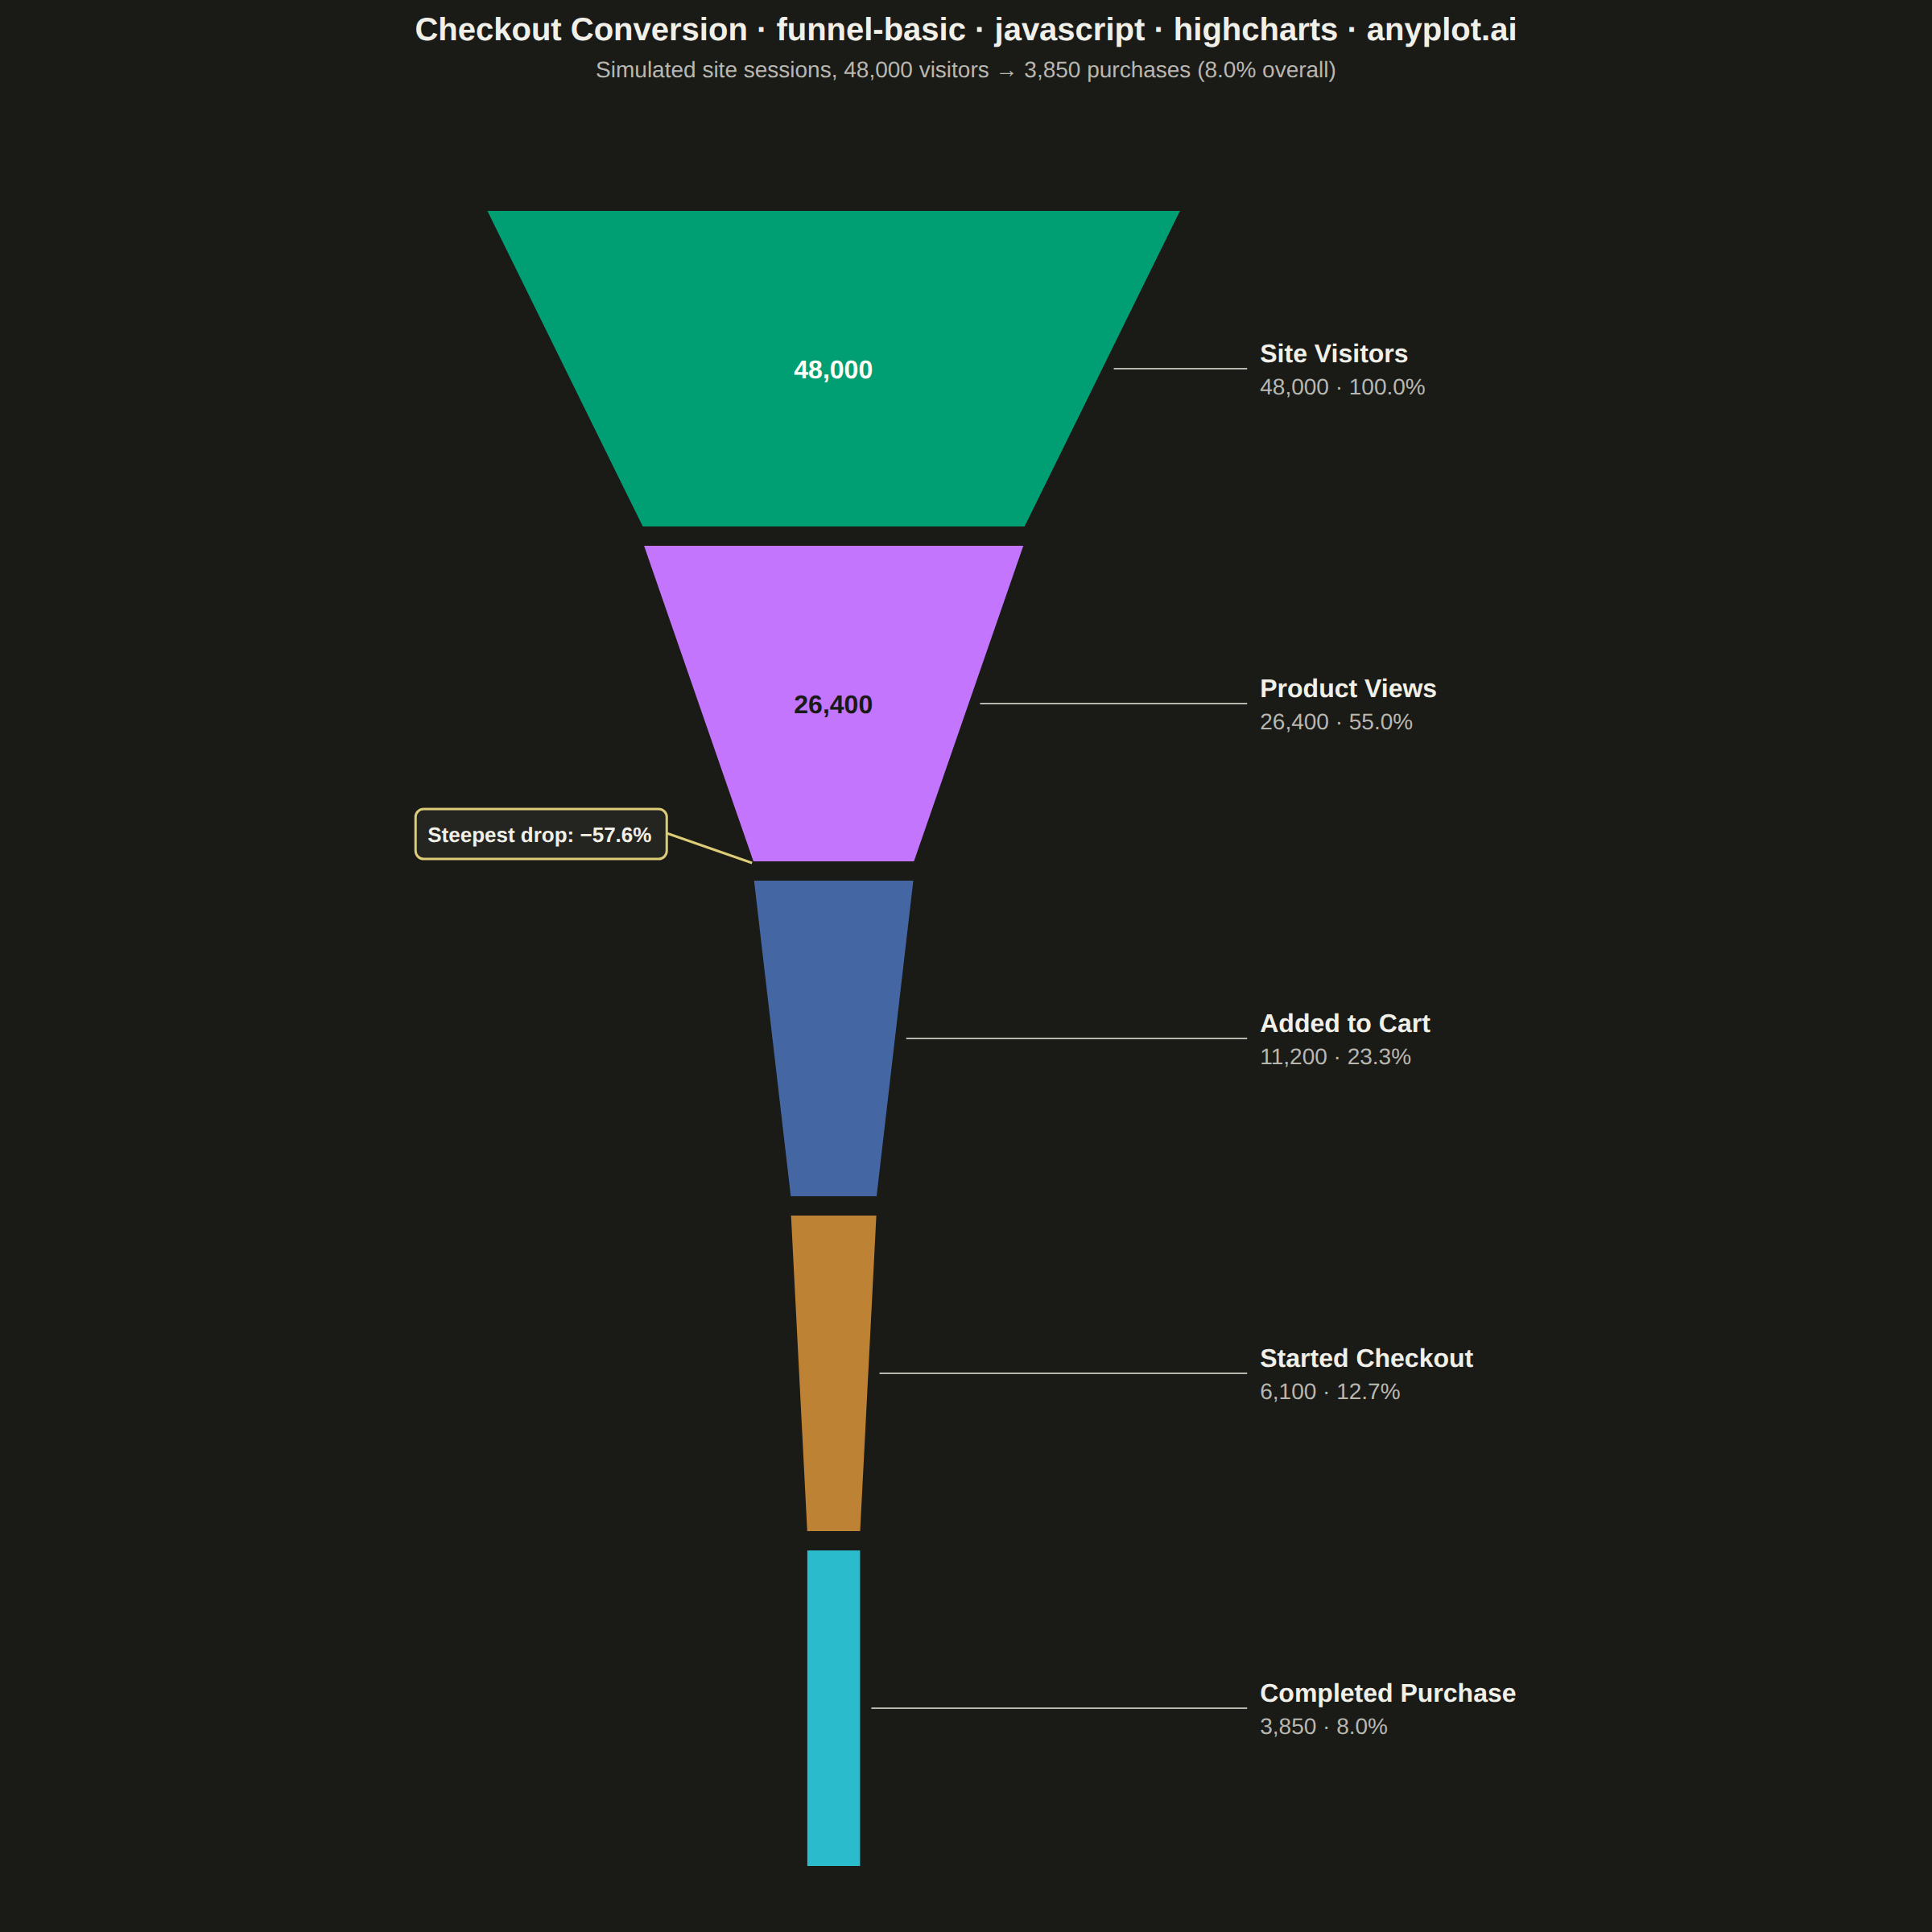
A funnel chart visualizes sequential stages of a process where values progressively decrease from one stage to the next. Each stage is represented as a trapezoidal segment that narrows from top to bottom, making it easy to identify drop-offs between stages. This chart is ideal for tracking conversion rates, sales pipelines, and multi-step processes where understanding stage-to-stage transitions is critical.
// anyplot.ai
// funnel-basic: Basic Funnel Chart
// Library: highcharts 12.6.0 | JavaScript 22.23.2
// Quality: 92/100 | Created: 2026-09-05

//# anyplot-orientation: square

// Only the core Highcharts bundle is loaded (no `funnel` module), so the
// trapezoid stack is computed by hand and drawn with `chart.renderer.path()`
// — the same hand-drawn technique treemap-basic / sunburst-basic / sankey-basic
// use for series types the core bundle doesn't ship. Each segment gets a
// native SVG `<title>` for hover (same trick as treemap-basic).

const t = window.ANYPLOT_TOKENS;

// --- Data: e-commerce checkout funnel (unique site sessions) ---------------
const STAGES = ["Site Visitors", "Product Views", "Added to Cart", "Started Checkout", "Completed Purchase"];
const VALUES = [48000, 26400, 11200, 6100, 3850];

// Position 5 (matte red) is the deferred bad/error anchor — skip it here
// since the narrowest stage is a successful purchase, not a failure, and
// pick cyan instead so palette order never implies the funnel's happy
// ending is "bad". See default-style-guide.md "Semantic exception".
const COLORS = [t.palette[0], t.palette[1], t.palette[2], t.palette[3], t.palette[5]];

const n = STAGES.length;
const pct = (v) => `${((v / VALUES[0]) * 100).toFixed(1)}%`;
const fmt = (v) => v.toLocaleString("en-US");

// --- Title (fontsize scaled off the 67-char baseline) -----------------------
const TITLE_TEXT = "Checkout Conversion · funnel-basic · javascript · highcharts · anyplot.ai";
const TITLE_FS = Math.max(Math.round(22 * Math.min(1, 67 / TITLE_TEXT.length)), 14);

// --- Chart shell (no series/axes — the funnel is drawn by hand) ------------
const chart = Highcharts.chart("container", {
  chart: {
    backgroundColor: "transparent",
    animation: false,
    style: { fontFamily: "inherit" },
    marginTop: 130,
    marginBottom: 40,
    marginLeft: 40,
    marginRight: 40,
  },
  credits: { enabled: false },
  title: {
    text: TITLE_TEXT,
    style: { color: t.ink, fontSize: TITLE_FS + "px", fontWeight: "600" },
  },
  subtitle: {
    text: `Simulated site sessions, ${fmt(VALUES[0])} visitors → ${fmt(VALUES[n - 1])} purchases (${pct(VALUES[n - 1])} overall)`,
    style: { color: t.inkSoft, fontSize: "14px" },
  },
  xAxis: { visible: false },
  yAxis: { visible: false },
  legend: { enabled: false },
  plotOptions: { series: { animation: false } },
  series: [],
});

const PLOT_W = chart.plotWidth;
const PLOT_H = chart.plotHeight;
const GAP = 10;

// First-pass layout: a rough block split just wide enough to hold the
// funnel + label gutter. The label strings are variable-width, so this
// guess is deliberately not centered on the canvas yet — the whole
// composition (funnel + leader lines + labels) is drawn into group `g`
// below, then re-centered on `g`'s *actual* rendered bounding box (real
// text extents, not the abstract split) so left/right whitespace balances
// symmetrically regardless of how wide the label strings turn out to be.
const BLOCK_W = PLOT_W * 0.86;
const blockLeft = chart.plotLeft + (PLOT_W - BLOCK_W) / 2;
const funnelZoneW = BLOCK_W * 0.5;

const centerX = blockLeft + funnelZoneW / 2;
const maxHalfWidth = (funnelZoneW / 2) * 0.9;
const labelX = blockLeft + funnelZoneW + 24;

const scale = maxHalfWidth / VALUES[0];
const halfWidths = VALUES.map((v) => v * scale);
const bandHeight = (PLOT_H - (n - 1) * GAP) / n;

// Steepest stage-to-stage drop-off (largest relative loss from one stage
// to the next, i.e. the transition with the lowest stage-over-stage
// conversion rate), called out below with a native Highcharts renderer
// "callout" label pointing at the transition.
const dropRates = VALUES.slice(0, -1).map((v, i) => 1 - VALUES[i + 1] / v);
const steepestIdx = dropRates.indexOf(Math.max(...dropRates));
let dropAnchor = null;

function addTooltip(el, text) {
  const titleEl = document.createElementNS("http://www.w3.org/2000/svg", "title");
  titleEl.textContent = text;
  el.element.appendChild(titleEl);
}

function labelColorFor(bgHex) {
  const c = parseInt(bgHex.slice(1), 16);
  const r = (c >> 16) & 255;
  const g = (c >> 8) & 255;
  const b = c & 255;
  const luma = (0.299 * r + 0.587 * g + 0.114 * b) / 255;
  return luma > 0.55 ? "#1A1A17" : "#FFFDF6";
}

const g = chart.renderer.g("funnel").add();

STAGES.forEach((stage, i) => {
  const y0 = chart.plotTop + i * (bandHeight + GAP);
  const y1 = y0 + bandHeight;
  const topHalf = halfWidths[i];
  // Last stage has no next value to taper into — render it as a flat-bottomed
  // band (its own width top and bottom) rather than inventing a taper amount.
  const bottomHalf = i < n - 1 ? halfWidths[i + 1] : halfWidths[i];

  if (i === steepestIdx) {
    dropAnchor = { x: centerX - bottomHalf, y: y1 };
  }

  const path = [
    ["M", centerX - topHalf, y0],
    ["L", centerX + topHalf, y0],
    ["L", centerX + bottomHalf, y1],
    ["L", centerX - bottomHalf, y1],
    ["Z"],
  ];

  const segment = chart.renderer
    .path(path)
    .attr({ fill: COLORS[i], stroke: t.pageBg, "stroke-width": 2, zIndex: 2 })
    .add(g);
  addTooltip(segment, `${stage}\n${fmt(VALUES[i])} (${pct(VALUES[i])} of visitors)`);

  // In-segment value label when the band is wide enough to hold it legibly.
  const midY = (y0 + y1) / 2;
  const avgHalf = (topHalf + bottomHalf) / 2;
  if (avgHalf > 55) {
    chart.renderer
      .text(fmt(VALUES[i]), centerX, midY + 6)
      .attr({ align: "center", zIndex: 3 })
      .css({ color: labelColorFor(COLORS[i]), fontSize: "16px", fontWeight: "600", pointerEvents: "none" })
      .add(g);
  }

  // Leader line + stage label in the right-hand gutter.
  const leaderStartX = centerX + avgHalf + 6;
  chart.renderer
    .path([
      ["M", leaderStartX, midY],
      ["L", labelX - 8, midY],
    ])
    .attr({ stroke: t.inkSoft, "stroke-width": 1, zIndex: 1 })
    .add(g);

  chart.renderer
    .text(stage, labelX, midY - 4)
    .attr({ align: "left", zIndex: 3 })
    .css({ color: t.ink, fontSize: "16px", fontWeight: "600" })
    .add(g);
  chart.renderer
    .text(`${fmt(VALUES[i])} · ${pct(VALUES[i])}`, labelX, midY + 16)
    .attr({ align: "left", zIndex: 3 })
    .css({ color: t.inkSoft, fontSize: "14px" })
    .add(g);
});

// Call out the steepest stage-to-stage drop-off with a native Highcharts
// SVGRenderer "callout" label (bordered, pointer anchored at the transition)
// — a distinctive Highcharts component, not a plain SVG <text>.
if (dropAnchor) {
  const calloutText = `Steepest drop: −${(dropRates[steepestIdx] * 100).toFixed(1)}%`;
  const calloutX = Math.max(chart.plotLeft + 4, dropAnchor.x - 210);
  const calloutY = dropAnchor.y - 34;
  chart.renderer
    .label(calloutText, calloutX, calloutY, "callout", dropAnchor.x, dropAnchor.y)
    .css({ color: t.ink, fontSize: "13px", fontWeight: "600" })
    .attr({ fill: t.elevatedBg, stroke: t.amber, "stroke-width": 1.5, padding: 8, r: 5, zIndex: 4 })
    .add(g);
}

// Re-center the whole composition (funnel + leader lines + labels +
// callout) on its *actual* rendered bounding box — real text extents,
// not the abstract BLOCK_W split above — so left/right whitespace
// balances symmetrically instead of trailing off wherever the
// variable-width label strings happen to end.
const bbox = g.getBBox(true);
const shift = chart.plotLeft + PLOT_W / 2 - (bbox.x + bbox.width / 2);
g.attr({ translateX: shift });
Runnable source as JSON, for any HTTP client: https://api.anyplot.ai/specs/funnel-basic/highcharts/code. Any spec id and library id listed in llms-full.txt fit the same URL shape; every URL below is complete and callable.
{
  "spec_id": "funnel-basic",
  "language": "javascript",
  "library": "highcharts",
  "page": "https://anyplot.ai/funnel-basic/javascript/highcharts",
  "hub": "https://anyplot.ai/funnel-basic",
  "code_json": "https://api.anyplot.ai/specs/funnel-basic/highcharts/code",
  "spec_json": "https://api.anyplot.ai/specs/funnel-basic",
  "render_light_png": "https://storage.googleapis.com/anyplot-images/plots/funnel-basic/javascript/highcharts/plot-light.png",
  "render_dark_png": "https://storage.googleapis.com/anyplot-images/plots/funnel-basic/javascript/highcharts/plot-dark.png",
  "interactive_light_html": "https://storage.googleapis.com/anyplot-images/plots/funnel-basic/javascript/highcharts/plot-light.html",
  "interactive_dark_html": "https://storage.googleapis.com/anyplot-images/plots/funnel-basic/javascript/highcharts/plot-dark.html",
  "quality_score": 92.0,
  "license": "MIT",
  "guide": "https://anyplot.ai/llms.txt"
}
Part of Basic Funnel Chart on anyplot.ai.