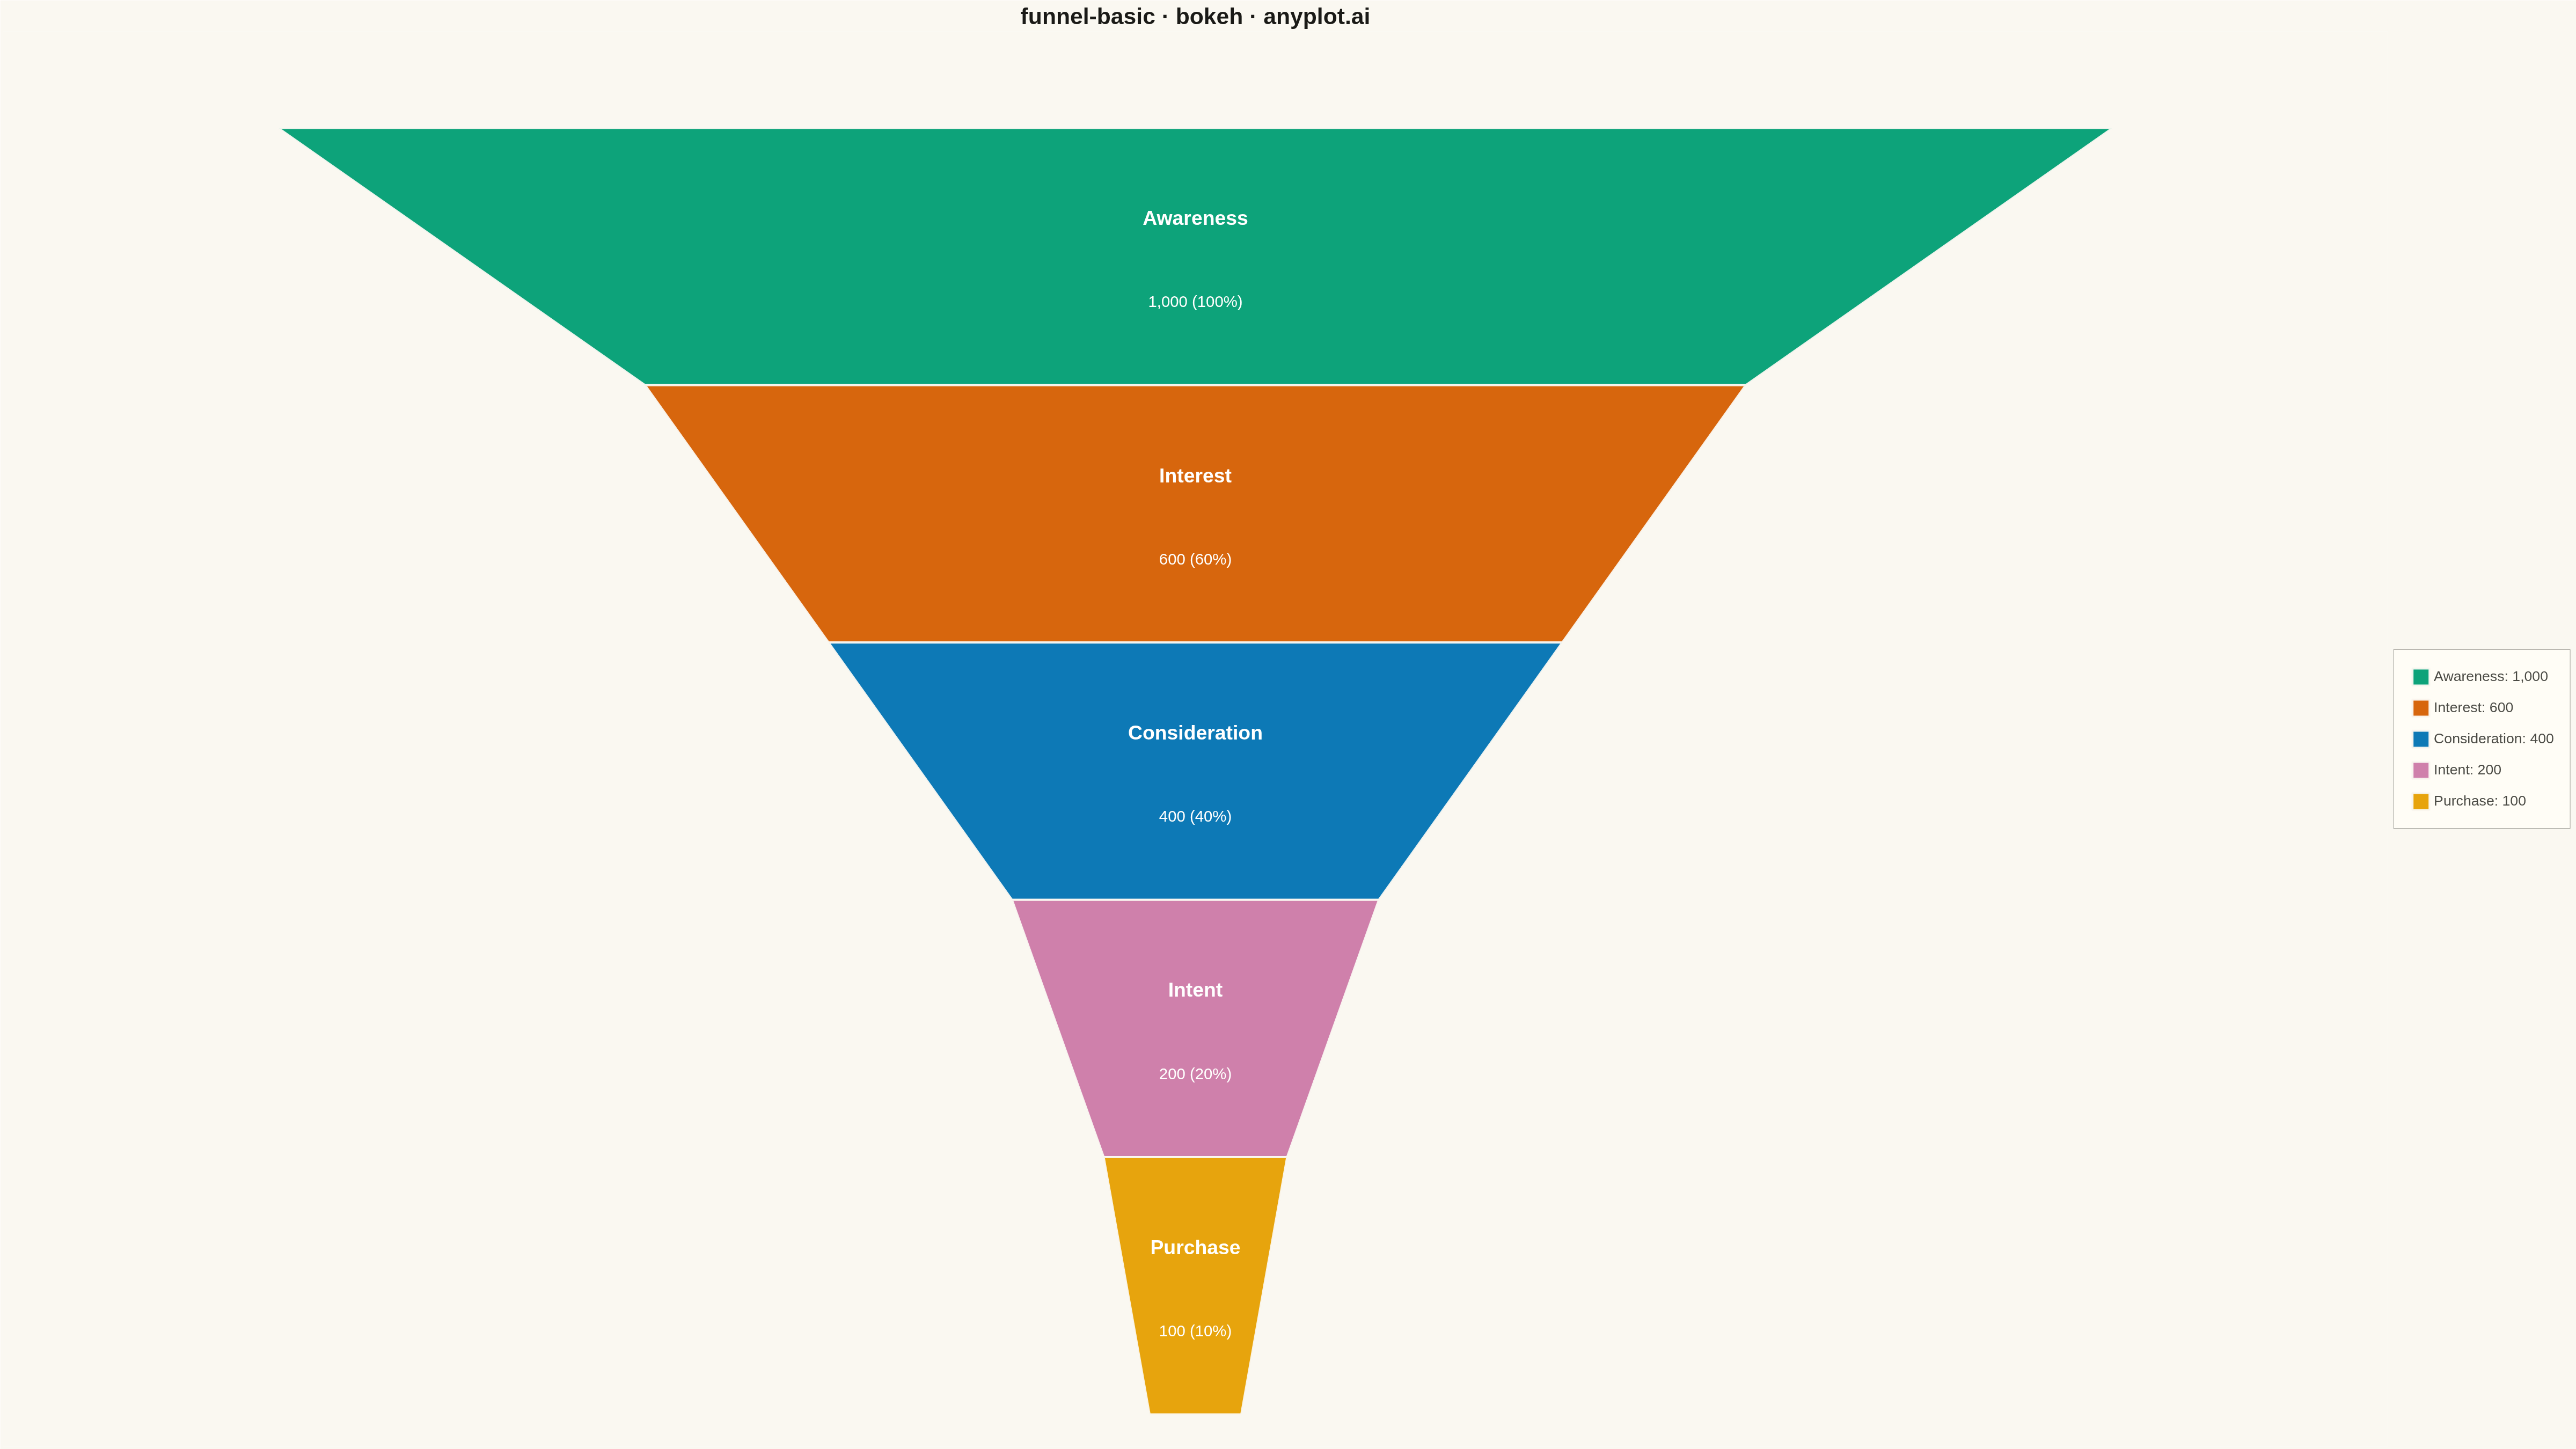
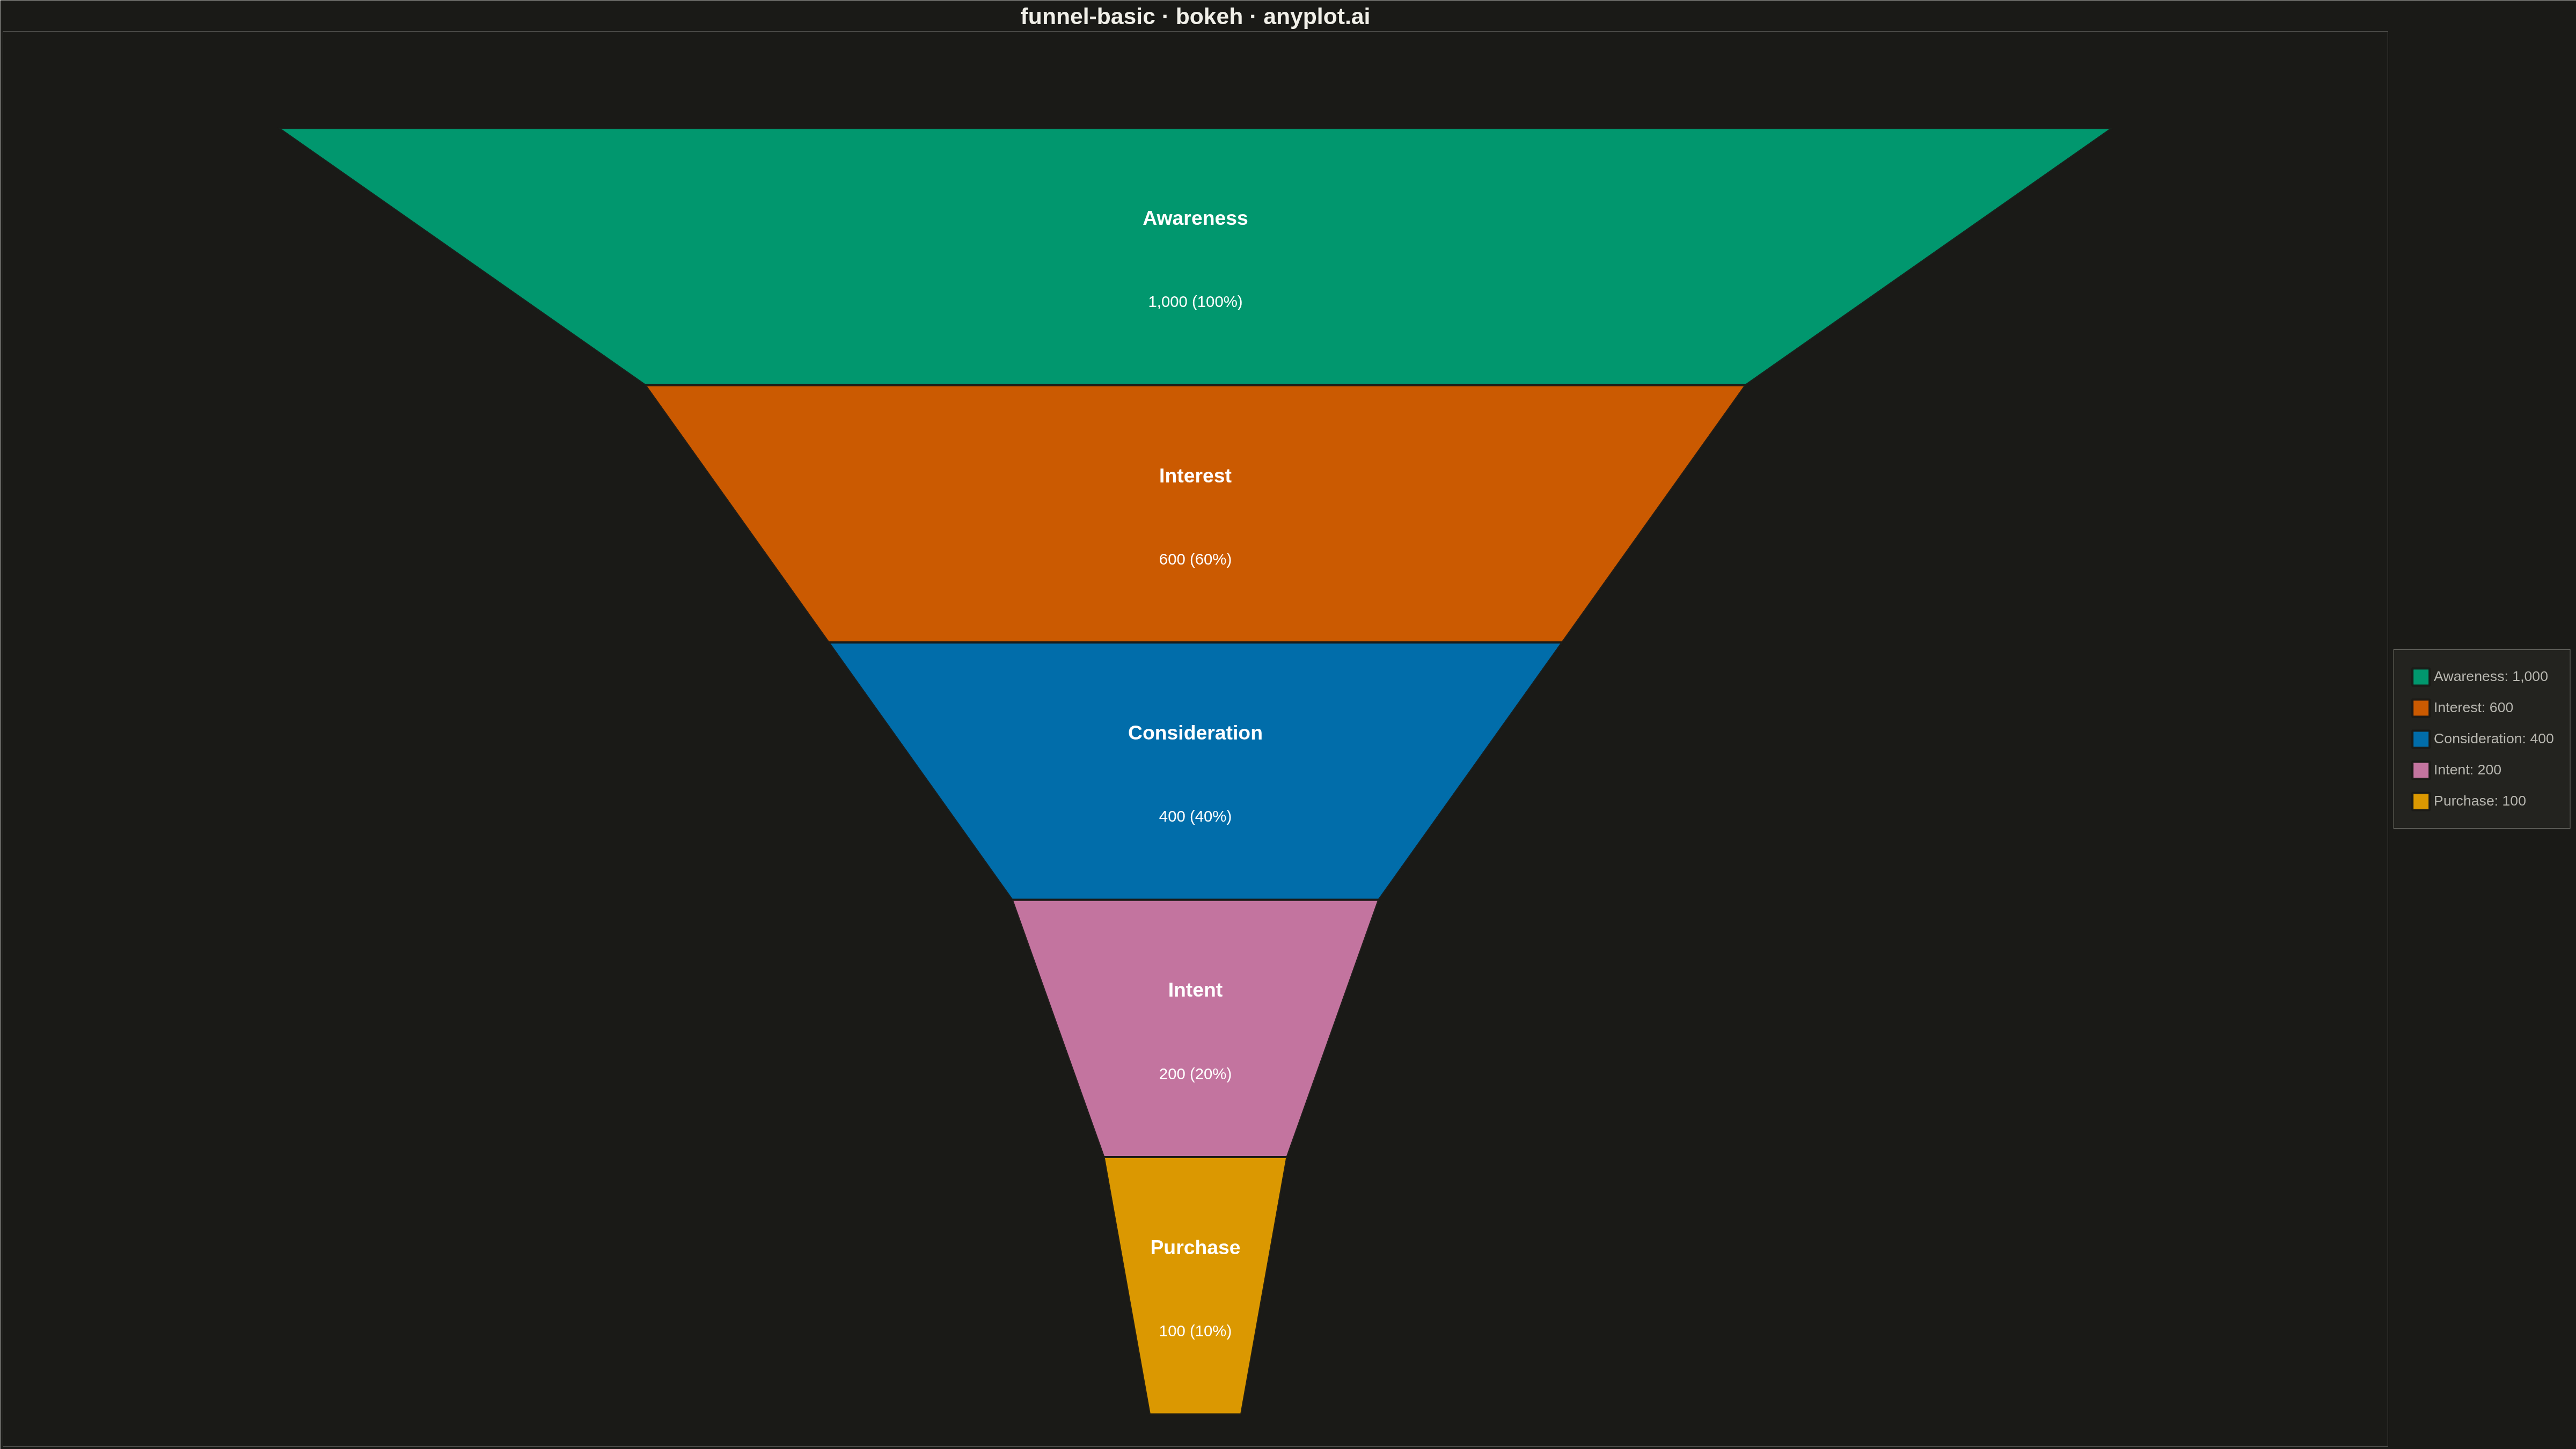
A funnel chart visualizes sequential stages of a process where values progressively decrease from one stage to the next. Each stage is represented as a trapezoidal segment that narrows from top to bottom, making it easy to identify drop-offs between stages. This chart is ideal for tracking conversion rates, sales pipelines, and multi-step processes where understanding stage-to-stage transitions is critical.
""" anyplot.ai
funnel-basic: Basic Funnel Chart
Library: bokeh 3.9.0 | Python 3.14.4
Quality: 86/100 | Updated: 2026-04-26
"""

from bokeh.io import export_png, output_file, save
from bokeh.models import Label, Legend, LegendItem
from bokeh.plotting import figure


# Data - Sales funnel stages (from spec example)
stages = ["Awareness", "Interest", "Consideration", "Intent", "Purchase"]
values = [1000, 600, 400, 200, 100]

# Colors - distinct for each stage (Python Blue first, then colorblind-safe palette)
colors = ["#306998", "#FFD43B", "#E74C3C", "#9B59B6", "#27AE60"]

# Calculate widths proportional to values (relative to first/largest value)
max_value = values[0]
widths = [v / max_value for v in values]

# Funnel parameters
funnel_height = 2.0  # Total height of funnel
stage_height = funnel_height / len(stages)
center_x = 0.5  # Center of funnel

# Build funnel segments as patches (trapezoids)
# Each segment connects the width at its top to the width at its bottom
segment_coords = []
for i in range(len(stages)):
    top_width = widths[i]
    # Bottom width is next stage width, or 50% of current for last stage
    bottom_width = widths[i + 1] if i < len(stages) - 1 else widths[i] * 0.5

    top_y = funnel_height - i * stage_height
    bottom_y = top_y - stage_height

    # Trapezoid coordinates (clockwise from top-left)
    xs = [
        center_x - top_width / 2,  # top-left
        center_x + top_width / 2,  # top-right
        center_x + bottom_width / 2,  # bottom-right
        center_x - bottom_width / 2,  # bottom-left
    ]
    ys = [top_y, top_y, bottom_y, bottom_y]
    segment_coords.append((xs, ys))

# Create figure (4800 x 2700 px)
p = figure(
    width=4800,
    height=2700,
    title="funnel-basic · bokeh · pyplots.ai",
    x_range=(-0.3, 1.3),
    y_range=(-0.3, 2.3),
    tools="",
    toolbar_location=None,
)

# Draw funnel segments and collect renderers for legend
renderers = []
for (xs, ys), color in zip(segment_coords, colors, strict=True):
    r = p.patch(xs, ys, fill_color=color, line_color="white", line_width=4, alpha=0.9)
    renderers.append(r)

# Add labels on each segment (stage name and value/percentage)
for i, (stage, value) in enumerate(zip(stages, values, strict=True)):
    xs, ys = segment_coords[i]
    # Label position: center of trapezoid
    center_y = (ys[0] + ys[2]) / 2

    # Calculate percentage relative to first stage
    percentage = (value / max_value) * 100

    # Stage name label (dark text for yellow, white for others)
    text_color = "#333333" if colors[i] == "#FFD43B" else "white"
    stage_label = Label(
        x=center_x,
        y=center_y + 0.06,
        text=stage,
        text_font_size="28pt",
        text_font_style="bold",
        text_color=text_color,
        text_align="center",
        text_baseline="middle",
    )
    p.add_layout(stage_label)

    # Value label
    value_label = Label(
        x=center_x,
        y=center_y - 0.06,
        text=f"{value:,} ({percentage:.0f}%)",
        text_font_size="22pt",
        text_color=text_color,
        text_align="center",
        text_baseline="middle",
    )
    p.add_layout(value_label)

# Create legend
legend_items = [LegendItem(label=f"{stages[i]}: {values[i]:,}", renderers=[renderers[i]]) for i in range(len(stages))]
legend = Legend(
    items=legend_items,
    location="center_right",
    label_text_font_size="24pt",
    glyph_width=40,
    glyph_height=40,
    spacing=20,
    padding=30,
    background_fill_alpha=0.9,
    border_line_color="#cccccc",
)
p.add_layout(legend, "right")

# Styling
p.title.text_font_size = "36pt"
p.title.align = "center"

# Hide axes and grid for funnel chart
p.axis.visible = False
p.grid.visible = False
p.outline_line_color = None

# Save outputs
export_png(p, filename="plot.png")

# Also save interactive HTML
output_file("plot.html")
save(p)
Runnable source as JSON, for any HTTP client: https://api.anyplot.ai/specs/funnel-basic/bokeh/code. Any spec id and library id listed in llms-full.txt fit the same URL shape; every URL below is complete and callable.
{
  "spec_id": "funnel-basic",
  "language": "python",
  "library": "bokeh",
  "page": "https://anyplot.ai/funnel-basic/python/bokeh",
  "hub": "https://anyplot.ai/funnel-basic",
  "code_json": "https://api.anyplot.ai/specs/funnel-basic/bokeh/code",
  "spec_json": "https://api.anyplot.ai/specs/funnel-basic",
  "render_light_png": "https://storage.googleapis.com/anyplot-images/plots/funnel-basic/python/bokeh/plot-light.png",
  "render_dark_png": "https://storage.googleapis.com/anyplot-images/plots/funnel-basic/python/bokeh/plot-dark.png",
  "interactive_light_html": "https://storage.googleapis.com/anyplot-images/plots/funnel-basic/python/bokeh/plot-light.html",
  "interactive_dark_html": "https://storage.googleapis.com/anyplot-images/plots/funnel-basic/python/bokeh/plot-dark.html",
  "quality_score": 86.0,
  "license": "MIT",
  "guide": "https://anyplot.ai/llms.txt"
}
Part of Basic Funnel Chart on anyplot.ai.