The same plot in 14 other libraries — Python: Altair, Bokeh, lets-plot, Matplotlib, Plotly, plotnine, Pygal, Seaborn; R: ggplot2; JavaScript: Chart.js, D3.js, Apache ECharts, Highcharts, MUI X Charts. Compare all 15 side by side: Basic Funnel Chart in Python, R, Julia and JavaScript.
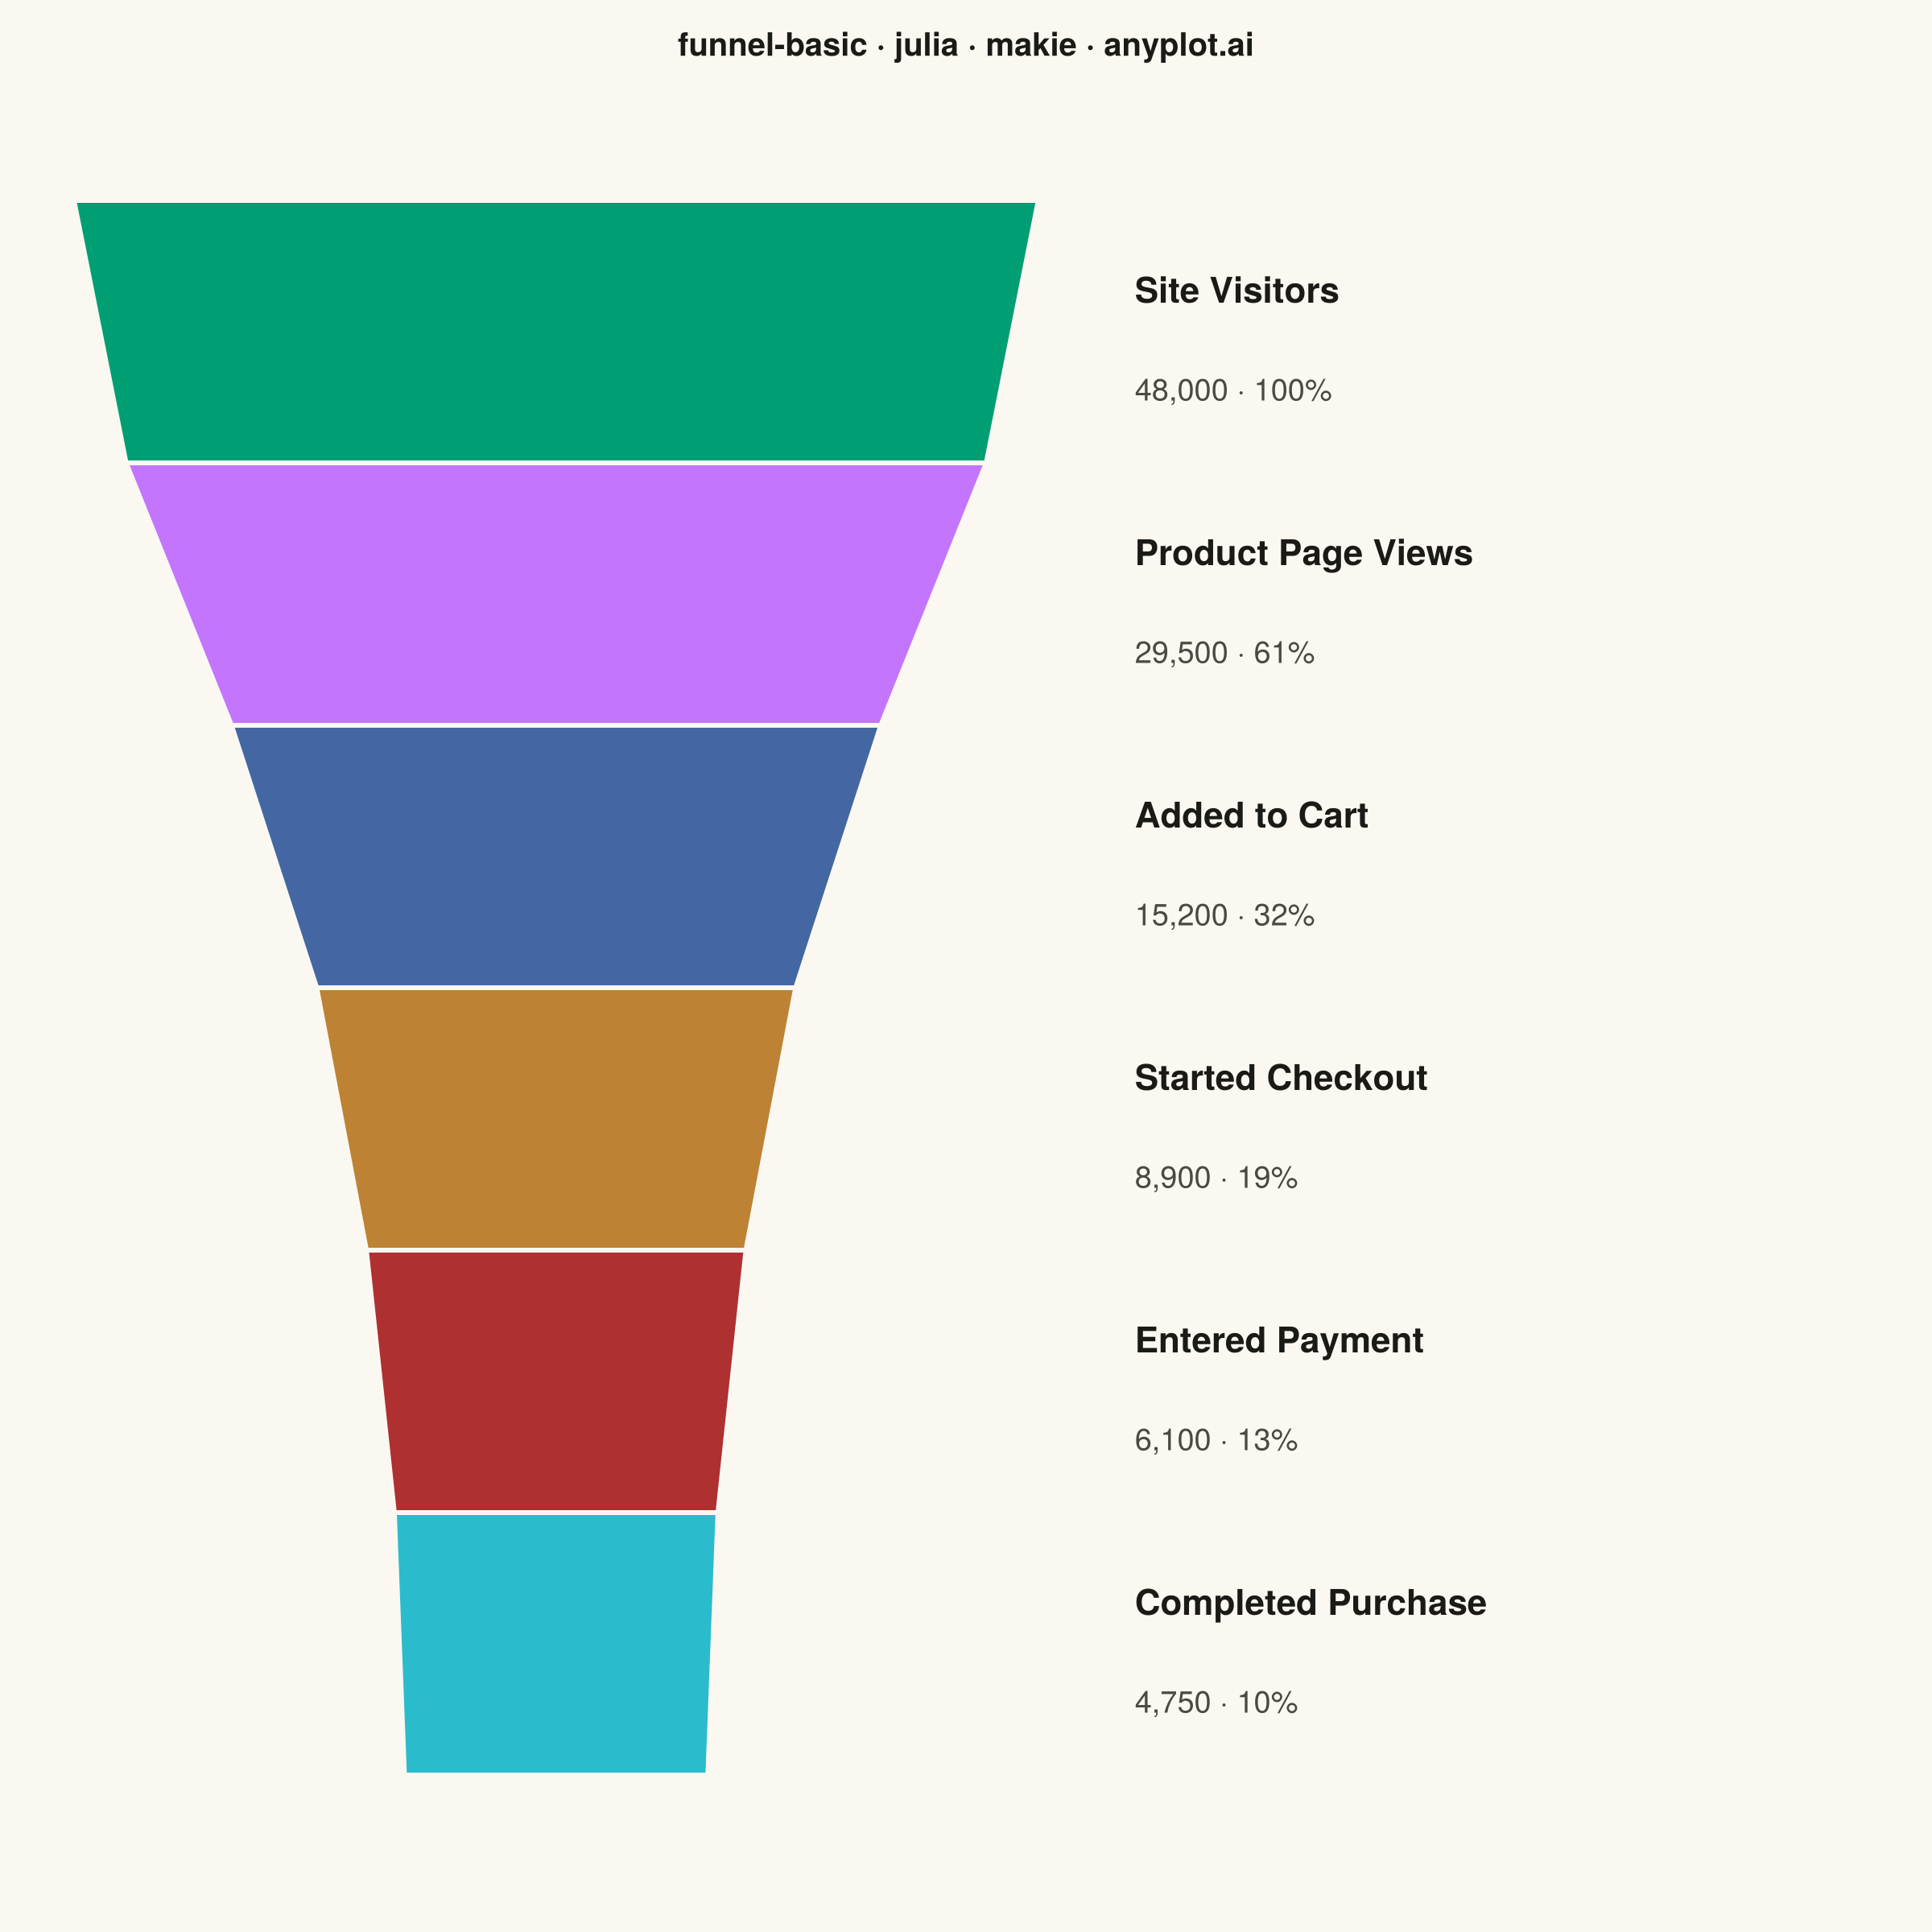
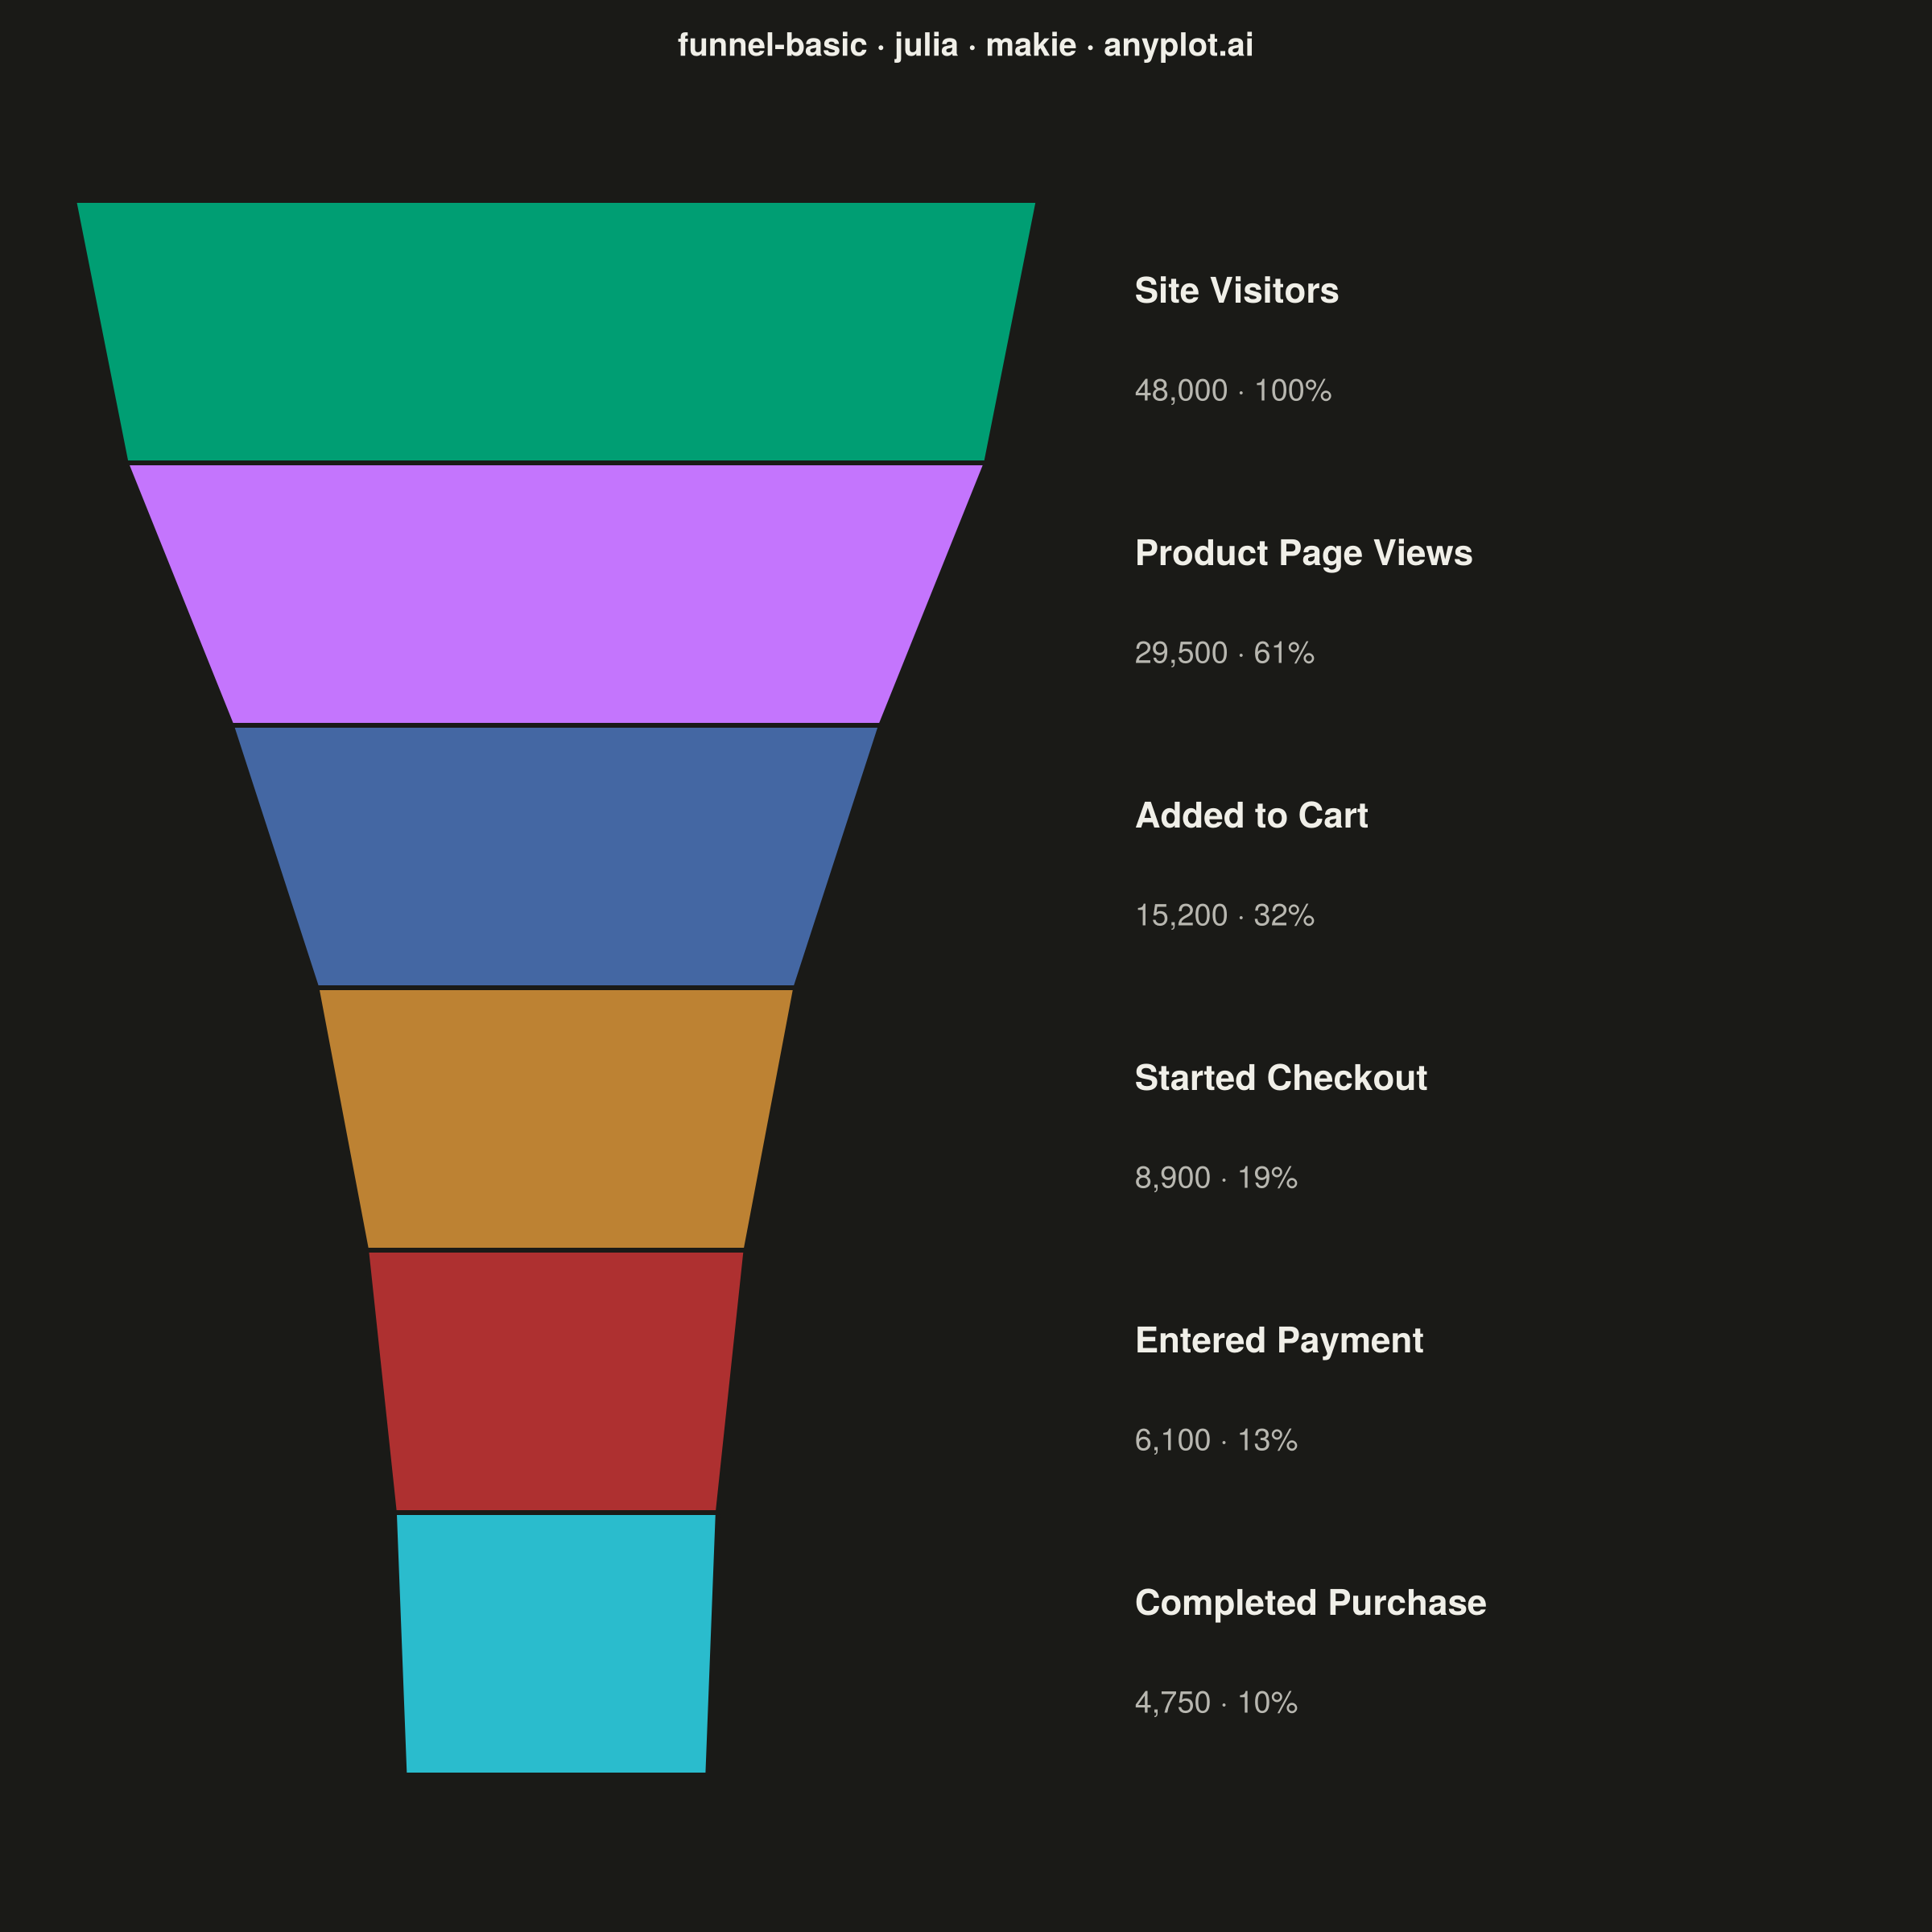
A funnel chart visualizes sequential stages of a process where values progressively decrease from one stage to the next. Each stage is represented as a trapezoidal segment that narrows from top to bottom, making it easy to identify drop-offs between stages. This chart is ideal for tracking conversion rates, sales pipelines, and multi-step processes where understanding stage-to-stage transitions is critical.
# anyplot.ai
# funnel-basic: Basic Funnel Chart
# Library: makie 0.21.9 | Julia 1.11.9
# Quality: 87/100 | Created: 2026-09-05

using CairoMakie
using Colors

# --- Theme tokens -----------------------------------------------------------
const THEME    = get(ENV, "ANYPLOT_THEME", "light")
const PAGE_BG  = THEME == "light" ? colorant"#FAF8F1" : colorant"#1A1A17"
const INK      = THEME == "light" ? colorant"#1A1A17" : colorant"#F0EFE8"
const INK_SOFT = THEME == "light" ? colorant"#4A4A44" : colorant"#B8B7B0"
const IMPRINT_PALETTE = [
    colorant"#009E73", colorant"#C475FD", colorant"#4467A3", colorant"#BD8233",
    colorant"#AE3030", colorant"#2ABCCD", colorant"#954477", colorant"#99B314",
]

# --- Data: e-commerce checkout funnel ---------------------------------------
stages = [
    "Site Visitors", "Product Page Views", "Added to Cart",
    "Started Checkout", "Entered Payment", "Completed Purchase",
]
values = [48000, 29500, 15200, 8900, 6100, 4750]
value_display = ["48,000", "29,500", "15,200", "8,900", "6,100", "4,750"]
n = length(values)
percentages = round.(Int, values ./ values[1] .* 100)

# Each trapezoid tapers from the boundary above it to the boundary below it,
# so adjacent stages share an edge and the whole shape narrows continuously.
# A sqrt scale (rather than linear) keeps the taper visible through the tail
# of the funnel, where later stages would otherwise compress into a near-flat
# strip once their values are small relative to the first stage.
normalized = sqrt.(values ./ values[1])
max_half_width = 5.0
boundaries = Vector{Float64}(undef, n + 1)
boundaries[1] = normalized[1]
for i in 2:n
    boundaries[i] = (normalized[i - 1] + normalized[i]) / 2
end
boundaries[n + 1] = normalized[n]
half_widths = boundaries .* max_half_width

# --- Plot ---------------------------------------------------------------
fig = Figure(
    size            = (1200, 1200),
    fontsize        = 14,
    backgroundcolor = PAGE_BG,
)

ax = Axis(
    fig[1, 1];
    title           = "funnel-basic · julia · makie · anyplot.ai",
    titlesize       = 20,
    titlecolor      = INK,
    backgroundcolor = PAGE_BG,
)
hidedecorations!(ax)
hidespines!(ax)

for i in 1:n
    y_top = n - (i - 1)
    y_bottom = n - i
    top_hw = half_widths[i]
    bottom_hw = half_widths[i + 1]

    points = Point2f[
        (-top_hw, y_top), (top_hw, y_top),
        (bottom_hw, y_bottom), (-bottom_hw, y_bottom),
    ]
    poly!(ax, points; color = IMPRINT_PALETTE[i], strokecolor = PAGE_BG, strokewidth = 3)

    y_center = (y_top + y_bottom) / 2
    text!(
        ax, max_half_width + 1.0, y_center + 0.16;
        text = stages[i], color = INK, fontsize = 22,
        align = (:left, :center), font = :bold,
    )
    text!(
        ax, max_half_width + 1.0, y_center - 0.22;
        text = "$(value_display[i]) · $(percentages[i])%",
        color = INK_SOFT, fontsize = 19, align = (:left, :center),
    )
end

xlims!(ax, -max_half_width - 0.5, max_half_width + 9.0)
ylims!(ax, -0.5, n + 0.5)

# --- Save -----------------------------------------------------------------
save("plot-$(THEME).png", fig; px_per_unit = 2)
Runnable source as JSON, for any HTTP client: https://api.anyplot.ai/specs/funnel-basic/makie/code. Any spec id and library id listed in llms-full.txt fit the same URL shape; every URL below is complete and callable.
{
  "spec_id": "funnel-basic",
  "language": "julia",
  "library": "makie",
  "page": "https://anyplot.ai/funnel-basic/julia/makie",
  "hub": "https://anyplot.ai/funnel-basic",
  "code_json": "https://api.anyplot.ai/specs/funnel-basic/makie/code",
  "spec_json": "https://api.anyplot.ai/specs/funnel-basic",
  "render_light_png": "https://storage.googleapis.com/anyplot-images/plots/funnel-basic/julia/makie/plot-light.png",
  "render_dark_png": "https://storage.googleapis.com/anyplot-images/plots/funnel-basic/julia/makie/plot-dark.png",
  "quality_score": 87.0,
  "license": "MIT",
  "guide": "https://anyplot.ai/llms.txt"
}
Part of Basic Funnel Chart on anyplot.ai.