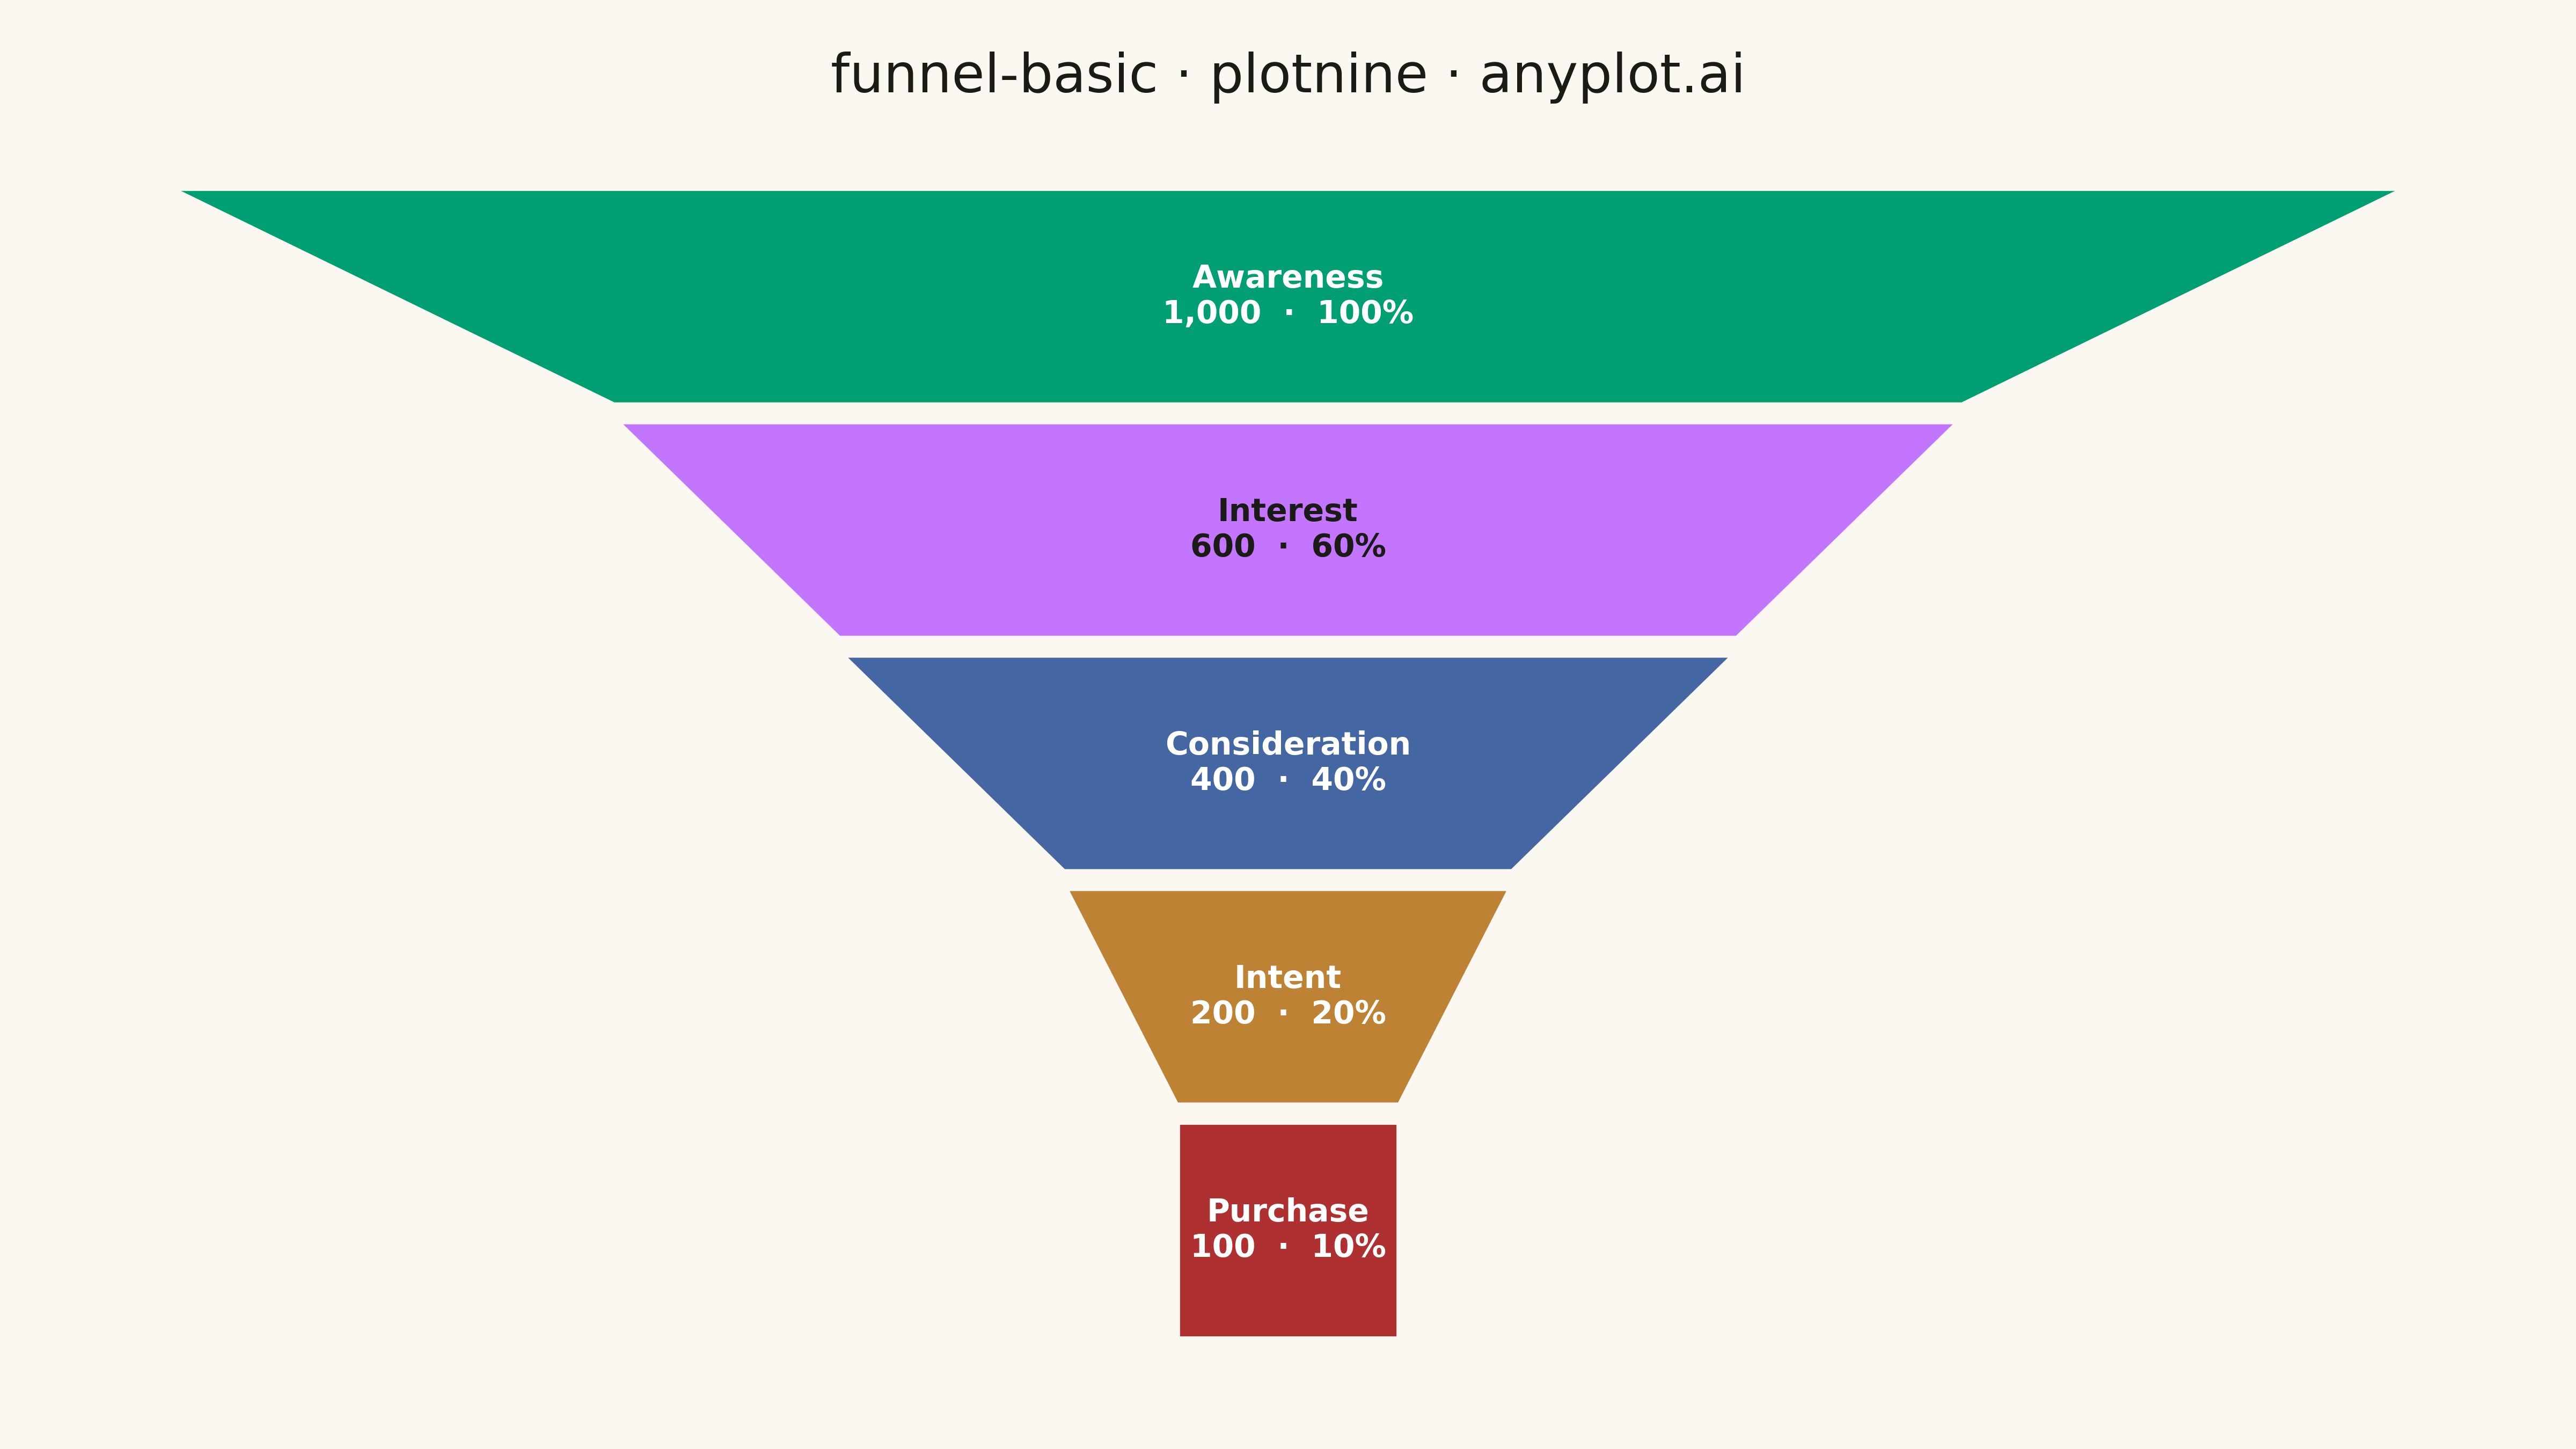
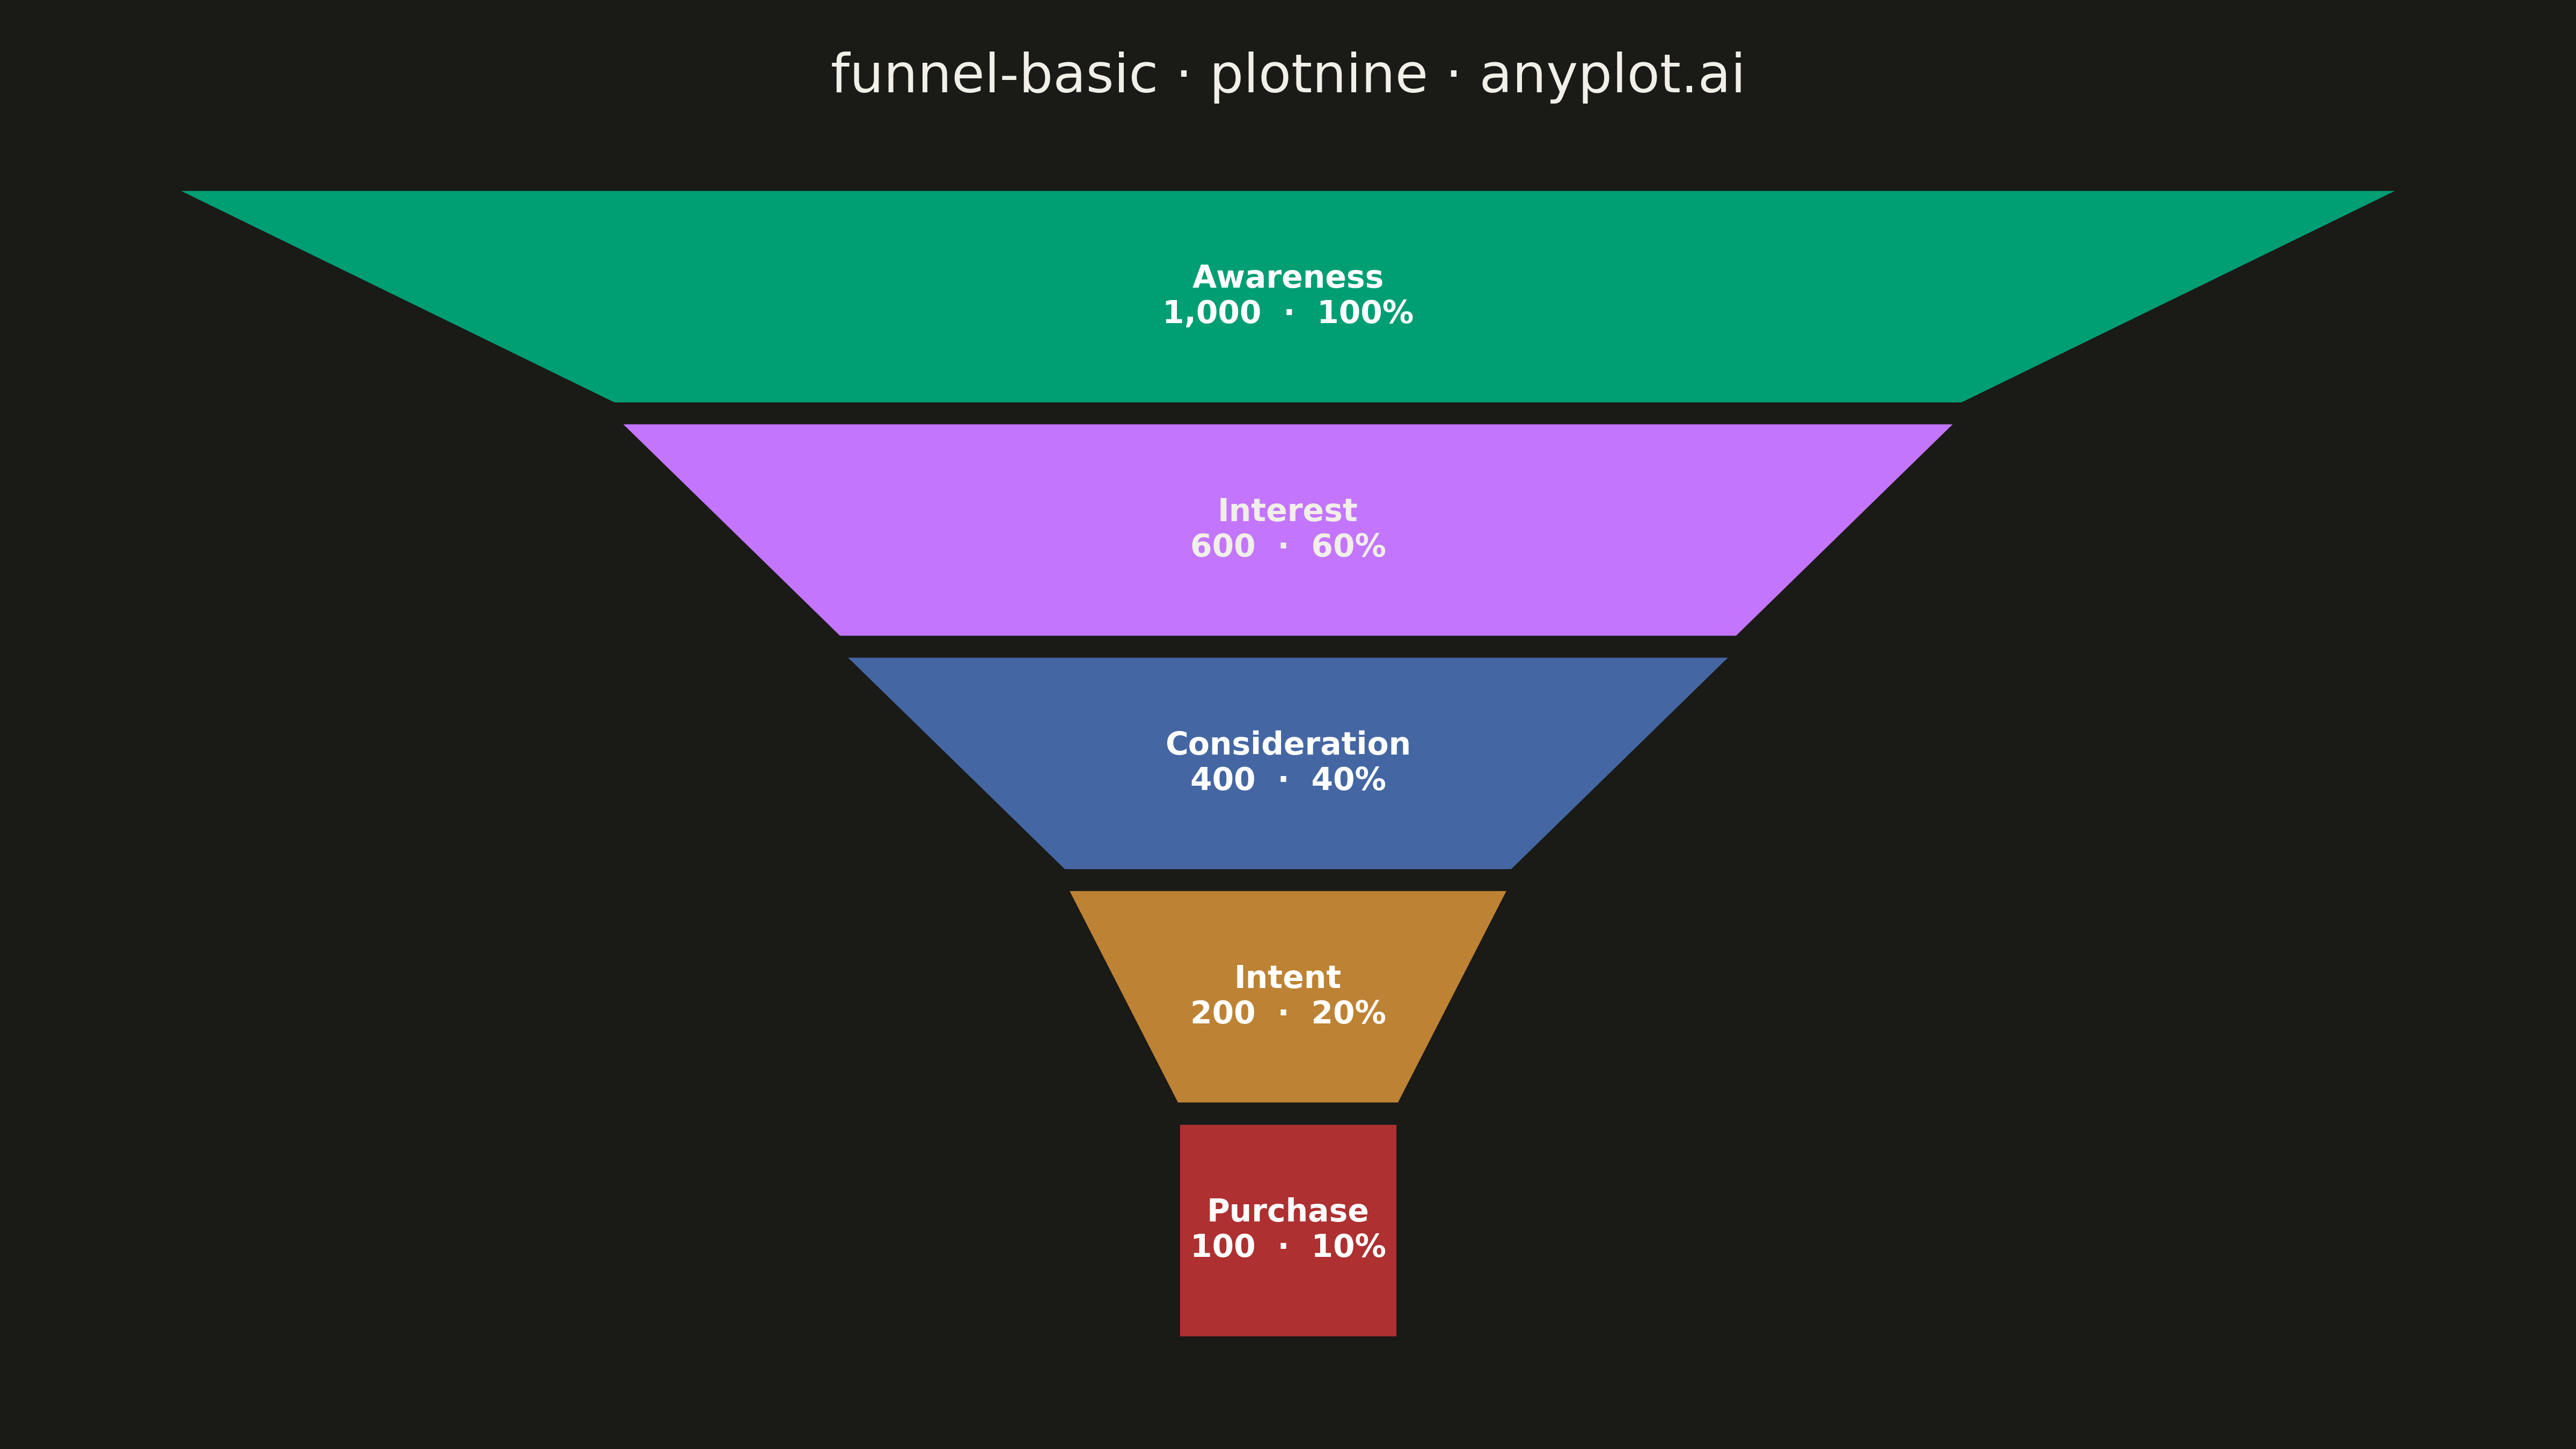
A funnel chart visualizes sequential stages of a process where values progressively decrease from one stage to the next. Each stage is represented as a trapezoidal segment that narrows from top to bottom, making it easy to identify drop-offs between stages. This chart is ideal for tracking conversion rates, sales pipelines, and multi-step processes where understanding stage-to-stage transitions is critical.
""" anyplot.ai
funnel-basic: Basic Funnel Chart
Library: plotnine 0.15.3 | Python 3.14.4
Quality: 87/100 | Updated: 2026-04-26
"""

# Script filename "plotnine.py" shadows the plotnine package on sys.path.
# Drop the script's own directory before importing.
import os
import sys


sys.path = [p for p in sys.path if not p.endswith("implementations/python")]

import pandas as pd
from plotnine import (
    aes,
    element_blank,
    element_rect,
    element_text,
    geom_polygon,
    geom_text,
    ggplot,
    labs,
    scale_color_identity,
    scale_fill_manual,
    scale_y_reverse,
    theme,
    theme_void,
)


# Theme tokens
THEME = os.getenv("ANYPLOT_THEME", "light")
PAGE_BG = "#FAF8F1" if THEME == "light" else "#1A1A17"
INK = "#1A1A17" if THEME == "light" else "#F0EFE8"

# imprint palette — first stage is brand green (#009E73)
IMPRINT = ["#009E73", "#C475FD", "#4467A3", "#BD8233", "#AE3030"]
# Slot 1 (lavender) is the lightest hue and needs dark text; the others are
# saturated/dark enough for white.
TEXT_ON_FILL = ["white", INK, "white", "white", "white"]

# Data — sales funnel example from specification
stages = ["Awareness", "Interest", "Consideration", "Intent", "Purchase"]
values = [1000, 600, 400, 200, 100]
n_stages = len(stages)
max_value = values[0]

# Build trapezoid polygon vertices for each stage
gap = 0.06
polygons = []
labels = []
for i, (stage, value) in enumerate(zip(stages, values, strict=True)):
    w_top = value / max_value
    # Flat bottom on the last segment — match its own width.
    w_bot = (values[i + 1] / max_value) if i + 1 < n_stages else w_top
    y_top = i + gap / 2
    y_bot = (i + 1) - gap / 2
    polygons.extend(
        [
            {"stage": stage, "x": -w_top / 2, "y": y_top, "order": 0},
            {"stage": stage, "x": w_top / 2, "y": y_top, "order": 1},
            {"stage": stage, "x": w_bot / 2, "y": y_bot, "order": 2},
            {"stage": stage, "x": -w_bot / 2, "y": y_bot, "order": 3},
        ]
    )
    pct = value / max_value * 100
    labels.append(
        {
            "stage": stage,
            "x": 0,
            "y": (y_top + y_bot) / 2,
            "label": f"{stage}\n{value:,}  ·  {pct:.0f}%",
            "text_color": TEXT_ON_FILL[i],
        }
    )

df_poly = pd.DataFrame(polygons)
df_poly["stage"] = pd.Categorical(df_poly["stage"], categories=stages, ordered=True)
df_labels = pd.DataFrame(labels)

# Plot
plot = (
    ggplot(df_poly, aes(x="x", y="y", fill="stage", group="stage"))
    + geom_polygon(color=PAGE_BG, size=2)
    + geom_text(
        aes(x="x", y="y", label="label", color="text_color"),
        data=df_labels,
        size=14,
        fontweight="bold",
        inherit_aes=False,
    )
    + scale_fill_manual(values=IMPRINT[:n_stages], guide=None)
    + scale_color_identity()
    + scale_y_reverse()
    + labs(title="funnel-basic · plotnine · anyplot.ai", x="", y="")
    + theme_void()
    + theme(
        figure_size=(16, 9),
        plot_background=element_rect(fill=PAGE_BG, color=PAGE_BG),
        panel_background=element_rect(fill=PAGE_BG, color=PAGE_BG),
        plot_title=element_text(size=24, color=INK, weight="medium", ha="center"),
        plot_margin=0.02,
        axis_text=element_blank(),
        axis_ticks=element_blank(),
        panel_grid=element_blank(),
        legend_position="none",
    )
)

# Save
plot.save(f"plot-{THEME}.png", dpi=300, verbose=False)
Runnable source as JSON, for any HTTP client: https://api.anyplot.ai/specs/funnel-basic/plotnine/code. Any spec id and library id listed in llms-full.txt fit the same URL shape; every URL below is complete and callable.
{
  "spec_id": "funnel-basic",
  "language": "python",
  "library": "plotnine",
  "page": "https://anyplot.ai/funnel-basic/python/plotnine",
  "hub": "https://anyplot.ai/funnel-basic",
  "code_json": "https://api.anyplot.ai/specs/funnel-basic/plotnine/code",
  "spec_json": "https://api.anyplot.ai/specs/funnel-basic",
  "render_light_png": "https://storage.googleapis.com/anyplot-images/plots/funnel-basic/python/plotnine/plot-light.png",
  "render_dark_png": "https://storage.googleapis.com/anyplot-images/plots/funnel-basic/python/plotnine/plot-dark.png",
  "quality_score": 87.0,
  "license": "MIT",
  "guide": "https://anyplot.ai/llms.txt"
}
Part of Basic Funnel Chart on anyplot.ai.