The same plot in 14 other libraries — JavaScript: D3.js, Apache ECharts, Highcharts, MUI X Charts; Python: Altair, Bokeh, lets-plot, Matplotlib, Plotly, plotnine, Pygal, Seaborn; R: ggplot2; Julia: Makie.jl. Compare all 15 side by side: Basic Funnel Chart in Python, R, Julia and JavaScript.
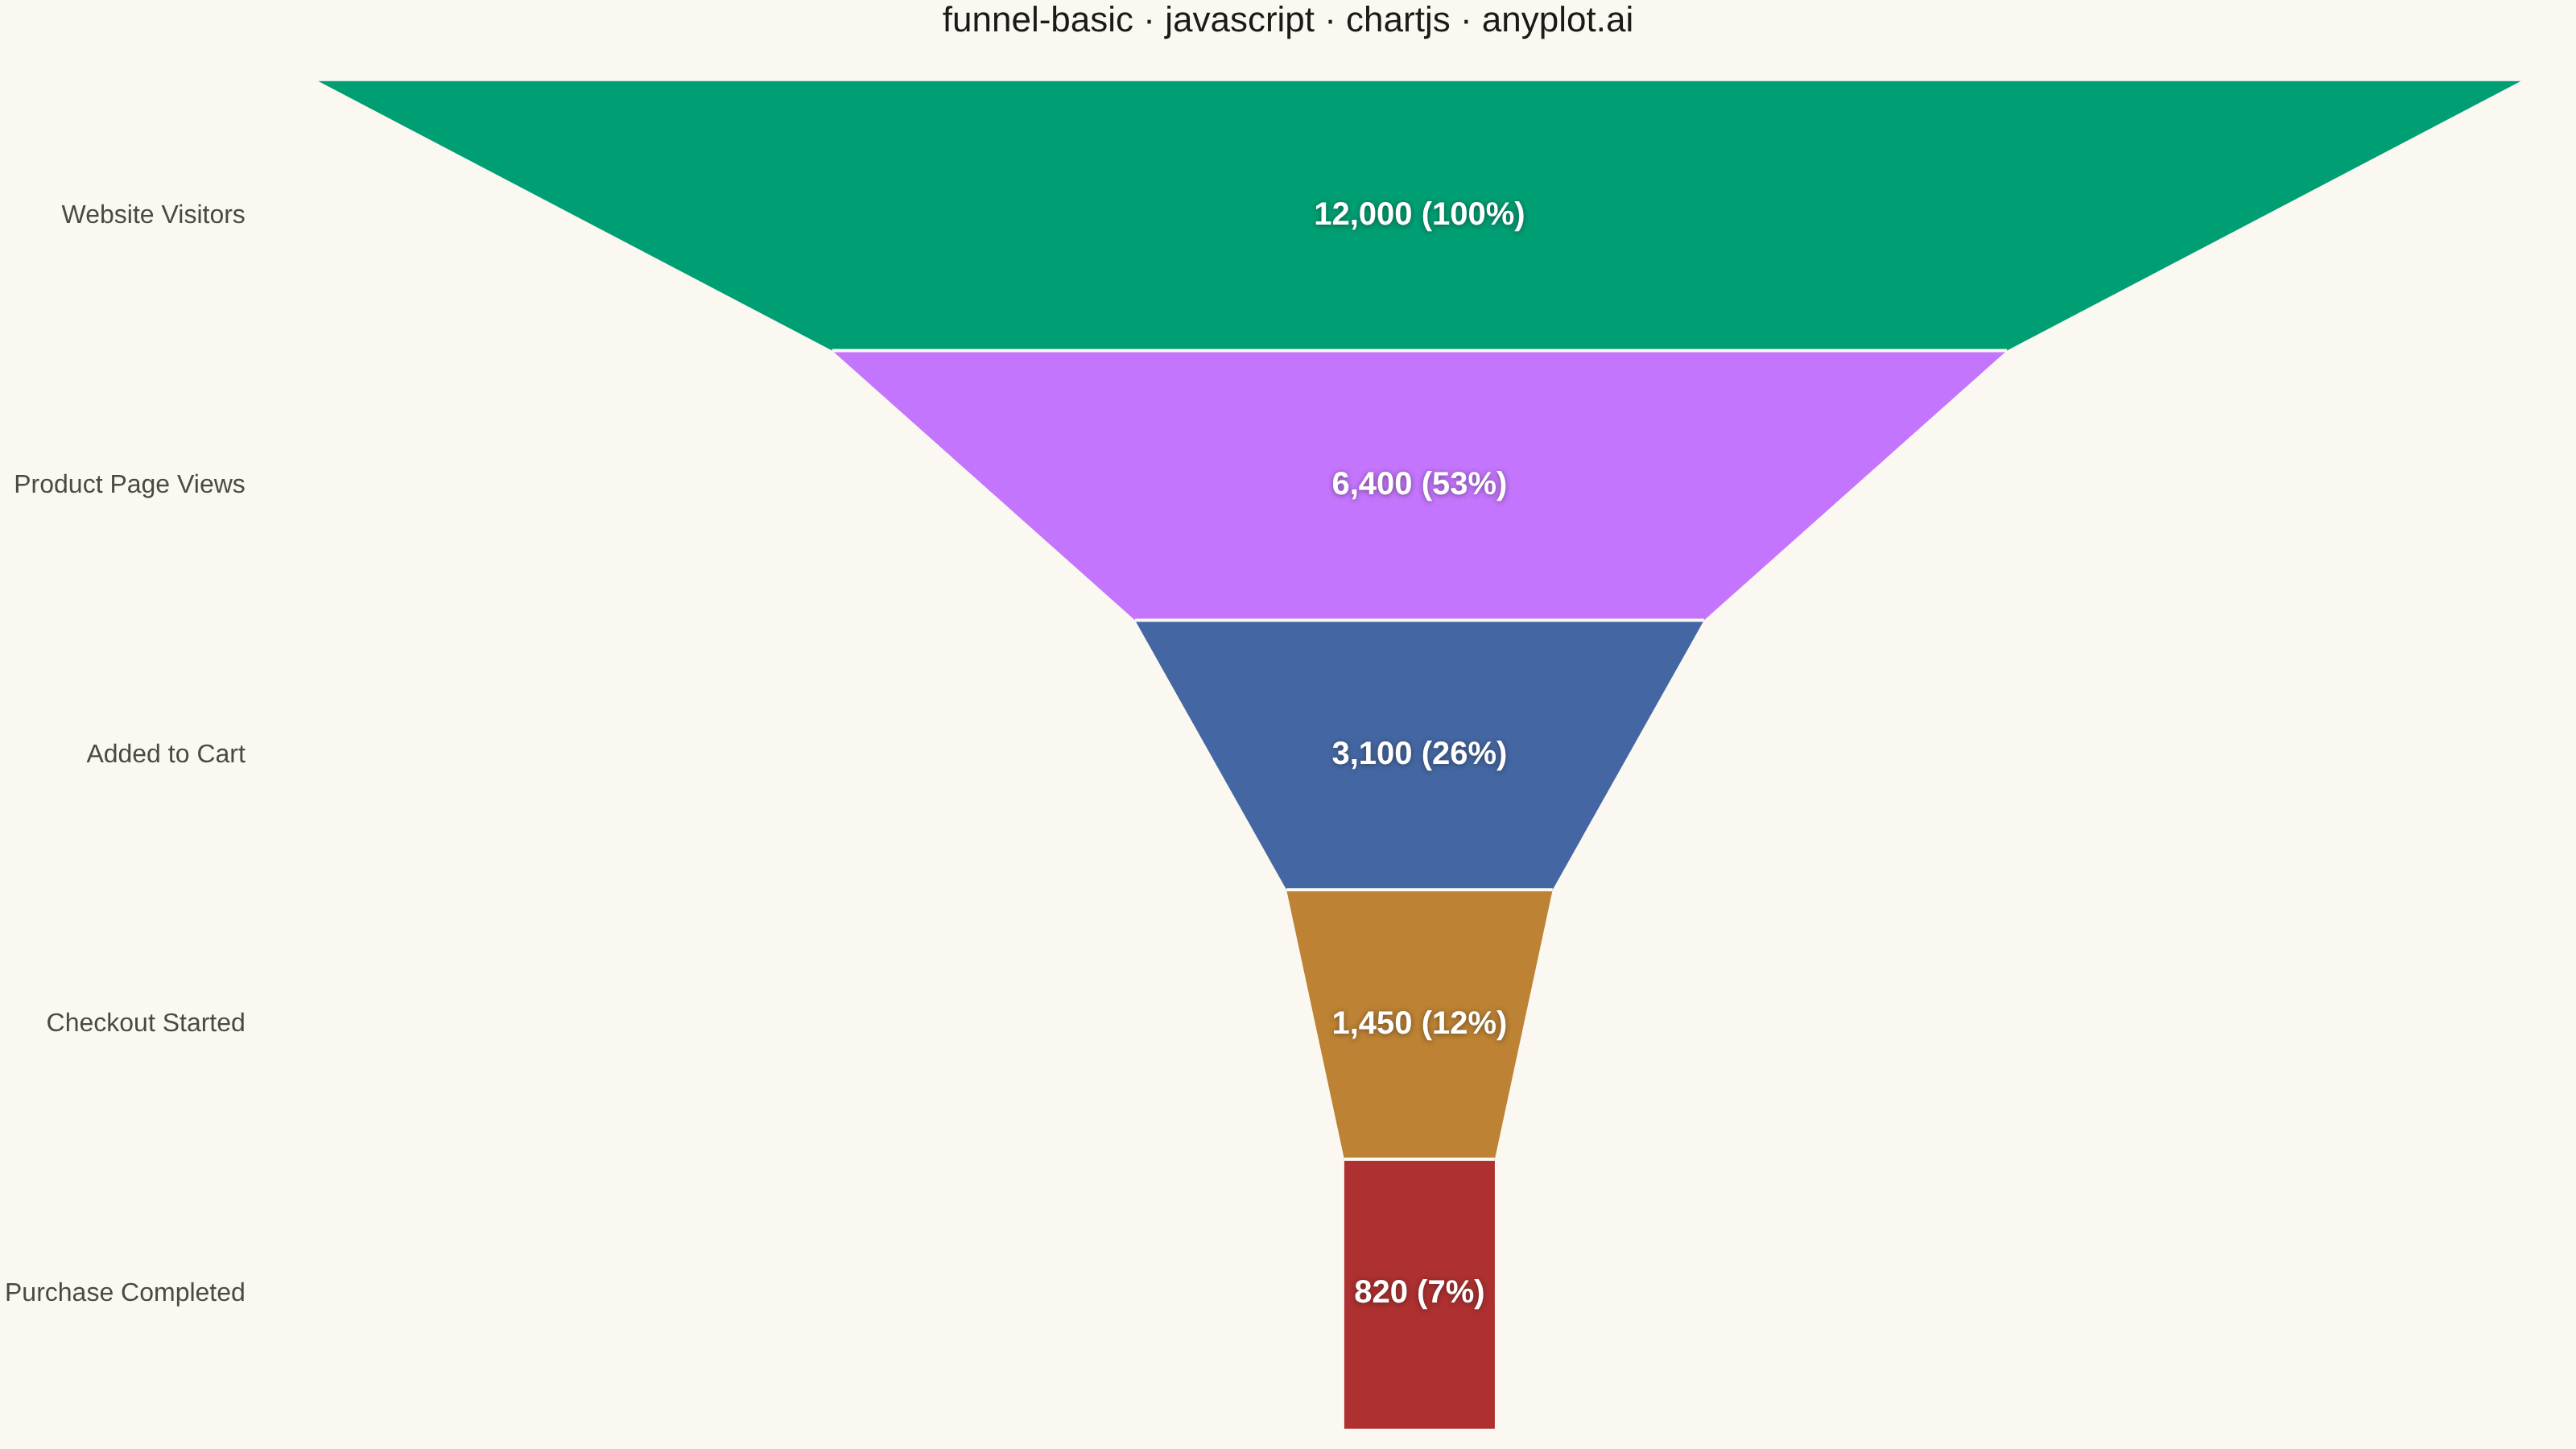
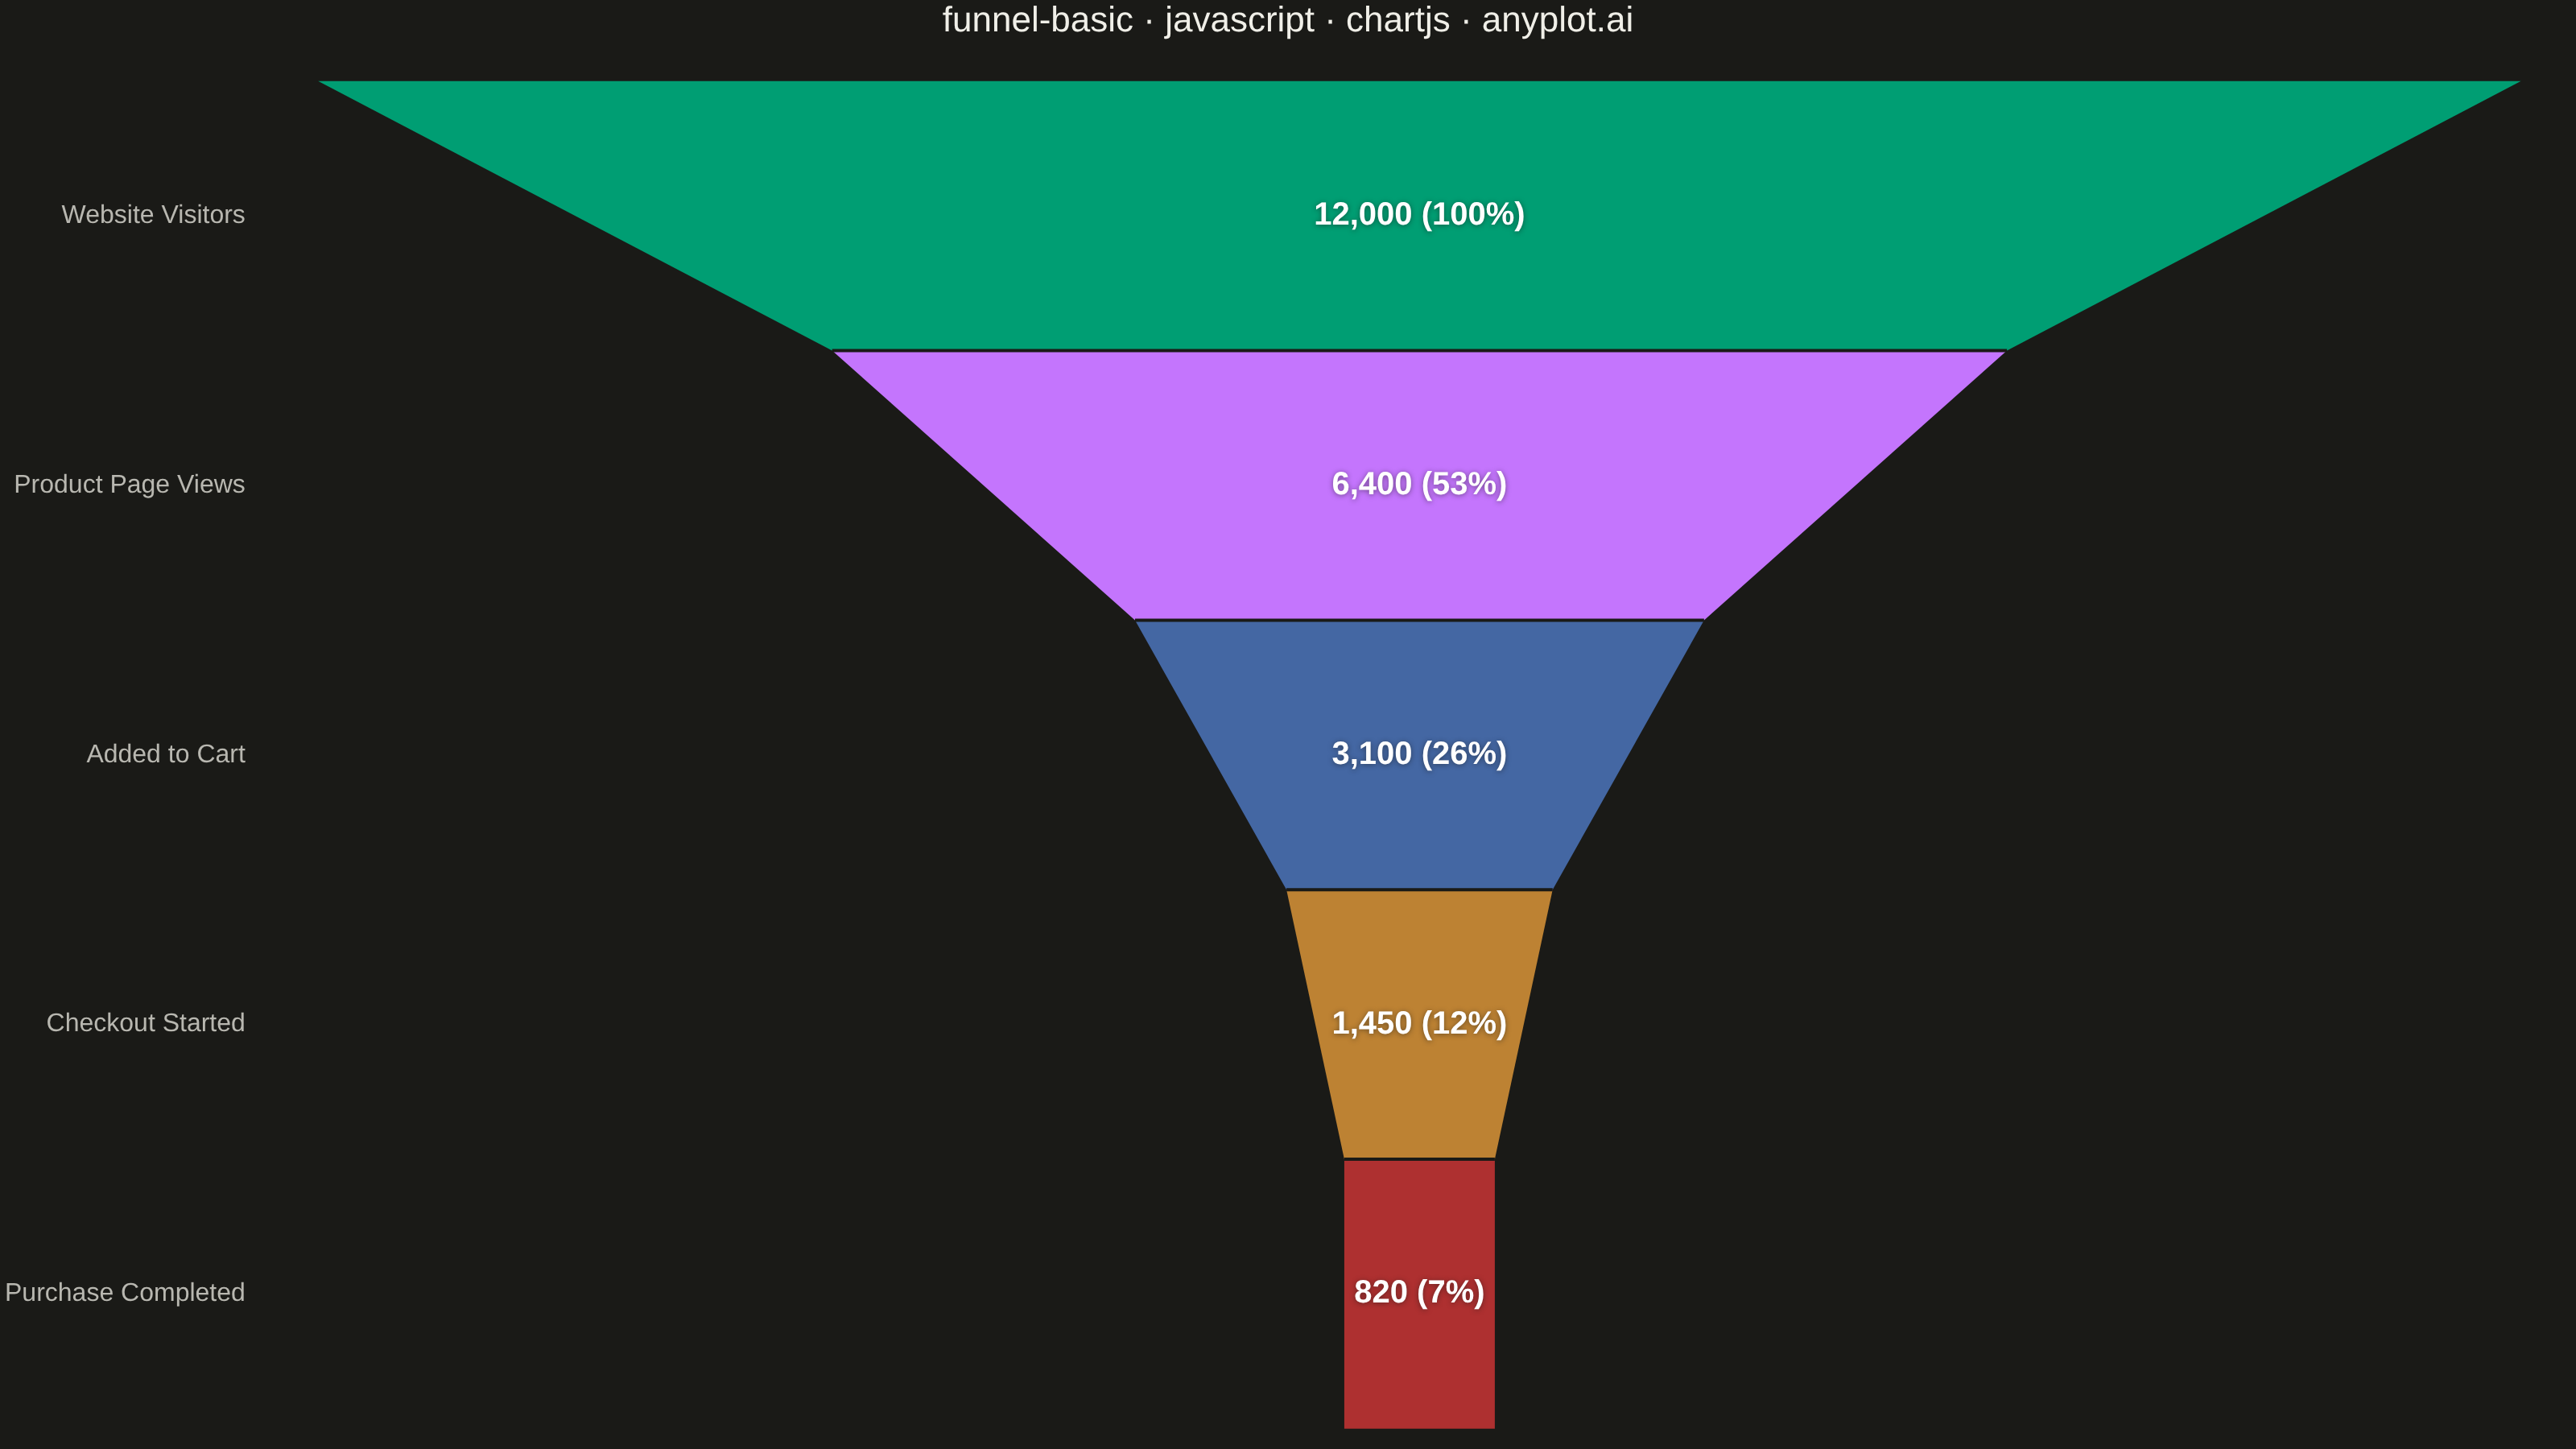
A funnel chart visualizes sequential stages of a process where values progressively decrease from one stage to the next. Each stage is represented as a trapezoidal segment that narrows from top to bottom, making it easy to identify drop-offs between stages. This chart is ideal for tracking conversion rates, sales pipelines, and multi-step processes where understanding stage-to-stage transitions is critical.
// anyplot.ai
// funnel-basic: Basic Funnel Chart
// Library: chartjs 4.4.7 | JavaScript 22.23.2
// Quality: 92/100 | Created: 2026-09-05

const t = window.ANYPLOT_TOKENS;

// --- Data (in-memory, deterministic) ----------------------------------------
// E-commerce checkout funnel: visitors thinning out at each subsequent step.
const stages = [
  "Website Visitors",
  "Product Page Views",
  "Added to Cart",
  "Checkout Started",
  "Purchase Completed",
];
const values = [12000, 6400, 3100, 1450, 820];

// Floating (centered) horizontal bars: each spans [-value/2, value/2], so
// stacking them by decreasing value produces the tapering funnel silhouette.
const segments = values.map((v) => [-v / 2, v / 2]);
const maxHalfWidth = values[0] / 2;
const colors = stages.map((_, i) => t.palette[i % t.palette.length]);

// --- Mount -------------------------------------------------------------------
const canvas = document.createElement("canvas");
document.getElementById("container").appendChild(canvas);

// --- Funnel shape + label plugin (native Chart.js plugin API) ---------------
// The underlying "bar" dataset only supplies layout (category bands, x scale
// pixel mapping) and is drawn fully transparent. This plugin paints the real
// funnel silhouette: each stage is a trapezoid whose top width is its own
// value and whose bottom width is the *next* stage's value, so consecutive
// segments share an identical edge and the whole shape tapers continuously
// instead of stacking as separated rectangles.
const funnelShape = {
  id: "funnelShape",
  afterDatasetsDraw(chart) {
    const { ctx, scales } = chart;
    const meta = chart.getDatasetMeta(0);
    const centerX = scales.x.getPixelForValue(0);
    const halfWidthPx = values.map(
      (v) => scales.x.getPixelForValue(v / 2) - centerX,
    );

    ctx.save();
    meta.data.forEach((bar, i) => {
      const { y, height } = bar.getProps(["y", "height"], true);
      const top = y - height / 2;
      const bottom = y + height / 2;
      const topHalf = halfWidthPx[i];
      const bottomHalf =
        i < values.length - 1 ? halfWidthPx[i + 1] : halfWidthPx[i];

      ctx.beginPath();
      ctx.moveTo(centerX - topHalf, top);
      ctx.lineTo(centerX + topHalf, top);
      ctx.lineTo(centerX + bottomHalf, bottom);
      ctx.lineTo(centerX - bottomHalf, bottom);
      ctx.closePath();
      ctx.fillStyle = colors[i];
      ctx.fill();

      if (i > 0) {
        ctx.strokeStyle = t.pageBg;
        ctx.lineWidth = 2;
        ctx.beginPath();
        ctx.moveTo(centerX - topHalf, top);
        ctx.lineTo(centerX + topHalf, top);
        ctx.stroke();
      }
    });

    ctx.textAlign = "center";
    ctx.textBaseline = "middle";
    ctx.font = "700 20px sans-serif";
    ctx.fillStyle = "#FFFFFF";
    ctx.shadowColor = "rgba(26, 26, 23, 0.5)";
    ctx.shadowBlur = 6;
    ctx.shadowOffsetY = 1;
    meta.data.forEach((bar, i) => {
      const { x, y } = bar.getCenterPoint();
      const share = Math.round((values[i] / values[0]) * 100);
      const label = `${values[i].toLocaleString()} (${share}%)`;
      ctx.fillText(label, x, y);
    });
    ctx.restore();
  },
};

// --- Chart -------------------------------------------------------------------
new Chart(canvas, {
  type: "bar",
  data: {
    labels: stages,
    datasets: [
      {
        data: segments,
        backgroundColor: "transparent",
        borderWidth: 0,
      },
    ],
  },
  options: {
    indexAxis: "y",
    responsive: true,
    maintainAspectRatio: false,
    animation: false,
    barPercentage: 1,
    categoryPercentage: 1,
    plugins: {
      title: {
        display: true,
        text: "funnel-basic · javascript · chartjs · anyplot.ai",
        color: t.ink,
        font: { size: 22, weight: "500" },
        padding: { bottom: 24 },
      },
      legend: { display: false },
    },
    scales: {
      x: {
        display: false,
        min: -maxHalfWidth * 1.05,
        max: maxHalfWidth * 1.05,
        grid: { display: false },
        border: { display: false },
      },
      y: {
        ticks: { color: t.inkSoft, font: { size: 16 } },
        grid: { display: false },
        border: { display: false },
      },
    },
  },
  plugins: [funnelShape],
});
Runnable source as JSON, for any HTTP client: https://api.anyplot.ai/specs/funnel-basic/chartjs/code. Any spec id and library id listed in llms-full.txt fit the same URL shape; every URL below is complete and callable.
{
  "spec_id": "funnel-basic",
  "language": "javascript",
  "library": "chartjs",
  "page": "https://anyplot.ai/funnel-basic/javascript/chartjs",
  "hub": "https://anyplot.ai/funnel-basic",
  "code_json": "https://api.anyplot.ai/specs/funnel-basic/chartjs/code",
  "spec_json": "https://api.anyplot.ai/specs/funnel-basic",
  "render_light_png": "https://storage.googleapis.com/anyplot-images/plots/funnel-basic/javascript/chartjs/plot-light.png",
  "render_dark_png": "https://storage.googleapis.com/anyplot-images/plots/funnel-basic/javascript/chartjs/plot-dark.png",
  "interactive_light_html": "https://storage.googleapis.com/anyplot-images/plots/funnel-basic/javascript/chartjs/plot-light.html",
  "interactive_dark_html": "https://storage.googleapis.com/anyplot-images/plots/funnel-basic/javascript/chartjs/plot-dark.html",
  "quality_score": 92.0,
  "license": "MIT",
  "guide": "https://anyplot.ai/llms.txt"
}
Part of Basic Funnel Chart on anyplot.ai.