The same plot in 14 other libraries — JavaScript: Chart.js, D3.js, Highcharts, MUI X Charts; Python: Altair, Bokeh, lets-plot, Matplotlib, Plotly, plotnine, Pygal, Seaborn; R: ggplot2; Julia: Makie.jl. Compare all 15 side by side: Basic Funnel Chart in Python, R, Julia and JavaScript.
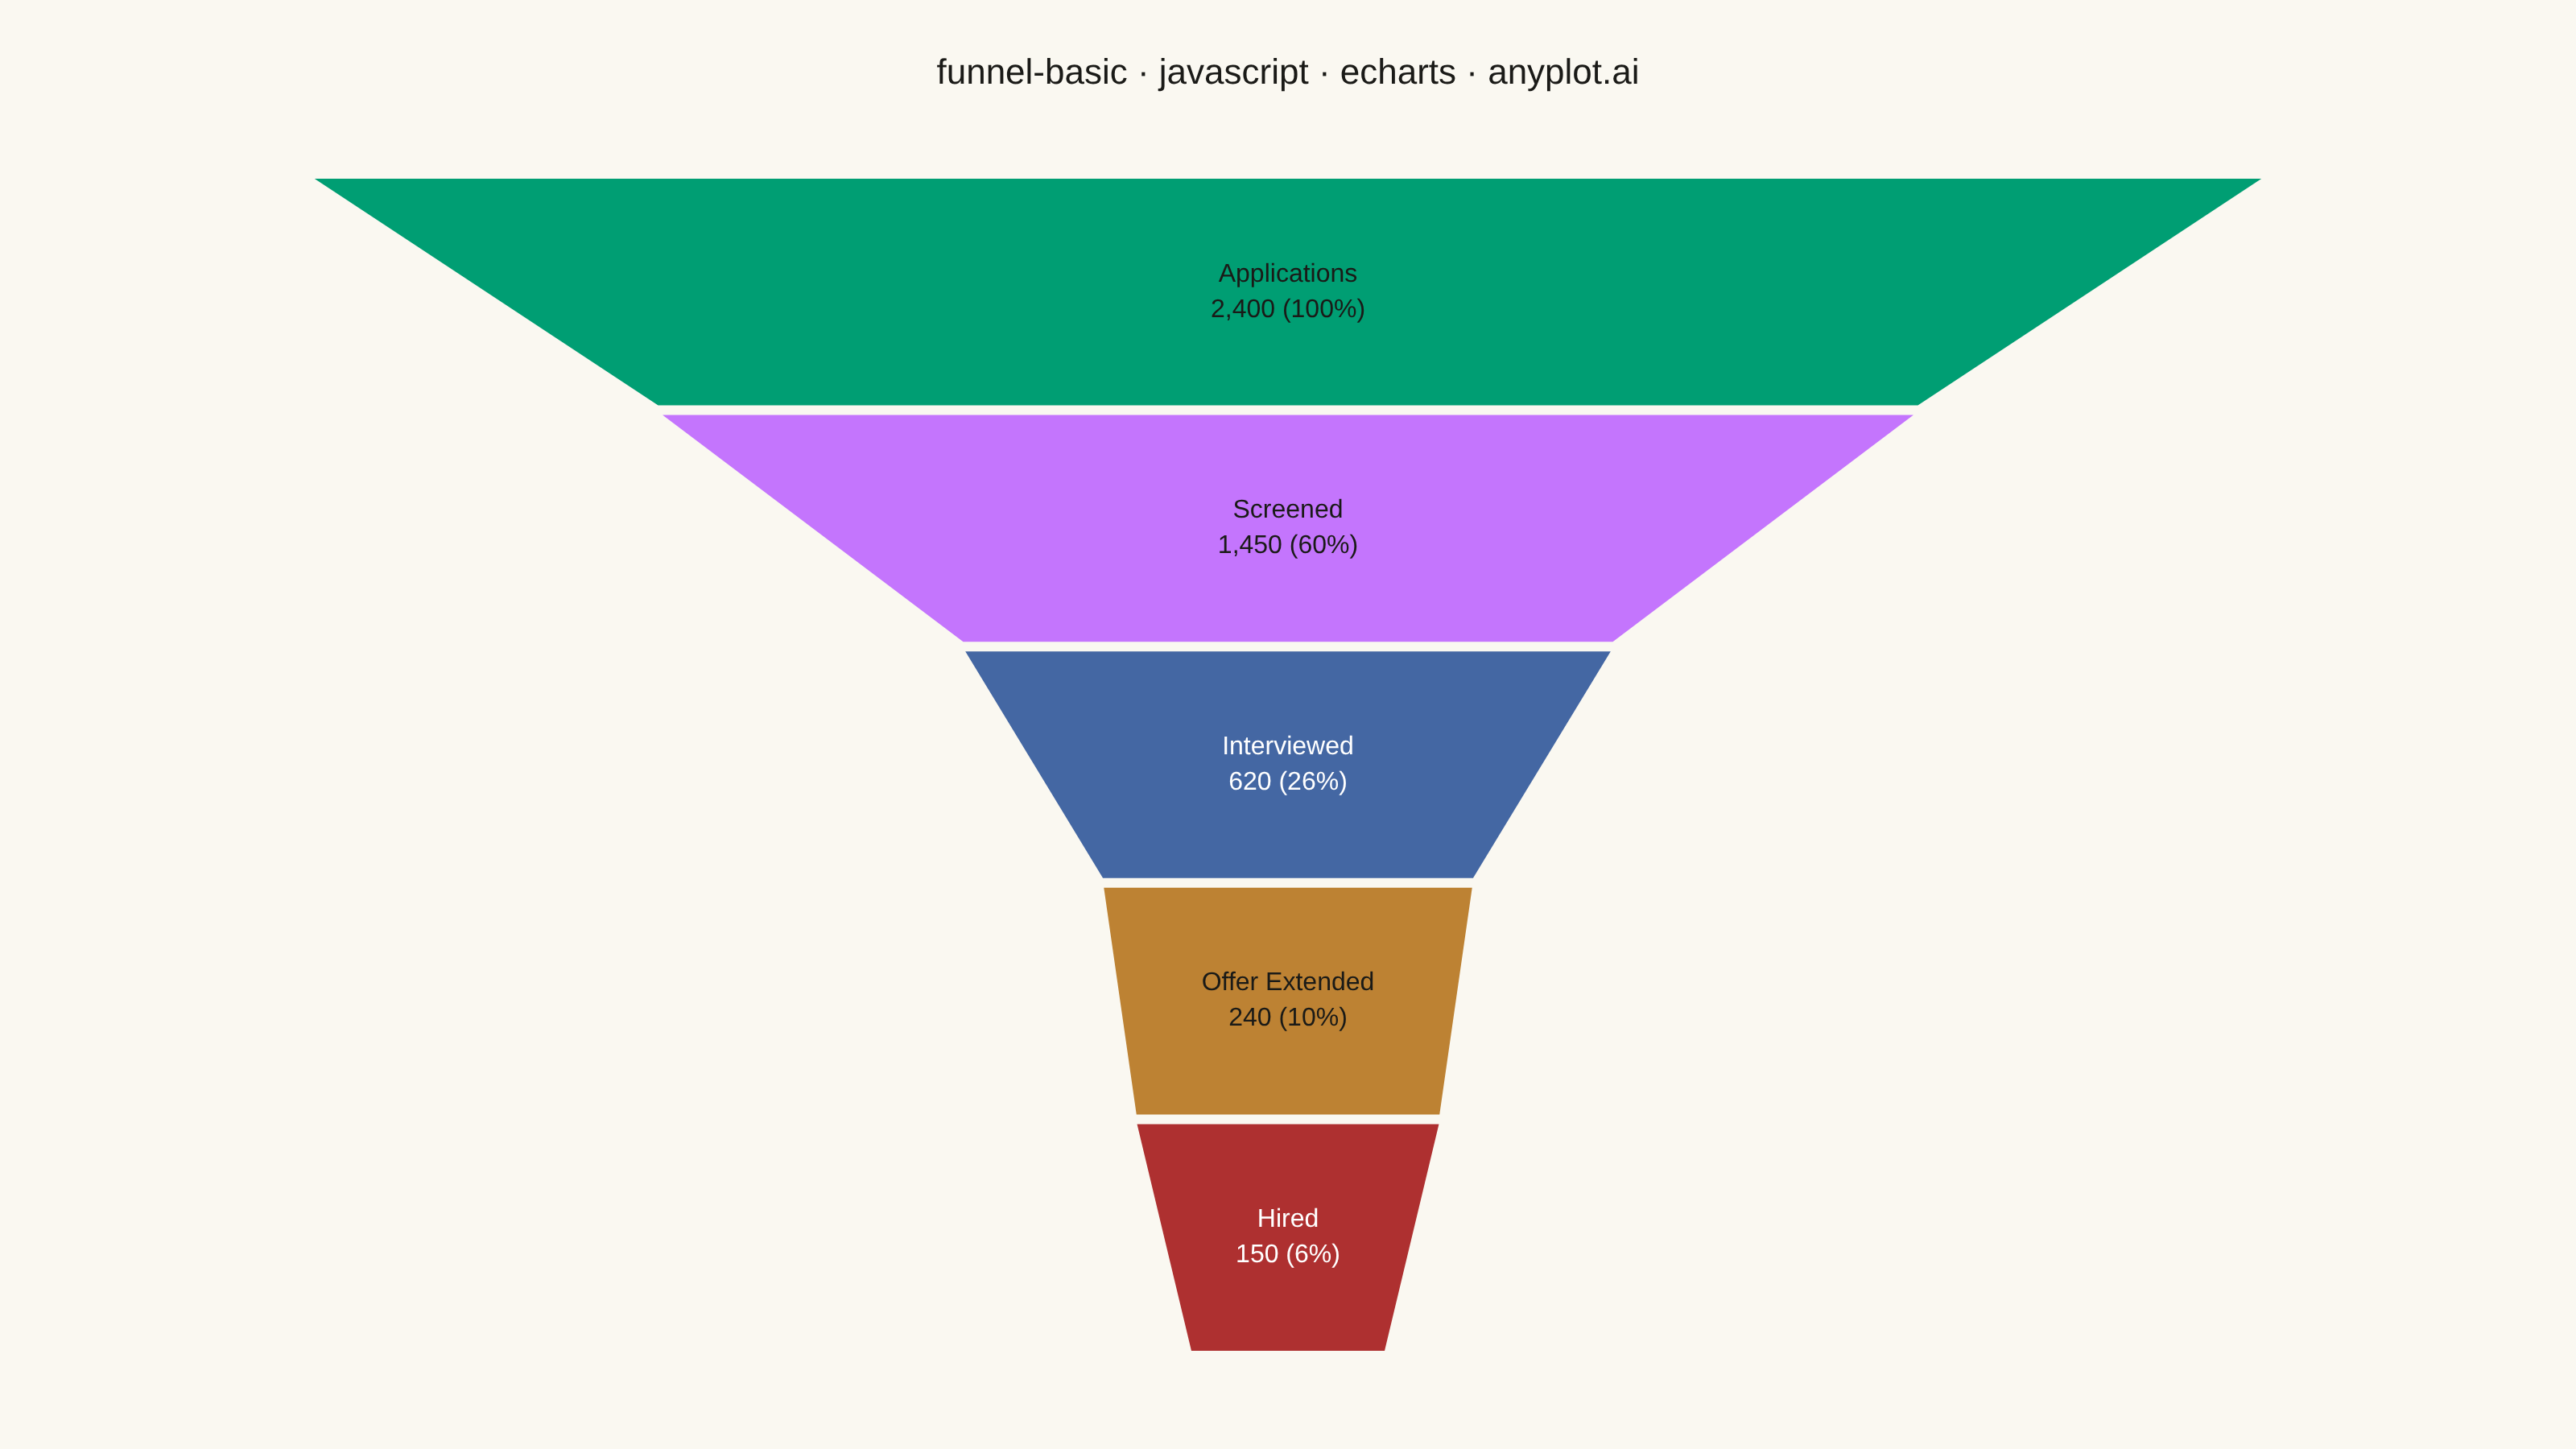
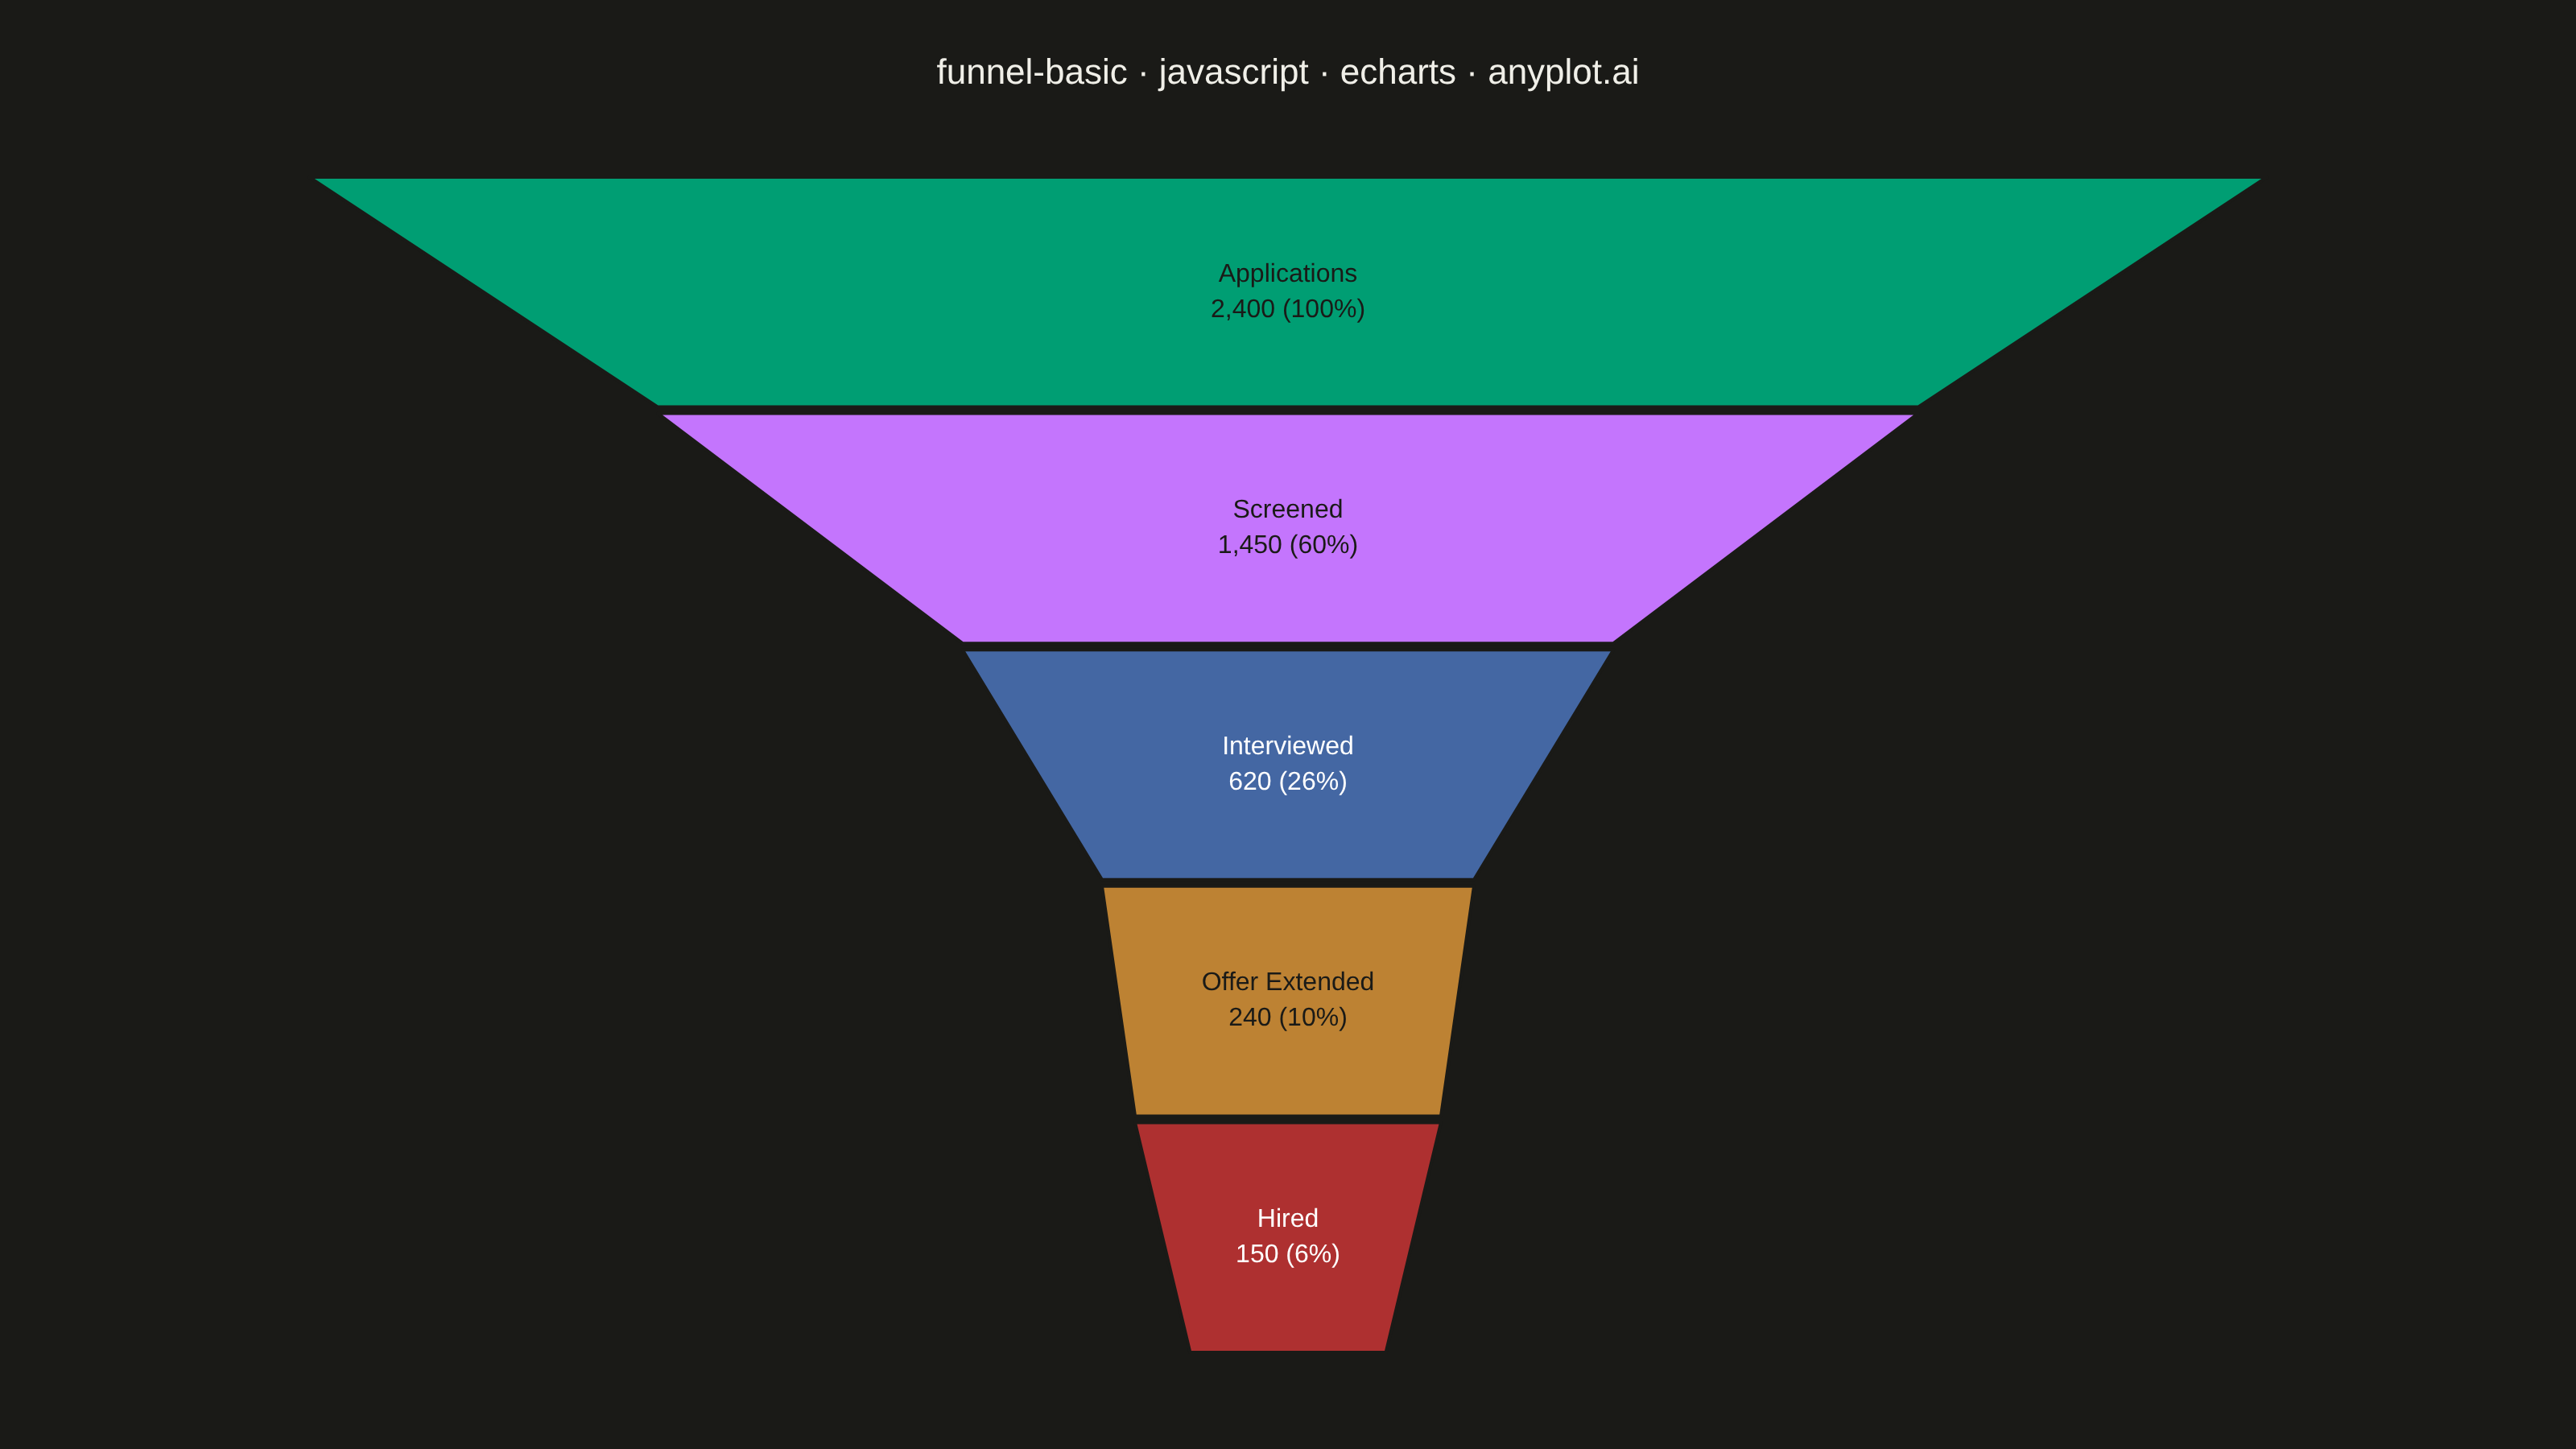
A funnel chart visualizes sequential stages of a process where values progressively decrease from one stage to the next. Each stage is represented as a trapezoidal segment that narrows from top to bottom, making it easy to identify drop-offs between stages. This chart is ideal for tracking conversion rates, sales pipelines, and multi-step processes where understanding stage-to-stage transitions is critical.
// anyplot.ai
// funnel-basic: Basic Funnel Chart
// Library: echarts 6.1.0 | JavaScript 22.23.2
// Quality: 91/100 | Created: 2026-09-05

const t = window.ANYPLOT_TOKENS;

// --- Data (in-memory, deterministic) ---------------------------------------
const stages = ["Applications", "Screened", "Interviewed", "Offer Extended", "Hired"];
const counts = [2400, 1450, 620, 240, 150];

// Imprint data colors are theme-invariant, so each segment's label needs a
// fixed color chosen for that segment's own luminance rather than a
// theme-linked token -- t.pageBg flips near-white/near-black with the theme
// while the segment fill stays the same, producing dark-on-dark on the two
// darkest hues (blue, matte red) once the theme flips.
const labelColors = ["#1A1A17", "#1A1A17", "#FFFFFF", "#1A1A17", "#FFFFFF"];

const funnelData = stages.map((stage, i) => ({
  name: stage,
  value: counts[i],
  label: { color: labelColors[i] },
}));

// --- Init -------------------------------------------------------------------
const chart = echarts.init(document.getElementById("container"));

// --- Option -----------------------------------------------------------------
chart.setOption({
  animation: false,
  color: t.palette,
  backgroundColor: "transparent",
  title: {
    text: "funnel-basic · javascript · echarts · anyplot.ai",
    left: "center",
    top: 30,
    textStyle: { color: t.ink, fontSize: 22, fontWeight: 500 },
  },
  tooltip: {
    show: true,
    trigger: "item",
    backgroundColor: t.elevatedBg,
    borderColor: t.grid,
    textStyle: { color: t.ink },
    formatter: (params) =>
      `${params.name}<br/>${params.value.toLocaleString()} (${Math.round((params.value / counts[0]) * 100)}% of ${stages[0]})`,
  },
  legend: {
    show: false,
  },
  series: [
    {
      type: "funnel",
      left: "12%",
      right: "12%",
      top: 110,
      bottom: 60,
      width: "76%",
      min: 0,
      max: counts[0],
      minSize: "10%",
      maxSize: "100%",
      sort: "descending",
      gap: 4,
      label: {
        show: true,
        position: "inside",
        formatter: (params) =>
          `${params.name}\n${params.value.toLocaleString()} (${Math.round((params.value / counts[0]) * 100)}%)`,
        fontSize: 16,
        fontWeight: 500,
        lineHeight: 22,
      },
      labelLine: { show: false },
      itemStyle: {
        borderColor: t.pageBg,
        borderWidth: 2,
      },
      emphasis: { disabled: true },
      data: funnelData,
    },
  ],
});
Runnable source as JSON, for any HTTP client: https://api.anyplot.ai/specs/funnel-basic/echarts/code. Any spec id and library id listed in llms-full.txt fit the same URL shape; every URL below is complete and callable.
{
  "spec_id": "funnel-basic",
  "language": "javascript",
  "library": "echarts",
  "page": "https://anyplot.ai/funnel-basic/javascript/echarts",
  "hub": "https://anyplot.ai/funnel-basic",
  "code_json": "https://api.anyplot.ai/specs/funnel-basic/echarts/code",
  "spec_json": "https://api.anyplot.ai/specs/funnel-basic",
  "render_light_png": "https://storage.googleapis.com/anyplot-images/plots/funnel-basic/javascript/echarts/plot-light.png",
  "render_dark_png": "https://storage.googleapis.com/anyplot-images/plots/funnel-basic/javascript/echarts/plot-dark.png",
  "interactive_light_html": "https://storage.googleapis.com/anyplot-images/plots/funnel-basic/javascript/echarts/plot-light.html",
  "interactive_dark_html": "https://storage.googleapis.com/anyplot-images/plots/funnel-basic/javascript/echarts/plot-dark.html",
  "quality_score": 91.0,
  "license": "MIT",
  "guide": "https://anyplot.ai/llms.txt"
}
Part of Basic Funnel Chart on anyplot.ai.