The same plot in 14 other libraries — JavaScript: Chart.js, Apache ECharts, Highcharts, MUI X Charts; Python: Altair, Bokeh, lets-plot, Matplotlib, Plotly, plotnine, Pygal, Seaborn; R: ggplot2; Julia: Makie.jl. Compare all 15 side by side: Basic Funnel Chart in Python, R, Julia and JavaScript.
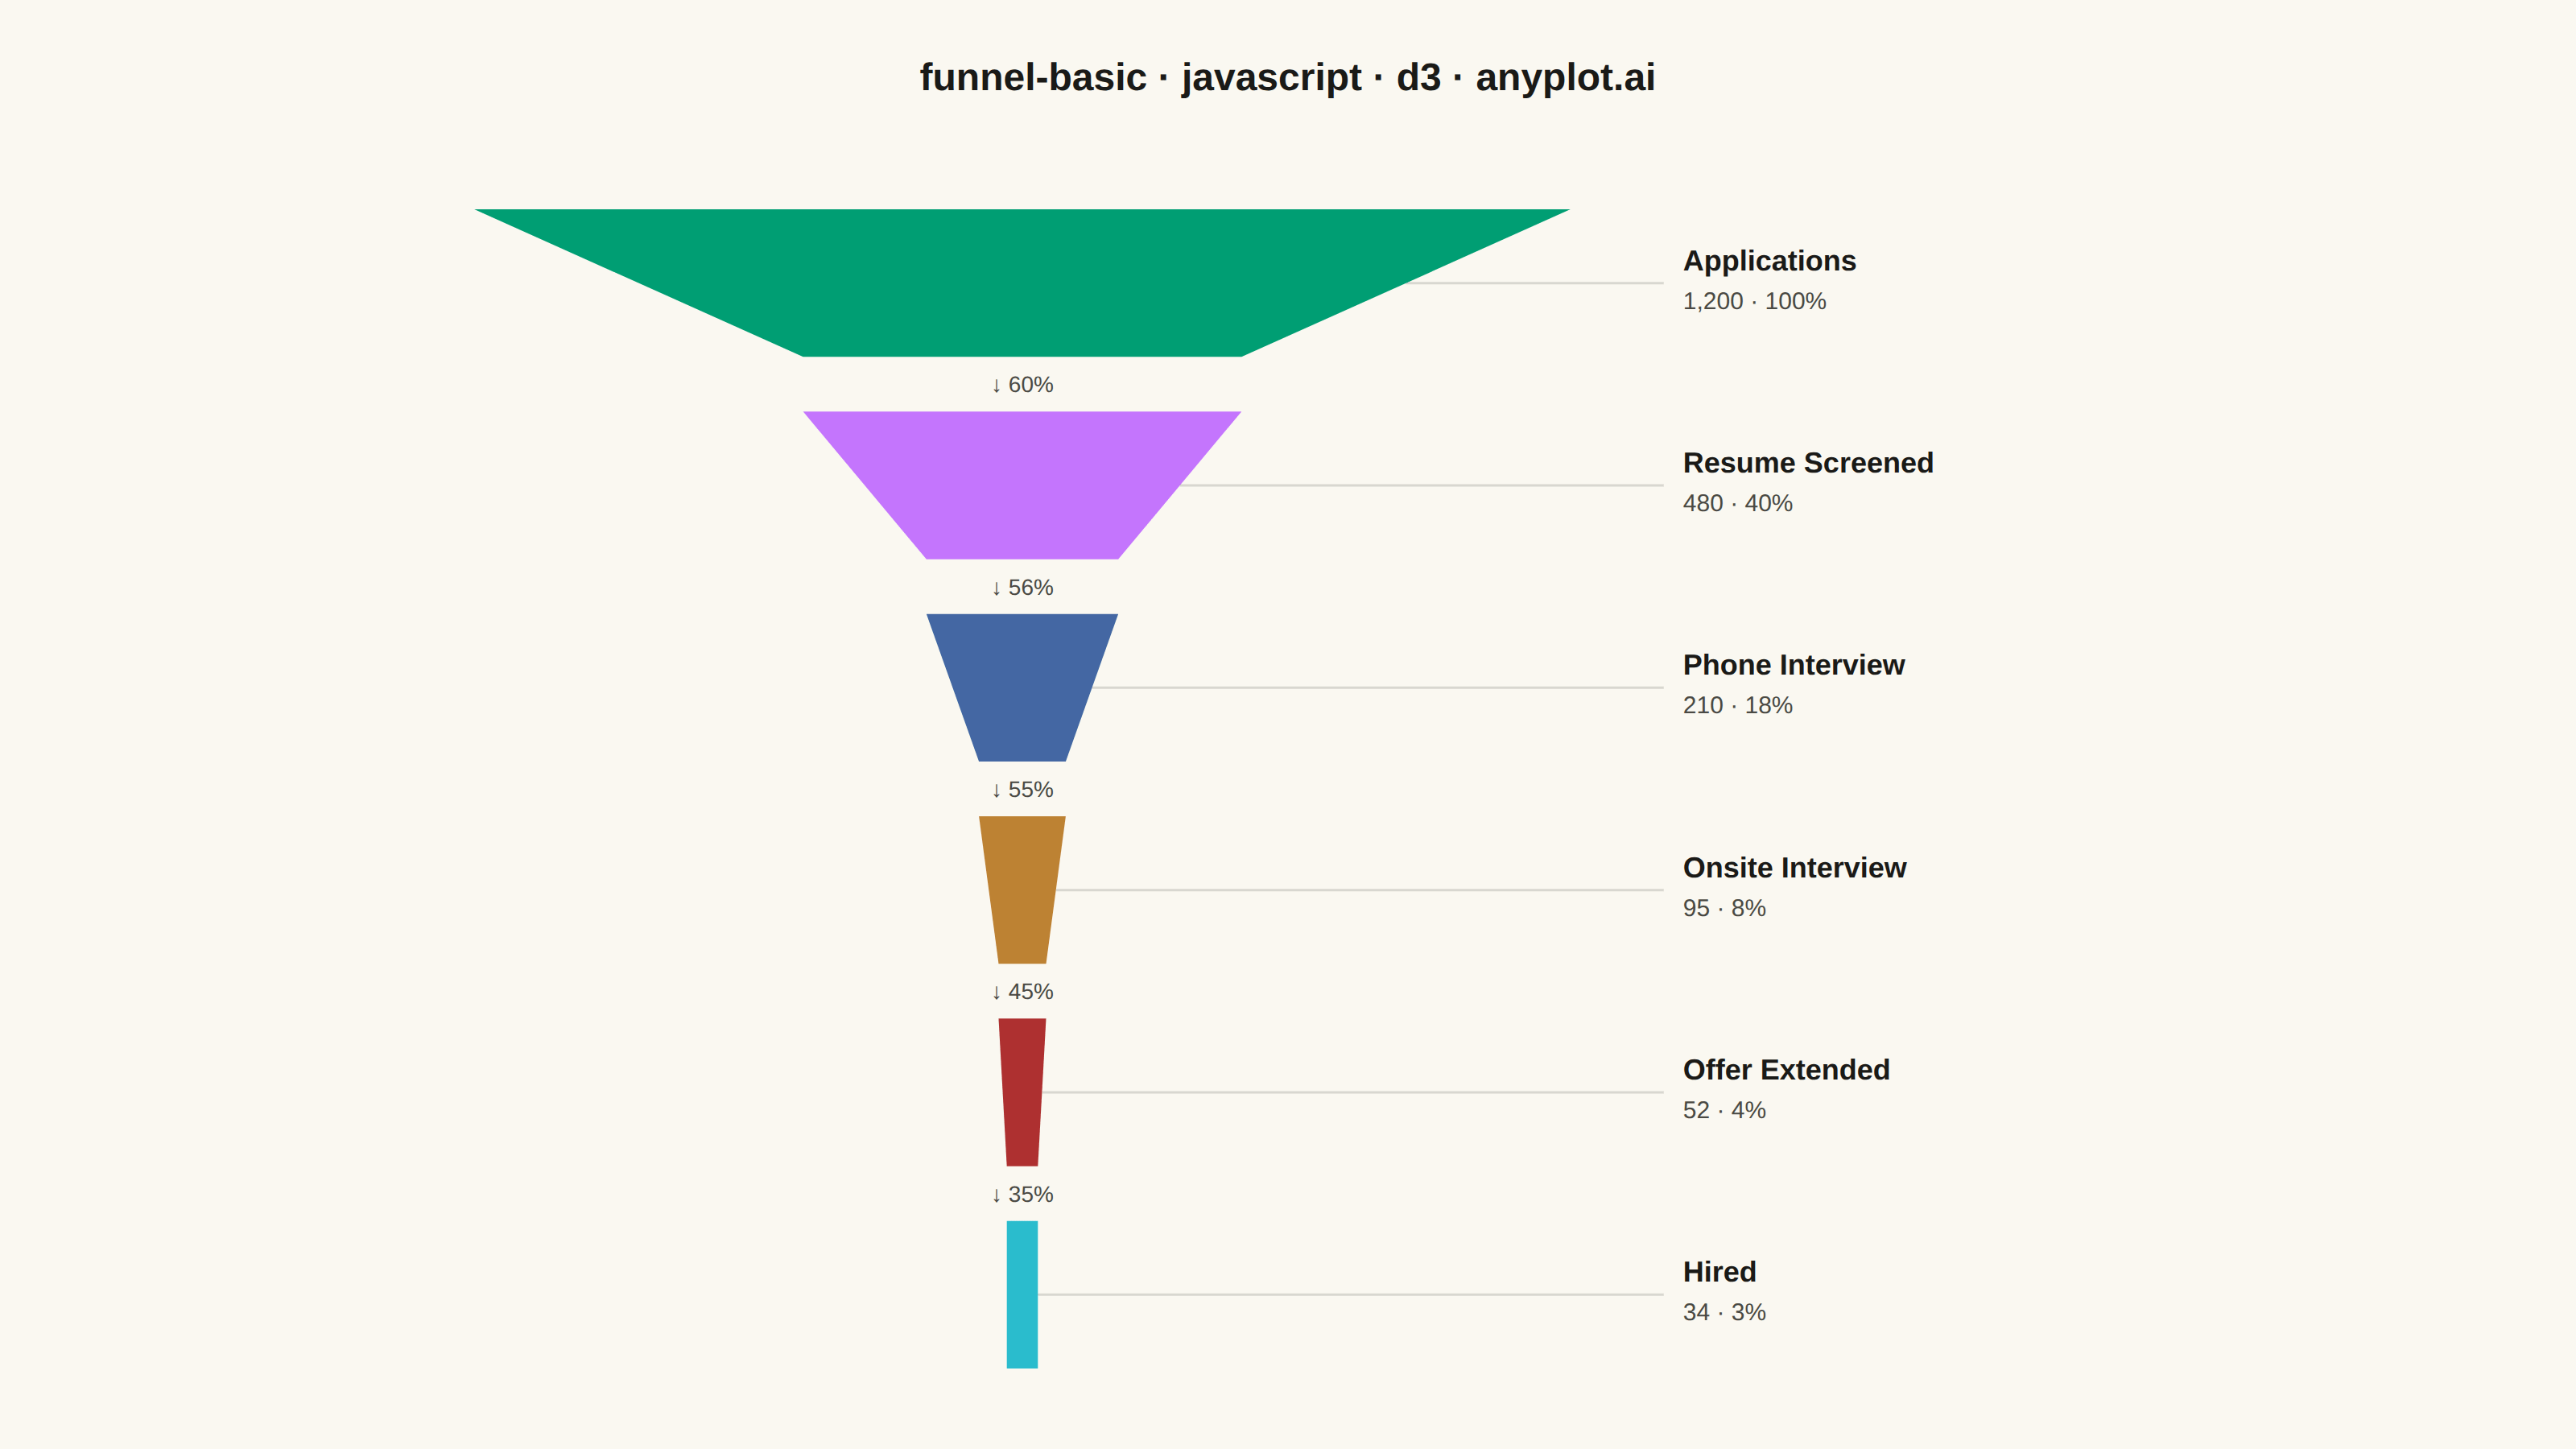
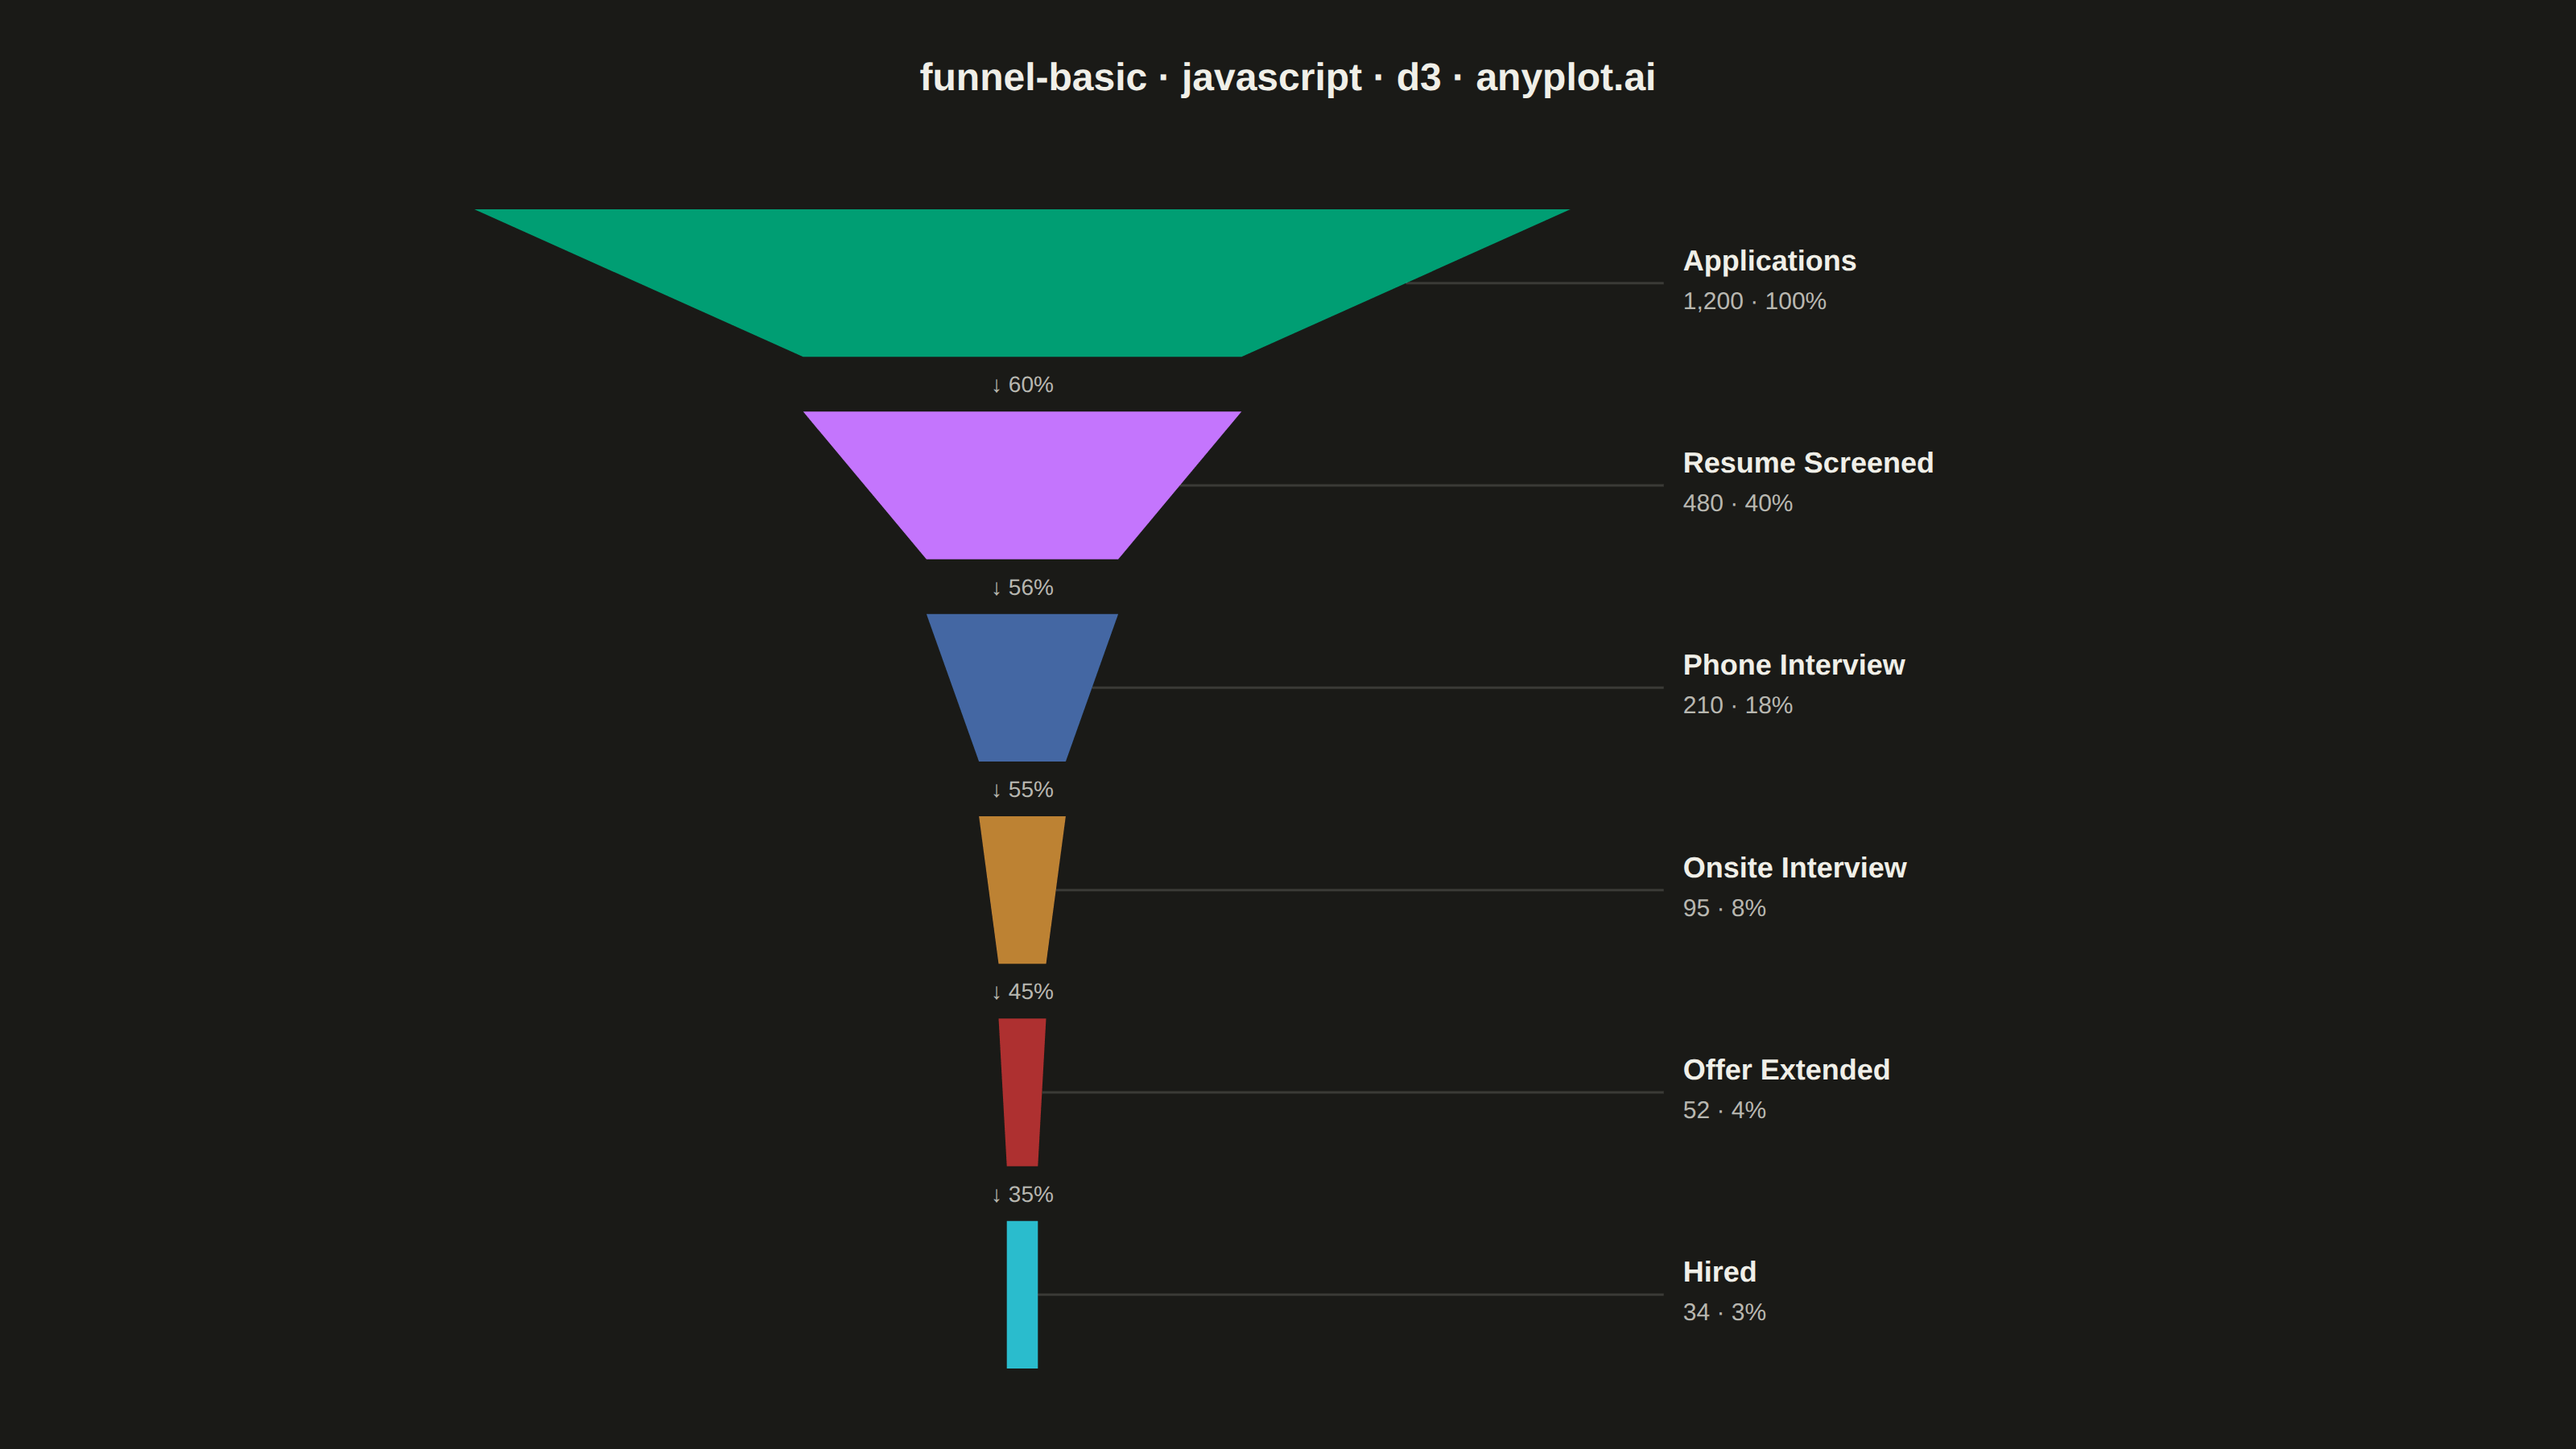
A funnel chart visualizes sequential stages of a process where values progressively decrease from one stage to the next. Each stage is represented as a trapezoidal segment that narrows from top to bottom, making it easy to identify drop-offs between stages. This chart is ideal for tracking conversion rates, sales pipelines, and multi-step processes where understanding stage-to-stage transitions is critical.
// anyplot.ai
// funnel-basic: Basic Funnel Chart
// Library: d3 7.9.0 | JavaScript 22.23.2
// Quality: 90/100 | Created: 2026-09-05

const t = window.ANYPLOT_TOKENS;
const { width, height } = window.ANYPLOT_SIZE;

// Data — software engineering hiring pipeline, applications through hire
const stages = [
  { name: "Applications", value: 1200 },
  { name: "Resume Screened", value: 480 },
  { name: "Phone Interview", value: 210 },
  { name: "Onsite Interview", value: 95 },
  { name: "Offer Extended", value: 52 },
  { name: "Hired", value: 34 },
];

// Layout — funnel on the left, stage labels on the right, centered as one block
const margin = { top: 130, right: 60, bottom: 50, left: 60 };
const iw = width - margin.left - margin.right;
const ih = height - margin.top - margin.bottom;

const bandGap = 34;
const bandHeight = (ih - bandGap * (stages.length - 1)) / stages.length;

const funnelMaxWidth = iw * 0.46;
const gapToLabel = 70;
const labelBlockWidth = 260;
const contentWidth = funnelMaxWidth + gapToLabel + labelBlockWidth;
const startX = margin.left + (iw - contentWidth) / 2;
const cx = startX + funnelMaxWidth / 2;
const labelX = startX + funnelMaxWidth + gapToLabel;

const widthScale = d3.scaleLinear().domain([0, stages[0].value]).range([0, funnelMaxWidth]);

const bands = stages.map((d, i) => {
  const topW = widthScale(d.value);
  const bottomW = i < stages.length - 1 ? widthScale(stages[i + 1].value) : widthScale(d.value);
  const y0 = margin.top + i * (bandHeight + bandGap);
  const y1 = y0 + bandHeight;
  return {
    ...d,
    topW,
    bottomW,
    y0,
    y1,
    color: t.palette[i % t.palette.length],
    pctOfFirst: Math.round((d.value / stages[0].value) * 100),
  };
});

// --- SVG mount ---------------------------------------------------------------
const svg = d3.select("#container").append("svg").attr("width", width).attr("height", height);

// --- Funnel segments -----------------------------------------------------
svg
  .selectAll("path.stage")
  .data(bands)
  .join("path")
  .attr("class", "stage")
  .attr(
    "d",
    (d) =>
      `M${cx - d.topW / 2},${d.y0} L${cx + d.topW / 2},${d.y0} ` +
      `L${cx + d.bottomW / 2},${d.y1} L${cx - d.bottomW / 2},${d.y1} Z`
  )
  .attr("fill", (d) => d.color);

// --- Drop-off labels between stages ---------------------------------------
svg
  .selectAll("text.dropoff")
  .data(bands.slice(0, -1))
  .join("text")
  .attr("class", "dropoff")
  .attr("x", cx)
  .attr("y", (d) => d.y1 + bandGap / 2 + 5)
  .attr("text-anchor", "middle")
  .style("font-size", "14px")
  .style("font-weight", "500")
  .attr("fill", t.inkSoft)
  .text((d, i) => `↓ ${Math.round((1 - bands[i + 1].value / d.value) * 100)}%`);

// --- Leader lines + stage labels -------------------------------------------
const labelGroup = svg.selectAll("g.label").data(bands).join("g").attr("class", "label");

labelGroup.each(function (d) {
  const g = d3.select(this);
  const midY = (d.y0 + d.y1) / 2;
  const midW = (d.topW + d.bottomW) / 2;
  const edgeX = cx + midW / 2;

  g.append("line")
    .attr("x1", edgeX)
    .attr("y1", midY)
    .attr("x2", labelX - 12)
    .attr("y2", midY)
    .attr("stroke", t.grid)
    .attr("stroke-width", 1.5);

  g.append("text")
    .attr("x", labelX)
    .attr("y", midY - 8)
    .style("font-size", "18px")
    .style("font-weight", "600")
    .attr("fill", t.ink)
    .text(d.name);

  g.append("text")
    .attr("x", labelX)
    .attr("y", midY + 16)
    .style("font-size", "15px")
    .attr("fill", t.inkSoft)
    .text(`${d.value.toLocaleString()} · ${d.pctOfFirst}%`);
});

// --- Title -------------------------------------------------------------------
svg
  .append("text")
  .attr("x", width / 2)
  .attr("y", 56)
  .attr("text-anchor", "middle")
  .attr("fill", t.ink)
  .style("font-size", "24px")
  .style("font-weight", "600")
  .text("funnel-basic · javascript · d3 · anyplot.ai");
Runnable source as JSON, for any HTTP client: https://api.anyplot.ai/specs/funnel-basic/d3/code. Any spec id and library id listed in llms-full.txt fit the same URL shape; every URL below is complete and callable.
{
  "spec_id": "funnel-basic",
  "language": "javascript",
  "library": "d3",
  "page": "https://anyplot.ai/funnel-basic/javascript/d3",
  "hub": "https://anyplot.ai/funnel-basic",
  "code_json": "https://api.anyplot.ai/specs/funnel-basic/d3/code",
  "spec_json": "https://api.anyplot.ai/specs/funnel-basic",
  "render_light_png": "https://storage.googleapis.com/anyplot-images/plots/funnel-basic/javascript/d3/plot-light.png",
  "render_dark_png": "https://storage.googleapis.com/anyplot-images/plots/funnel-basic/javascript/d3/plot-dark.png",
  "interactive_light_html": "https://storage.googleapis.com/anyplot-images/plots/funnel-basic/javascript/d3/plot-light.html",
  "interactive_dark_html": "https://storage.googleapis.com/anyplot-images/plots/funnel-basic/javascript/d3/plot-dark.html",
  "quality_score": 90.0,
  "license": "MIT",
  "guide": "https://anyplot.ai/llms.txt"
}
Part of Basic Funnel Chart on anyplot.ai.