The same plot in 14 other libraries — JavaScript: Chart.js, D3.js, Apache ECharts, Highcharts; Python: Altair, Bokeh, lets-plot, Matplotlib, Plotly, plotnine, Pygal, Seaborn; R: ggplot2; Julia: Makie.jl. Compare all 15 side by side: Basic Funnel Chart in Python, R, Julia and JavaScript.
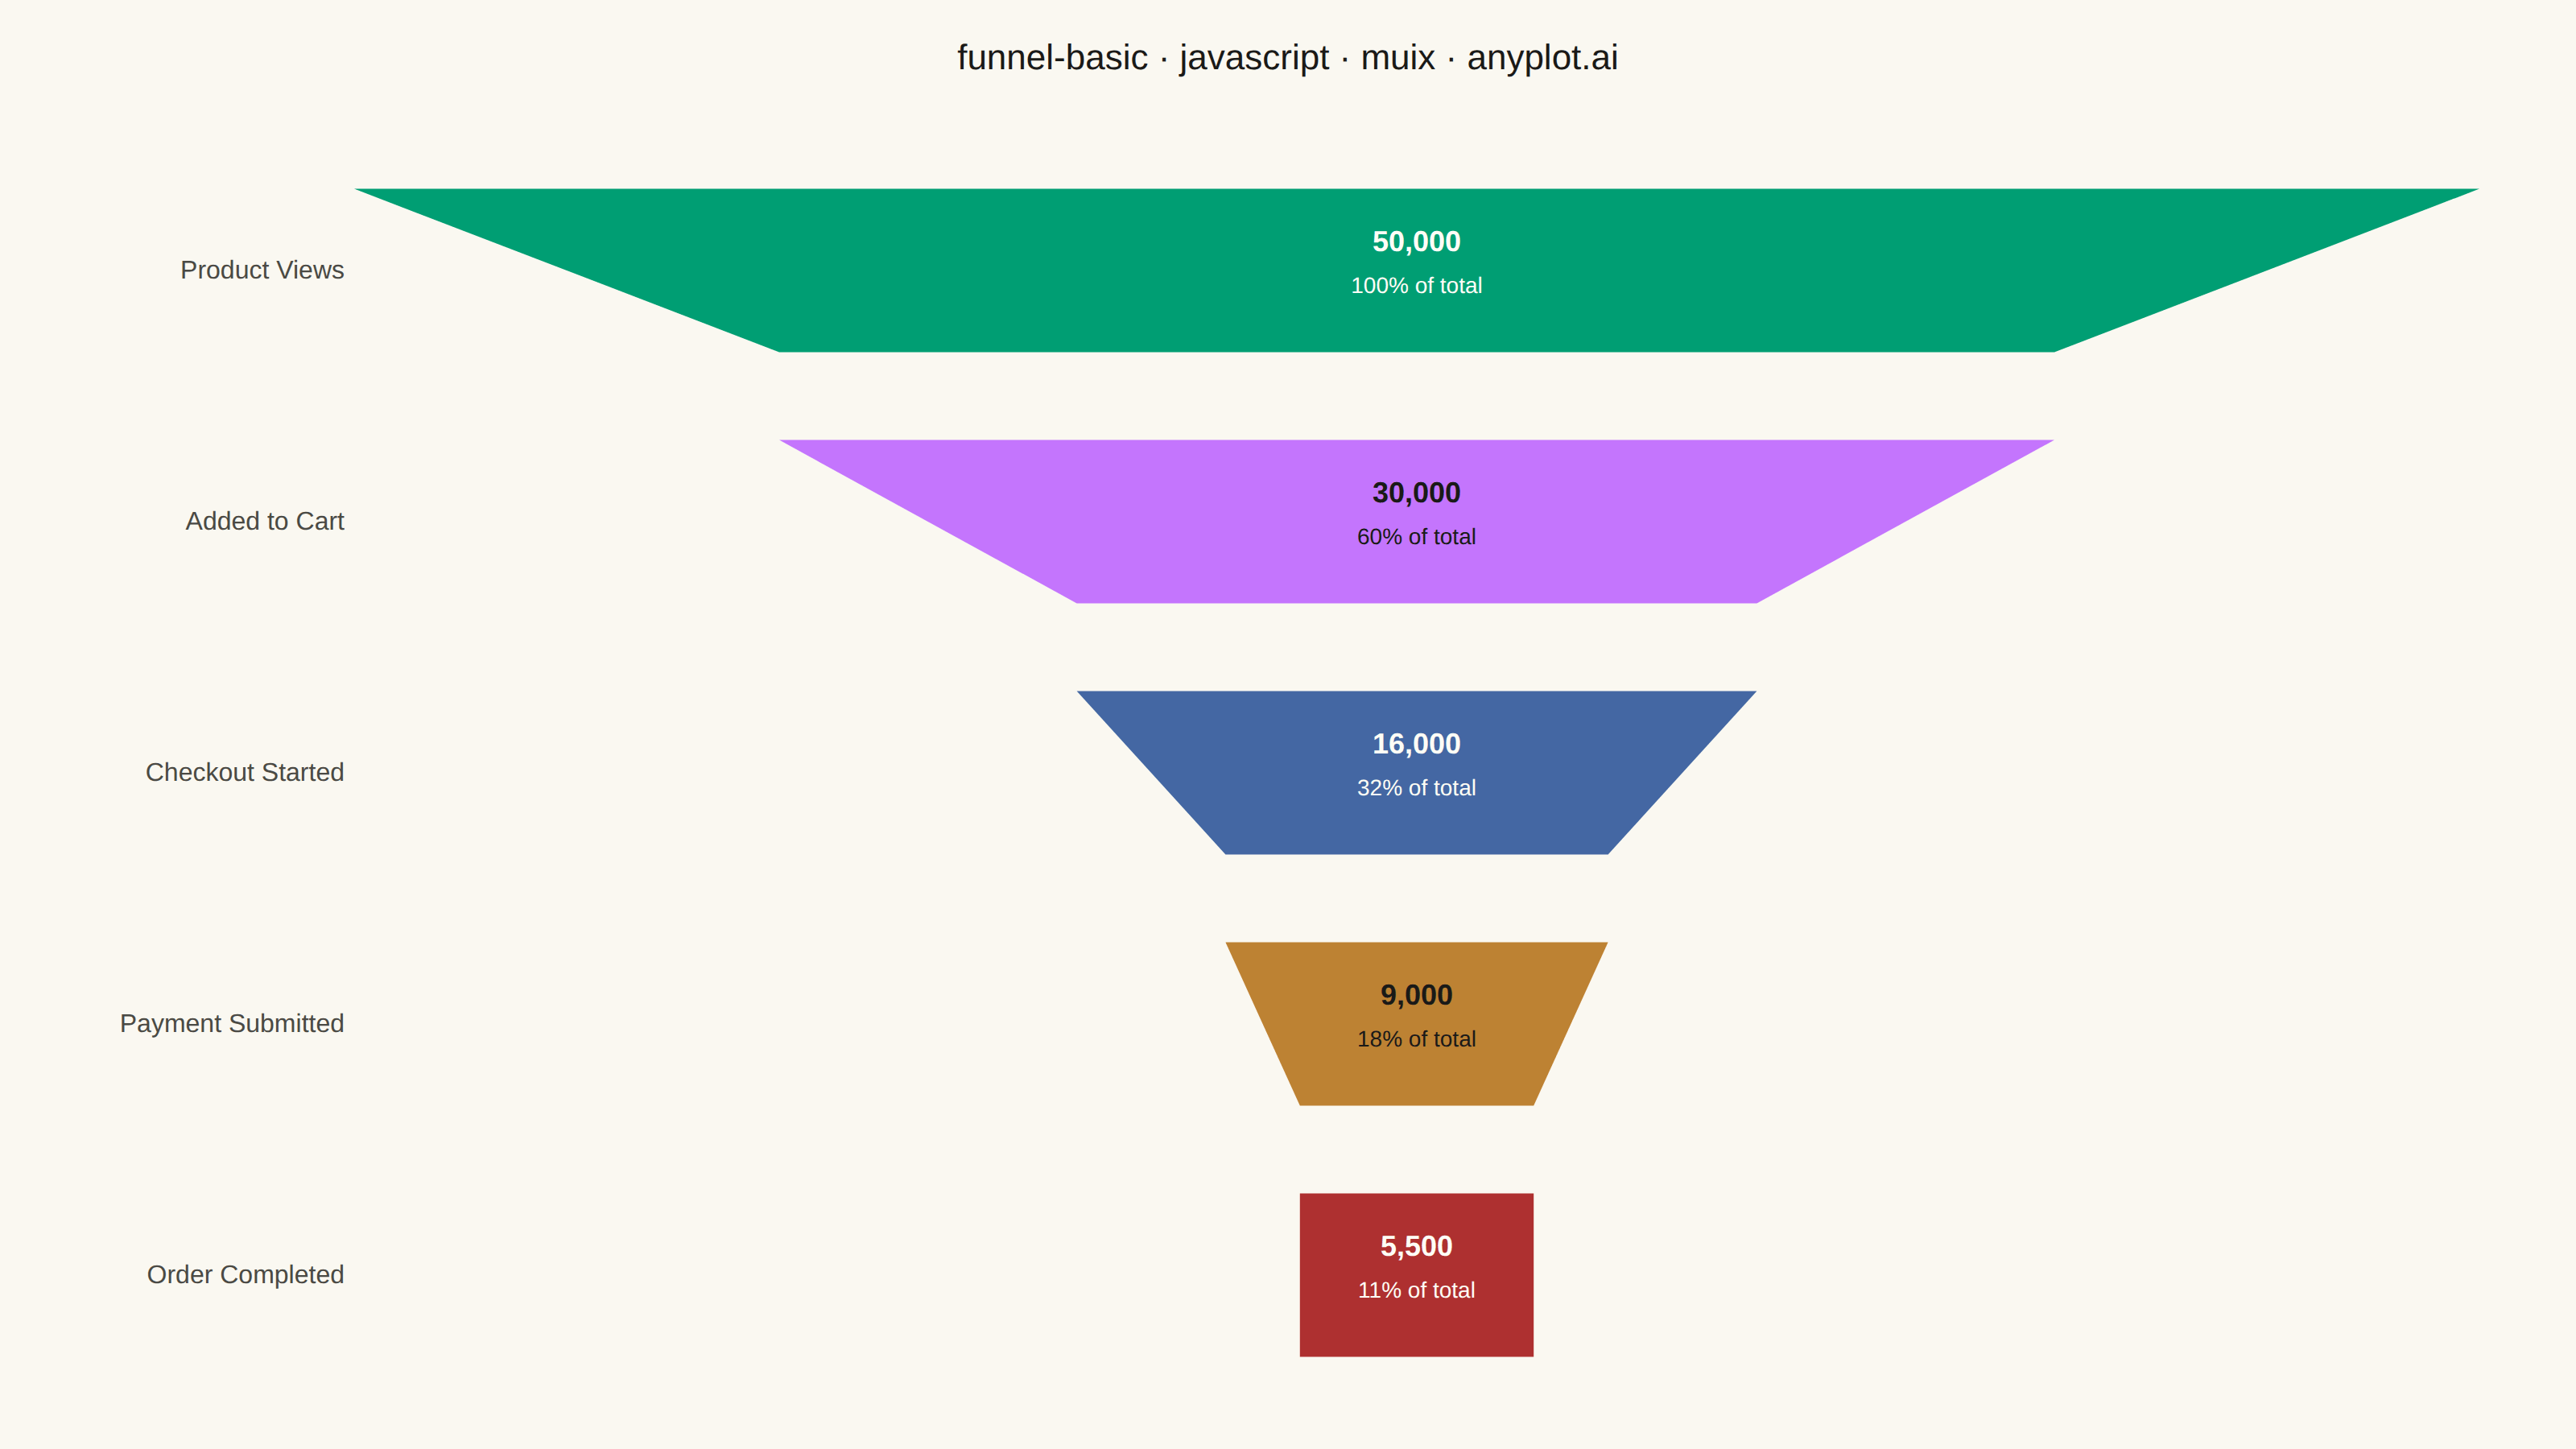
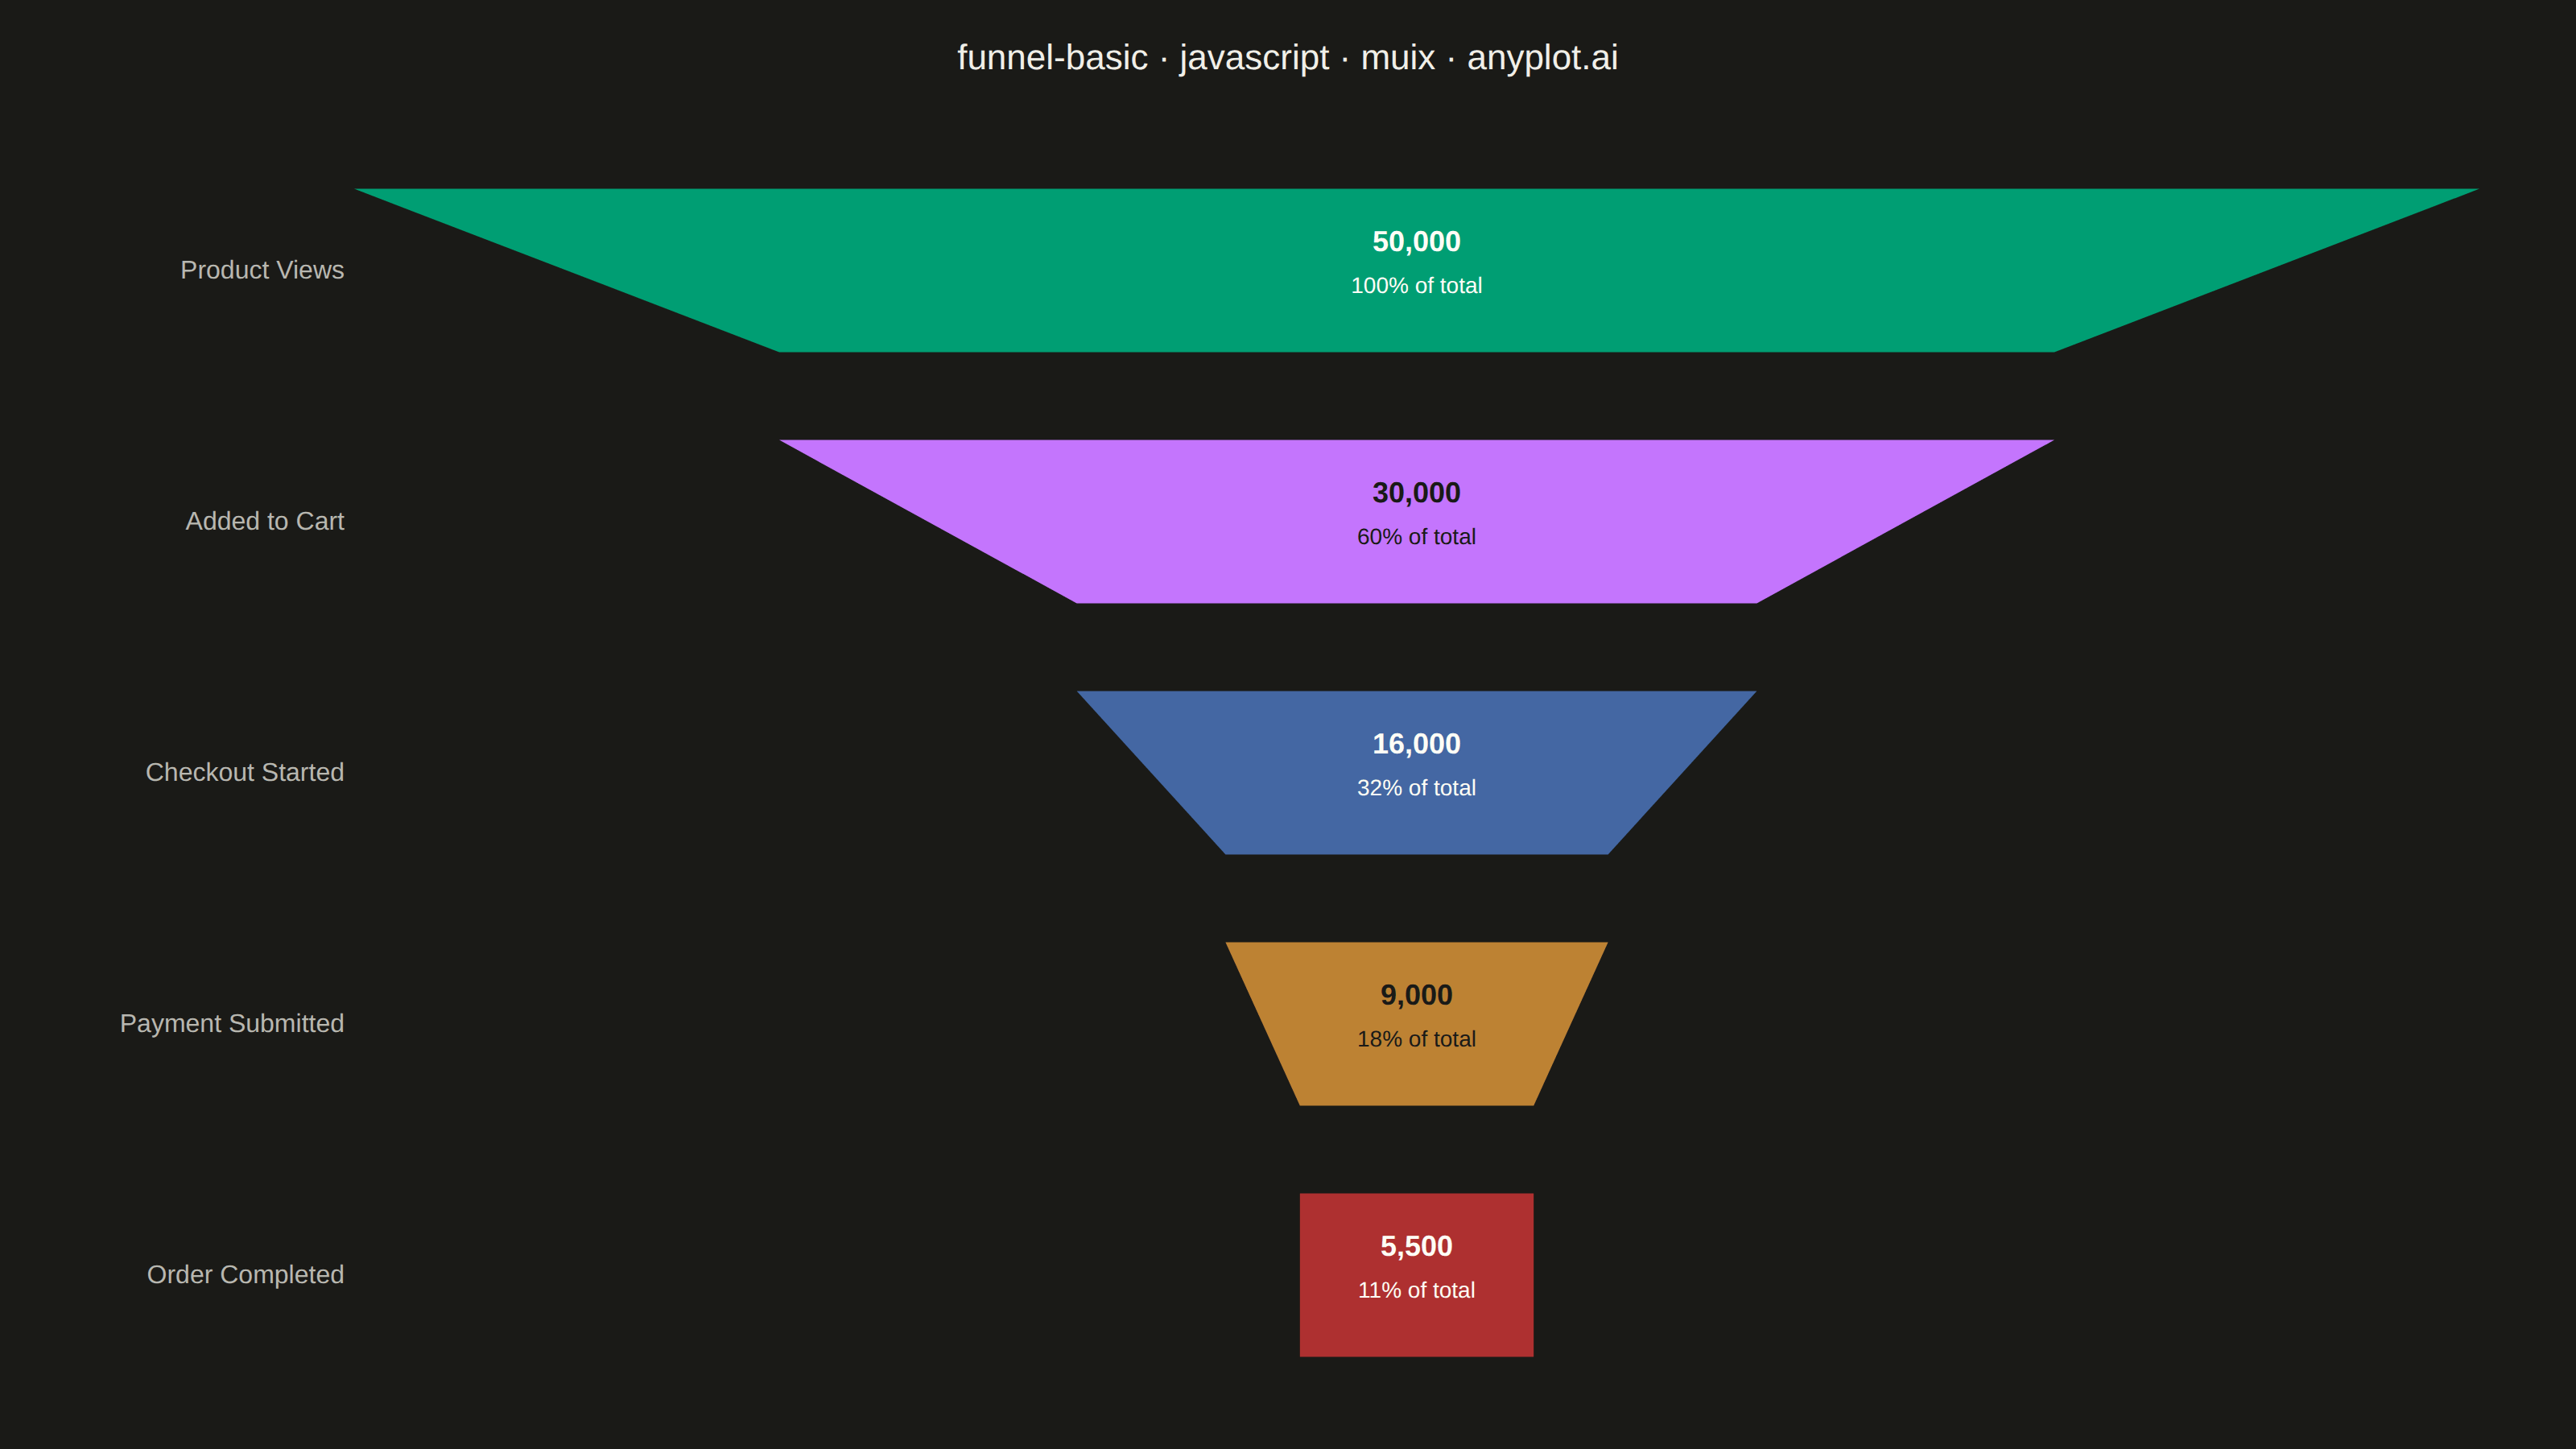
A funnel chart visualizes sequential stages of a process where values progressively decrease from one stage to the next. Each stage is represented as a trapezoidal segment that narrows from top to bottom, making it easy to identify drop-offs between stages. This chart is ideal for tracking conversion rates, sales pipelines, and multi-step processes where understanding stage-to-stage transitions is critical.
// anyplot.ai
// funnel-basic: Basic Funnel Chart
// Library: muix 7.29.1 | JavaScript 22.23.2
// Quality: 93/100 | Created: 2026-09-05

import { ChartContainer } from "@mui/x-charts/ChartContainer";
import { ChartsYAxis } from "@mui/x-charts/ChartsYAxis";
import { useXScale, useYScale, useDrawingArea } from "@mui/x-charts";
import Box from "@mui/material/Box";
import Typography from "@mui/material/Typography";

const t = window.ANYPLOT_TOKENS;

// E-commerce checkout pipeline — product views through completed orders
const stages = [
  { name: "Product Views", value: 50000 },
  { name: "Added to Cart", value: 30000 },
  { name: "Checkout Started", value: 16000 },
  { name: "Payment Submitted", value: 9000 },
  { name: "Order Completed", value: 5500 },
];
const stageNames = stages.map((s) => s.name);
const MAX_VAL = stages[0].value;

// @mui/x-charts has no native FunnelChart in the community package — this
// composes ChartContainer's own band/linear scales (as `useXScale`/`useYScale`
// expose) with a hand-drawn trapezoid per stage, the same low-level pattern
// as an MUI X gauge/sparkline built from ChartsSurface primitives.
function contrastText(hex) {
  const r = parseInt(hex.slice(1, 3), 16);
  const g = parseInt(hex.slice(3, 5), 16);
  const b = parseInt(hex.slice(5, 7), 16);
  const luminance = 0.299 * r + 0.587 * g + 0.114 * b;
  return luminance > 128 ? "#1A1A17" : "#FFFDF6";
}

// Must be rendered inside ChartContainer to access its scale context
function FunnelPlot() {
  const xScale = useXScale();
  const yScale = useYScale();
  const drawingArea = useDrawingArea();

  // Wait until band scale is fully resolved
  if (!xScale || !yScale || typeof yScale.bandwidth !== "function") return null;

  const x0 = +xScale(0);
  const cx = drawingArea.left + drawingArea.width / 2;
  const bandwidth = yScale.bandwidth();

  return (
    <g>
      {stages.map((stage, i) => {
        const bandTop = yScale(stage.name);
        if (bandTop == null || !isFinite(+bandTop)) return null;

        const y0 = +bandTop;
        const y1 = y0 + bandwidth;
        const topW = +xScale(stage.value) - x0;
        const nextVal = i < stages.length - 1 ? stages[i + 1].value : stage.value;
        const bottomW = +xScale(nextVal) - x0;
        const color = t.palette[i % t.palette.length];
        const labelColor = contrastText(color);
        const pct = Math.round((stage.value / MAX_VAL) * 100);

        const points = [
          [cx - topW / 2, y0],
          [cx + topW / 2, y0],
          [cx + bottomW / 2, y1],
          [cx - bottomW / 2, y1],
        ]
          .map((p) => p.join(","))
          .join(" ");

        return (
          <g key={stage.name}>
            <polygon points={points} fill={color} />
            <text
              x={cx}
              y={y0 + bandwidth / 2 - 12}
              fill={labelColor}
              fontSize={18}
              fontWeight={600}
              textAnchor="middle"
              fontFamily="sans-serif"
            >
              {stage.value.toLocaleString()}
            </text>
            <text
              x={cx}
              y={y0 + bandwidth / 2 + 14}
              fill={labelColor}
              fontSize={14}
              textAnchor="middle"
              fontFamily="sans-serif"
            >
              {pct}% of total
            </text>
          </g>
        );
      })}
    </g>
  );
}

const TITLE = "funnel-basic · javascript · muix · anyplot.ai";
const TITLE_HEIGHT = 70;
const MARGIN = { top: 20, right: 60, bottom: 30, left: 220 };

export default function Chart() {
  const chartWidth = window.ANYPLOT_SIZE.width;
  const chartHeight = window.ANYPLOT_SIZE.height - TITLE_HEIGHT;

  return (
    <Box
      sx={{
        width: chartWidth,
        height: window.ANYPLOT_SIZE.height,
        display: "flex",
        flexDirection: "column",
      }}
    >
      <Box
        sx={{
          height: TITLE_HEIGHT,
          display: "flex",
          alignItems: "center",
          justifyContent: "center",
          flexShrink: 0,
        }}
      >
        <Typography sx={{ color: t.ink, fontSize: 22, fontWeight: 500 }}>
          {TITLE}
        </Typography>
      </Box>

      <ChartContainer
        skipAnimation
        width={chartWidth}
        height={chartHeight}
        margin={MARGIN}
        series={[
          {
            type: "bar",
            data: stages.map((s) => s.value),
            layout: "horizontal",
          },
        ]}
        xAxis={[{ scaleType: "linear", min: 0, max: MAX_VAL }]}
        yAxis={[
          {
            scaleType: "band",
            data: stageNames,
            categoryGapRatio: 0.35,
            disableLine: true,
            disableTicks: true,
            tickLabelStyle: { fontSize: 16, fill: t.inkSoft, fontWeight: 500 },
          },
        ]}
      >
        <FunnelPlot />
        <ChartsYAxis />
      </ChartContainer>
    </Box>
  );
}
Runnable source as JSON, for any HTTP client: https://api.anyplot.ai/specs/funnel-basic/muix/code. Any spec id and library id listed in llms-full.txt fit the same URL shape; every URL below is complete and callable.
{
  "spec_id": "funnel-basic",
  "language": "javascript",
  "library": "muix",
  "page": "https://anyplot.ai/funnel-basic/javascript/muix",
  "hub": "https://anyplot.ai/funnel-basic",
  "code_json": "https://api.anyplot.ai/specs/funnel-basic/muix/code",
  "spec_json": "https://api.anyplot.ai/specs/funnel-basic",
  "render_light_png": "https://storage.googleapis.com/anyplot-images/plots/funnel-basic/javascript/muix/plot-light.png",
  "render_dark_png": "https://storage.googleapis.com/anyplot-images/plots/funnel-basic/javascript/muix/plot-dark.png",
  "interactive_light_html": "https://storage.googleapis.com/anyplot-images/plots/funnel-basic/javascript/muix/plot-light.html",
  "interactive_dark_html": "https://storage.googleapis.com/anyplot-images/plots/funnel-basic/javascript/muix/plot-dark.html",
  "quality_score": 93.0,
  "license": "MIT",
  "guide": "https://anyplot.ai/llms.txt"
}
Part of Basic Funnel Chart on anyplot.ai.