The same plot in 14 other libraries — JavaScript: D3.js, Apache ECharts, Highcharts, MUI X Charts; Python: Altair, Bokeh, lets-plot, Matplotlib, Plotly, plotnine, Pygal, Seaborn; R: ggplot2; Julia: Makie.jl. Compare all 15 side by side: Genome Track Viewer in Python, R, Julia and JavaScript.
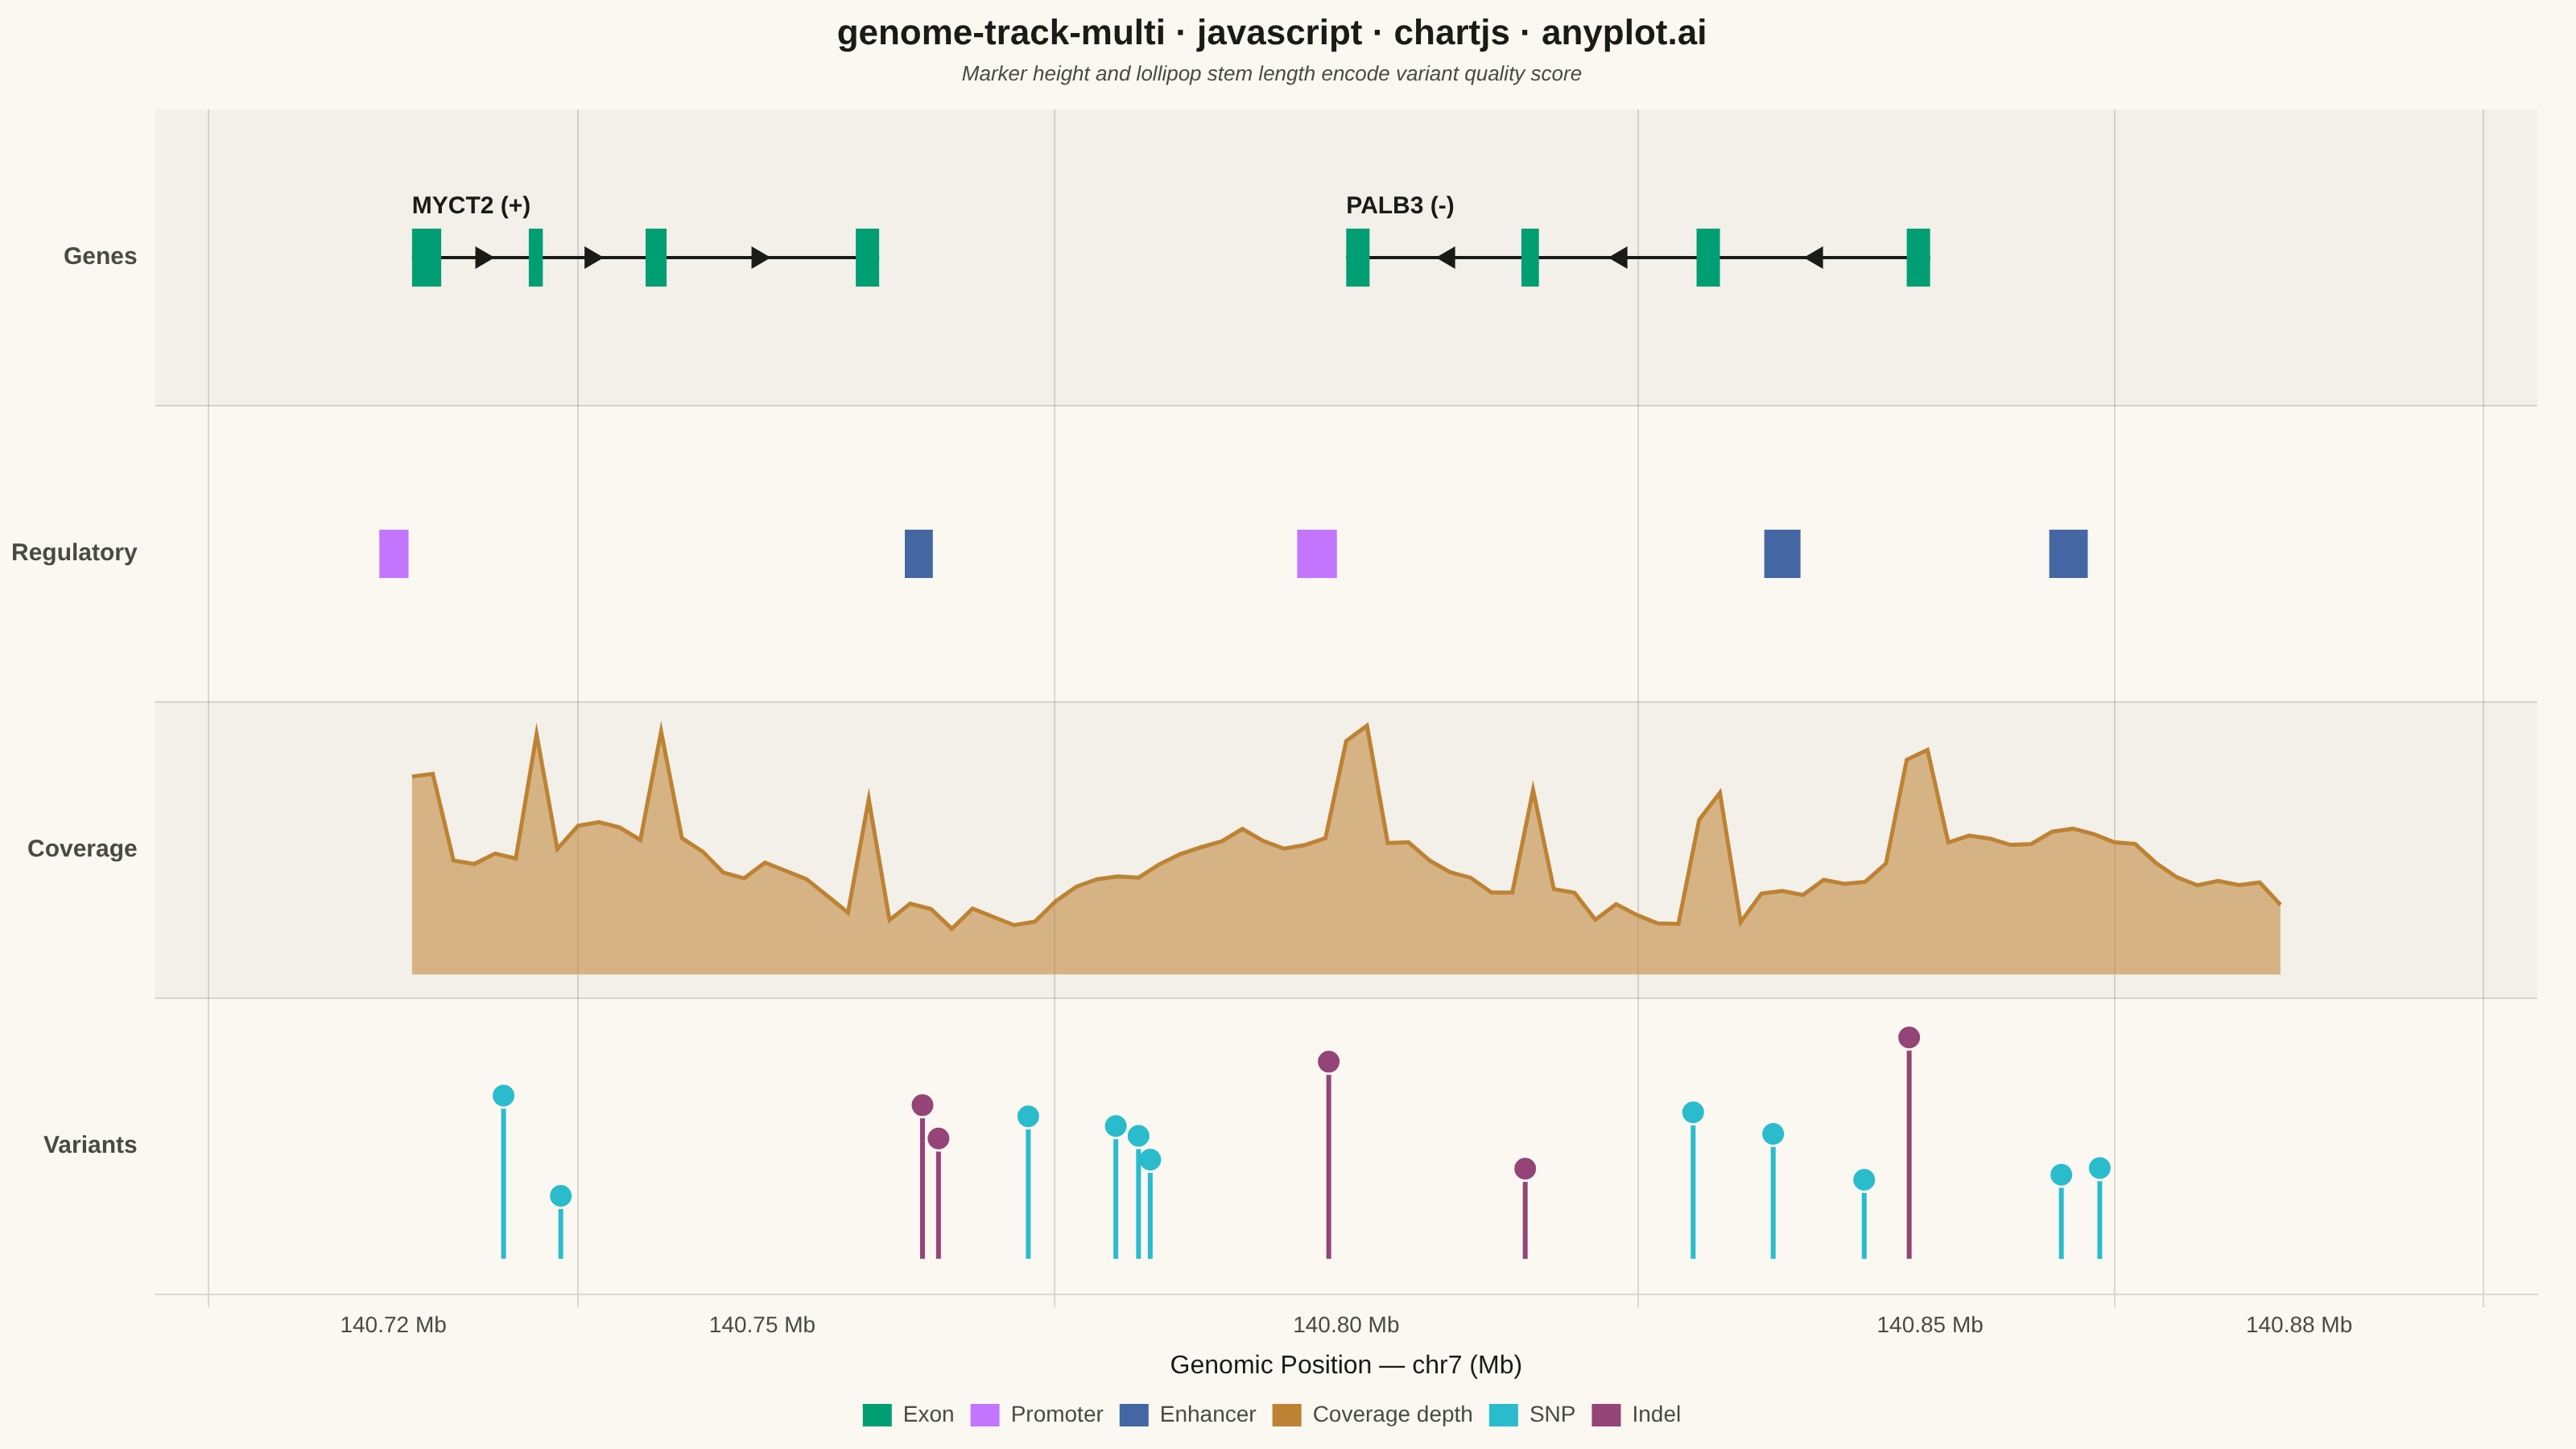
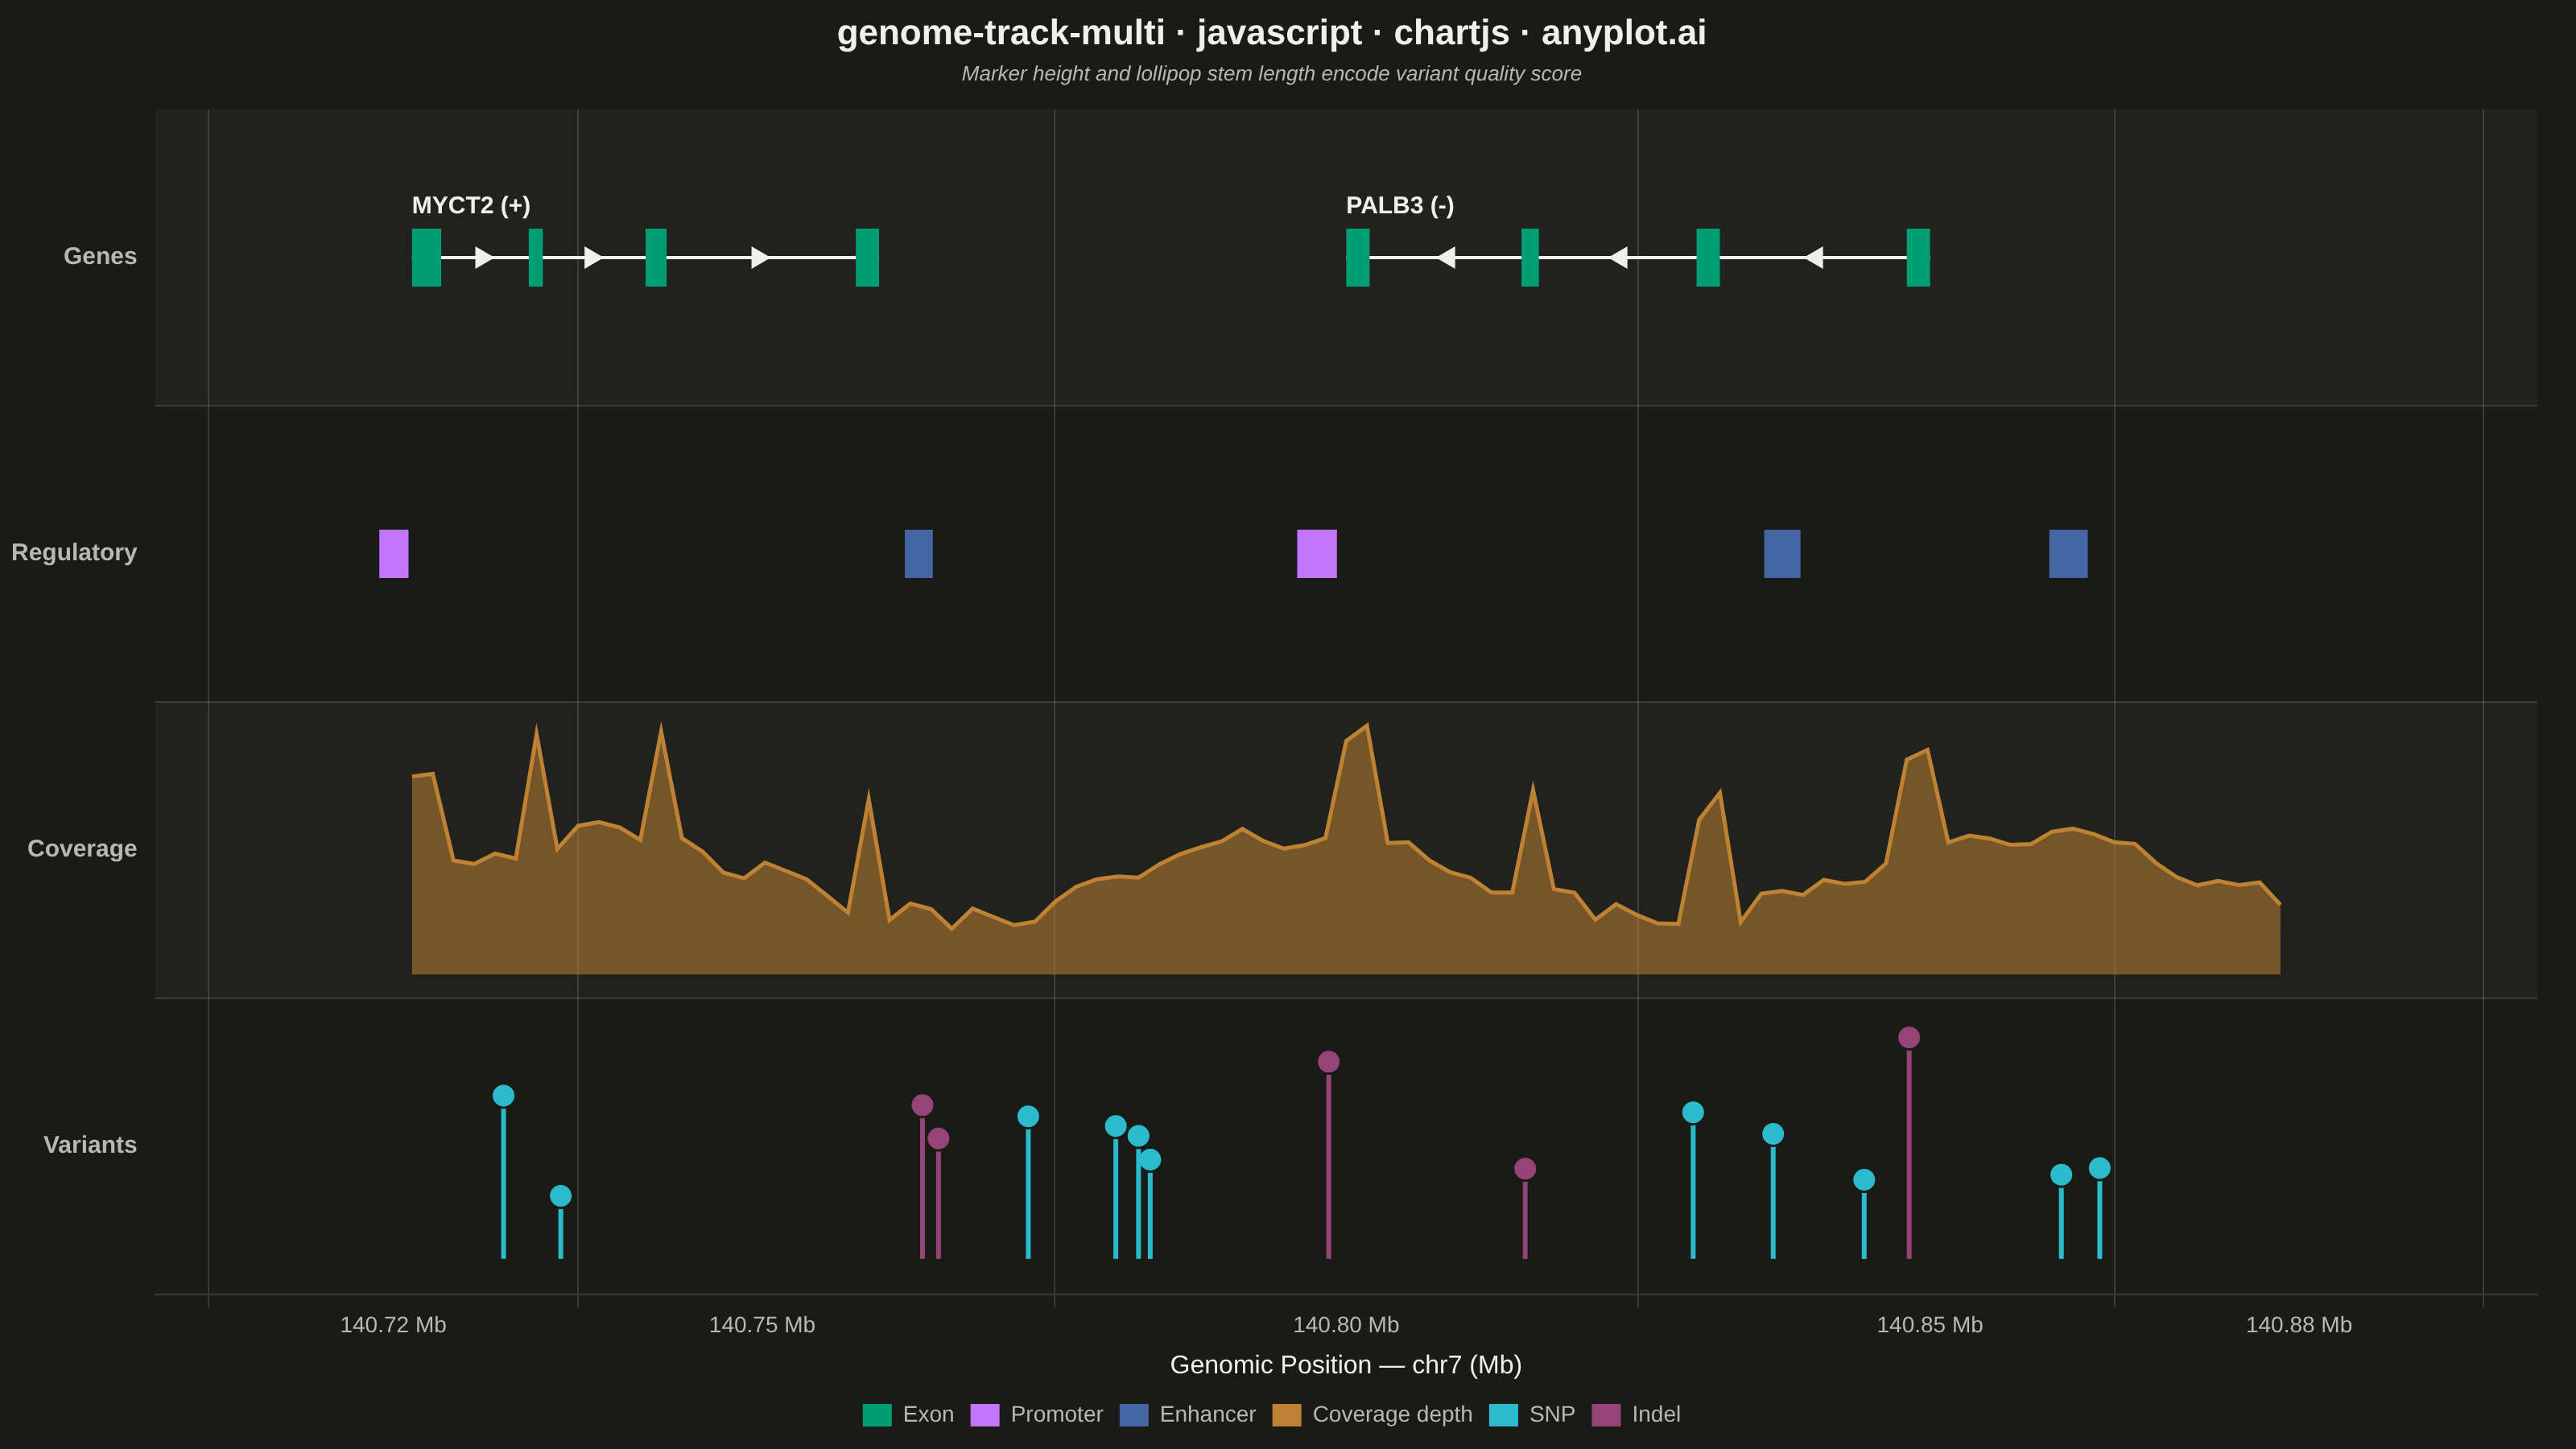
A multi-track genome browser view that displays different types of genomic data aligned along a shared chromosomal coordinate axis. Multiple parallel horizontal tracks (gene annotations, read coverage, variants, regulatory elements) are stacked vertically, each showing a different data type at the same genomic locus. This visualization is essential for integrative genomics, enabling researchers to explore relationships between gene structure, expression, variation, and regulation in a single coordinated view.
// anyplot.ai
// genome-track-multi: Genome Track Viewer
// Library: chartjs 4.4.7 | JavaScript 22.23.2
// Quality: 92/100 | Created: 2026-08-25

const t = window.ANYPLOT_TOKENS;
const THEME = window.ANYPLOT_THEME;
const NEUTRAL = t.ink; // structural/reference elements (Imprint "neutral" anchor == INK)
const BAND_FILL = THEME === "light" ? "rgba(26,26,23,0.035)" : "rgba(240,239,232,0.035)";

// --- Data (in-memory, deterministic) ----------------------------------------
// Tiny fixed-seed LCG — the browser has no seeded RNG.
function makeLcg(seed) {
  let state = seed >>> 0;
  return function () {
    state = (state * 1664525 + 1013904223) >>> 0;
    return state / 4294967296;
  };
}
const rng = makeLcg(42);

const REGION_START = 140720000;
const REGION_END = 140880000;
const REGION_SPAN = REGION_END - REGION_START;

// Genes track: exon/intron structure with strand direction.
const genes = [
  {
    label: "MYCT2",
    strand: "+",
    exons: [
      [140720000, 140722500],
      [140730000, 140731200],
      [140740000, 140741800],
      [140758000, 140760000],
    ],
  },
  {
    label: "PALB3",
    strand: "-",
    exons: [
      [140800000, 140802000],
      [140815000, 140816500],
      [140830000, 140832000],
      [140848000, 140850000],
    ],
  },
];

// Regulatory track: promoters and enhancers.
const regulatory = [
  { start: 140717200, end: 140719700, type: "promoter", label: "MYCT2 promoter" },
  { start: 140762200, end: 140764600, type: "enhancer", label: "Enh-1" },
  { start: 140795800, end: 140799200, type: "promoter", label: "PALB3 promoter" },
  { start: 140835800, end: 140838900, type: "enhancer", label: "Enh-2" },
  { start: 140860200, end: 140863500, type: "enhancer", label: "Enh-3" },
];

// Coverage track: sequencing read depth, enriched over exons.
const COVERAGE_POINTS = 90;
const coverage = [];
for (let i = 0; i <= COVERAGE_POINTS; i++) {
  const pos = REGION_START + (i / COVERAGE_POINTS) * REGION_SPAN;
  let depth = 26 + 13 * Math.sin(i / 5.5) + rng() * 9;
  const inExon = genes.some((g) => g.exons.some(([s, e]) => pos >= s && pos <= e));
  if (inExon) depth += 34;
  coverage.push({ x: pos, depth: Math.max(5, depth) });
}
const maxDepth = Math.max(...coverage.map((c) => c.depth));

// Variants track: SNPs and indels with a quality score.
const VARIANT_TYPES = [
  "SNP", "SNP", "indel", "SNP", "SNP", "indel", "SNP", "SNP",
  "indel", "SNP", "SNP", "indel", "SNP", "indel", "SNP", "SNP",
];
const variants = VARIANT_TYPES.map((type, i) => ({
  x: REGION_START + 6000 + rng() * (REGION_SPAN - 12000),
  type,
  quality: 22 + rng() * 78,
  label: `${type === "SNP" ? "rs" : "in"}${1000 + i}`,
}));

// --- Row layout (bottom to top) ---------------------------------------------
const ROW = { VARIANTS: 0, COVERAGE: 1, REGULATORY: 2, GENES: 3 };
const ROW_LABELS = { 3.5: "Genes", 2.5: "Regulatory", 1.5: "Coverage", 0.5: "Variants" };
const GENES_Y = ROW.GENES + 0.5;
const REG_Y = ROW.REGULATORY + 0.5;
const COV_BASE = ROW.COVERAGE + 0.08;
const COV_TOP = ROW.COVERAGE + 0.92;
const VAR_BASE = ROW.VARIANTS + 0.12;
const VAR_TOP = ROW.VARIANTS + 0.88;

const REG_COLOR = { promoter: t.palette[1], enhancer: t.palette[2] };
const VARIANT_COLOR = { SNP: t.palette[5], indel: t.palette[6] };
const EXON_COLOR = t.palette[0]; // Imprint palette position 1 — always first series
const COVERAGE_COLOR = t.palette[3];

// --- Custom drawing plugin ---------------------------------------------------
// Chart.js ships no genome-track geometry (exon boxes, strand chevrons,
// lollipop markers), so this plugin paints the tracks directly onto the
// scale's coordinate system while Chart.js owns axes, ticks and legend.
const genomeTracksPlugin = {
  id: "genomeTracks",
  beforeDraw(chart) {
    const { ctx, chartArea, scales } = chart;
    const y = scales.y;
    ctx.save();
    // Alternating subtle band shading to separate adjacent tracks.
    [ROW.GENES, ROW.COVERAGE].forEach((row) => {
      const top = y.getPixelForValue(row + 1);
      const bottom = y.getPixelForValue(row);
      ctx.fillStyle = BAND_FILL;
      ctx.fillRect(chartArea.left, top, chartArea.right - chartArea.left, bottom - top);
    });
    // Thin separator rules between tracks.
    ctx.strokeStyle = t.grid;
    ctx.lineWidth = 1;
    [1, 2, 3].forEach((row) => {
      const py = y.getPixelForValue(row);
      ctx.beginPath();
      ctx.moveTo(chartArea.left, py);
      ctx.lineTo(chartArea.right, py);
      ctx.stroke();
    });
    ctx.restore();
  },
  afterDatasetsDraw(chart) {
    const { ctx, scales } = chart;
    const x = scales.x;
    const y = scales.y;
    const px = (pos) => x.getPixelForValue(pos);
    const py = (row) => y.getPixelForValue(row);

    // --- Genes: backbone line, exon boxes, strand chevrons -----------------
    ctx.save();
    genes.forEach((gene) => {
      const spanStart = gene.exons[0][0];
      const spanEnd = gene.exons[gene.exons.length - 1][1];
      const rowPx = py(GENES_Y);

      ctx.strokeStyle = NEUTRAL;
      ctx.lineWidth = 2;
      ctx.beginPath();
      ctx.moveTo(px(spanStart), rowPx);
      ctx.lineTo(px(spanEnd), rowPx);
      ctx.stroke();

      // Strand chevrons at each intron midpoint.
      for (let i = 0; i < gene.exons.length - 1; i++) {
        const midPos = (gene.exons[i][1] + gene.exons[i + 1][0]) / 2;
        const cx = px(midPos);
        const dir = gene.strand === "+" ? 1 : -1;
        ctx.fillStyle = NEUTRAL;
        ctx.beginPath();
        ctx.moveTo(cx - dir * 6, rowPx - 7);
        ctx.lineTo(cx + dir * 6, rowPx);
        ctx.lineTo(cx - dir * 6, rowPx + 7);
        ctx.closePath();
        ctx.fill();
      }

      // Exon boxes.
      ctx.fillStyle = EXON_COLOR;
      gene.exons.forEach(([s, e]) => {
        const width = Math.max(px(e) - px(s), 2);
        ctx.fillRect(px(s), rowPx - 18, width, 36);
      });

      // Gene label with strand arrow.
      ctx.fillStyle = t.ink;
      ctx.font = "600 15px sans-serif";
      ctx.textAlign = "left";
      ctx.textBaseline = "bottom";
      ctx.fillText(`${gene.label} (${gene.strand})`, px(spanStart), rowPx - 24);
    });
    ctx.restore();

    // --- Regulatory: colored boxes ------------------------------------------
    ctx.save();
    regulatory.forEach((r) => {
      const rowPx = py(REG_Y);
      const width = Math.max(px(r.end) - px(r.start), 2);
      ctx.fillStyle = REG_COLOR[r.type];
      ctx.fillRect(px(r.start), rowPx - 15, width, 30);
    });
    ctx.restore();

    // --- Coverage: filled area plot -----------------------------------------
    ctx.save();
    ctx.beginPath();
    ctx.moveTo(px(coverage[0].x), py(COV_BASE));
    coverage.forEach((c) => {
      const yy = COV_BASE + (c.depth / maxDepth) * (COV_TOP - COV_BASE);
      ctx.lineTo(px(c.x), py(yy));
    });
    ctx.lineTo(px(coverage[coverage.length - 1].x), py(COV_BASE));
    ctx.closePath();
    ctx.fillStyle = COVERAGE_COLOR + "8c"; // ~55% alpha fill
    ctx.fill();

    ctx.beginPath();
    coverage.forEach((c, i) => {
      const yy = COV_BASE + (c.depth / maxDepth) * (COV_TOP - COV_BASE);
      const fn = i === 0 ? "moveTo" : "lineTo";
      ctx[fn](px(c.x), py(yy));
    });
    ctx.strokeStyle = COVERAGE_COLOR;
    ctx.lineWidth = 2.5;
    ctx.stroke();
    ctx.restore();

    // --- Variants: lollipop markers -----------------------------------------
    ctx.save();
    variants.forEach((v) => {
      const cx = px(v.x);
      const topY = py(VAR_BASE + (v.quality / 100) * (VAR_TOP - VAR_BASE));
      const baseY = py(VAR_BASE);
      const color = VARIANT_COLOR[v.type];

      ctx.strokeStyle = color;
      ctx.lineWidth = 3;
      ctx.beginPath();
      ctx.moveTo(cx, baseY);
      ctx.lineTo(cx, topY);
      ctx.stroke();

      ctx.beginPath();
      ctx.arc(cx, topY, 7.5, 0, Math.PI * 2);
      ctx.fillStyle = color;
      ctx.fill();
      ctx.lineWidth = 1.5;
      ctx.strokeStyle = t.pageBg;
      ctx.stroke();
    });
    ctx.restore();
  },
};

// --- Mount -------------------------------------------------------------------
const canvas = document.createElement("canvas");
document.getElementById("container").appendChild(canvas);

// --- Chart ---------------------------------------------------------------------
// Chart.js supplies axes, legend and title; the plugin above paints the actual
// genome-track geometry. Legend entries are color-only proxy datasets (empty
// `data`) since Chart.js has no native exon/lollipop/area-band chart type.
new Chart(canvas, {
  type: "bar",
  data: {
    datasets: [
      { label: "Exon", data: [], backgroundColor: EXON_COLOR },
      { label: "Promoter", data: [], backgroundColor: REG_COLOR.promoter },
      { label: "Enhancer", data: [], backgroundColor: REG_COLOR.enhancer },
      { label: "Coverage depth", data: [], backgroundColor: COVERAGE_COLOR },
      { label: "SNP", data: [], backgroundColor: VARIANT_COLOR.SNP },
      { label: "Indel", data: [], backgroundColor: VARIANT_COLOR.indel },
    ],
  },
  options: {
    responsive: true,
    maintainAspectRatio: false,
    animation: false,
    layout: { padding: { top: 8, right: 24, bottom: 4, left: 4 } },
    plugins: {
      title: {
        display: true,
        text: "genome-track-multi · javascript · chartjs · anyplot.ai",
        color: t.ink,
        font: { size: 22, weight: "600" },
        padding: { bottom: 4 },
      },
      subtitle: {
        display: true,
        text: "Marker height and lollipop stem length encode variant quality score",
        color: t.inkSoft,
        font: { size: 13, style: "italic" },
        padding: { bottom: 14 },
      },
      legend: {
        position: "bottom",
        labels: { color: t.inkSoft, font: { size: 14 }, boxWidth: 18, boxHeight: 14 },
      },
    },
    scales: {
      x: {
        type: "linear",
        min: REGION_START - REGION_SPAN * 0.01,
        max: REGION_END + REGION_SPAN * 0.01,
        ticks: {
          color: t.inkSoft,
          font: { size: 14 },
          callback: (value) => (value / 1e6).toFixed(2) + " Mb",
          maxTicksLimit: 8,
        },
        grid: { color: t.grid },
        border: { color: t.grid },
        title: { display: true, text: "Genomic Position — chr7 (Mb)", color: t.ink, font: { size: 16 } },
      },
      y: {
        type: "linear",
        min: 0,
        max: 4,
        afterBuildTicks: (axis) => {
          axis.ticks = [0.5, 1.5, 2.5, 3.5].map((value) => ({ value }));
        },
        ticks: {
          color: t.inkSoft,
          font: { size: 15, weight: "600" },
          callback: (value) => ROW_LABELS[value] ?? "",
        },
        grid: { display: false },
        border: { display: false },
      },
    },
  },
  plugins: [genomeTracksPlugin],
});
Runnable source as JSON, for any HTTP client: https://api.anyplot.ai/specs/genome-track-multi/chartjs/code. Any spec id and library id listed in llms-full.txt fit the same URL shape; every URL below is complete and callable.
{
  "spec_id": "genome-track-multi",
  "language": "javascript",
  "library": "chartjs",
  "page": "https://anyplot.ai/genome-track-multi/javascript/chartjs",
  "hub": "https://anyplot.ai/genome-track-multi",
  "code_json": "https://api.anyplot.ai/specs/genome-track-multi/chartjs/code",
  "spec_json": "https://api.anyplot.ai/specs/genome-track-multi",
  "render_light_png": "https://storage.googleapis.com/anyplot-images/plots/genome-track-multi/javascript/chartjs/plot-light.png",
  "render_dark_png": "https://storage.googleapis.com/anyplot-images/plots/genome-track-multi/javascript/chartjs/plot-dark.png",
  "interactive_light_html": "https://storage.googleapis.com/anyplot-images/plots/genome-track-multi/javascript/chartjs/plot-light.html",
  "interactive_dark_html": "https://storage.googleapis.com/anyplot-images/plots/genome-track-multi/javascript/chartjs/plot-dark.html",
  "quality_score": 92.0,
  "license": "MIT",
  "guide": "https://anyplot.ai/llms.txt"
}
Part of Genome Track Viewer on anyplot.ai.