The same plot in 14 other libraries — JavaScript: Chart.js, D3.js, Apache ECharts, MUI X Charts; Python: Altair, Bokeh, lets-plot, Matplotlib, Plotly, plotnine, Pygal, Seaborn; R: ggplot2; Julia: Makie.jl. Compare all 15 side by side: Genome Track Viewer in Python, R, Julia and JavaScript.
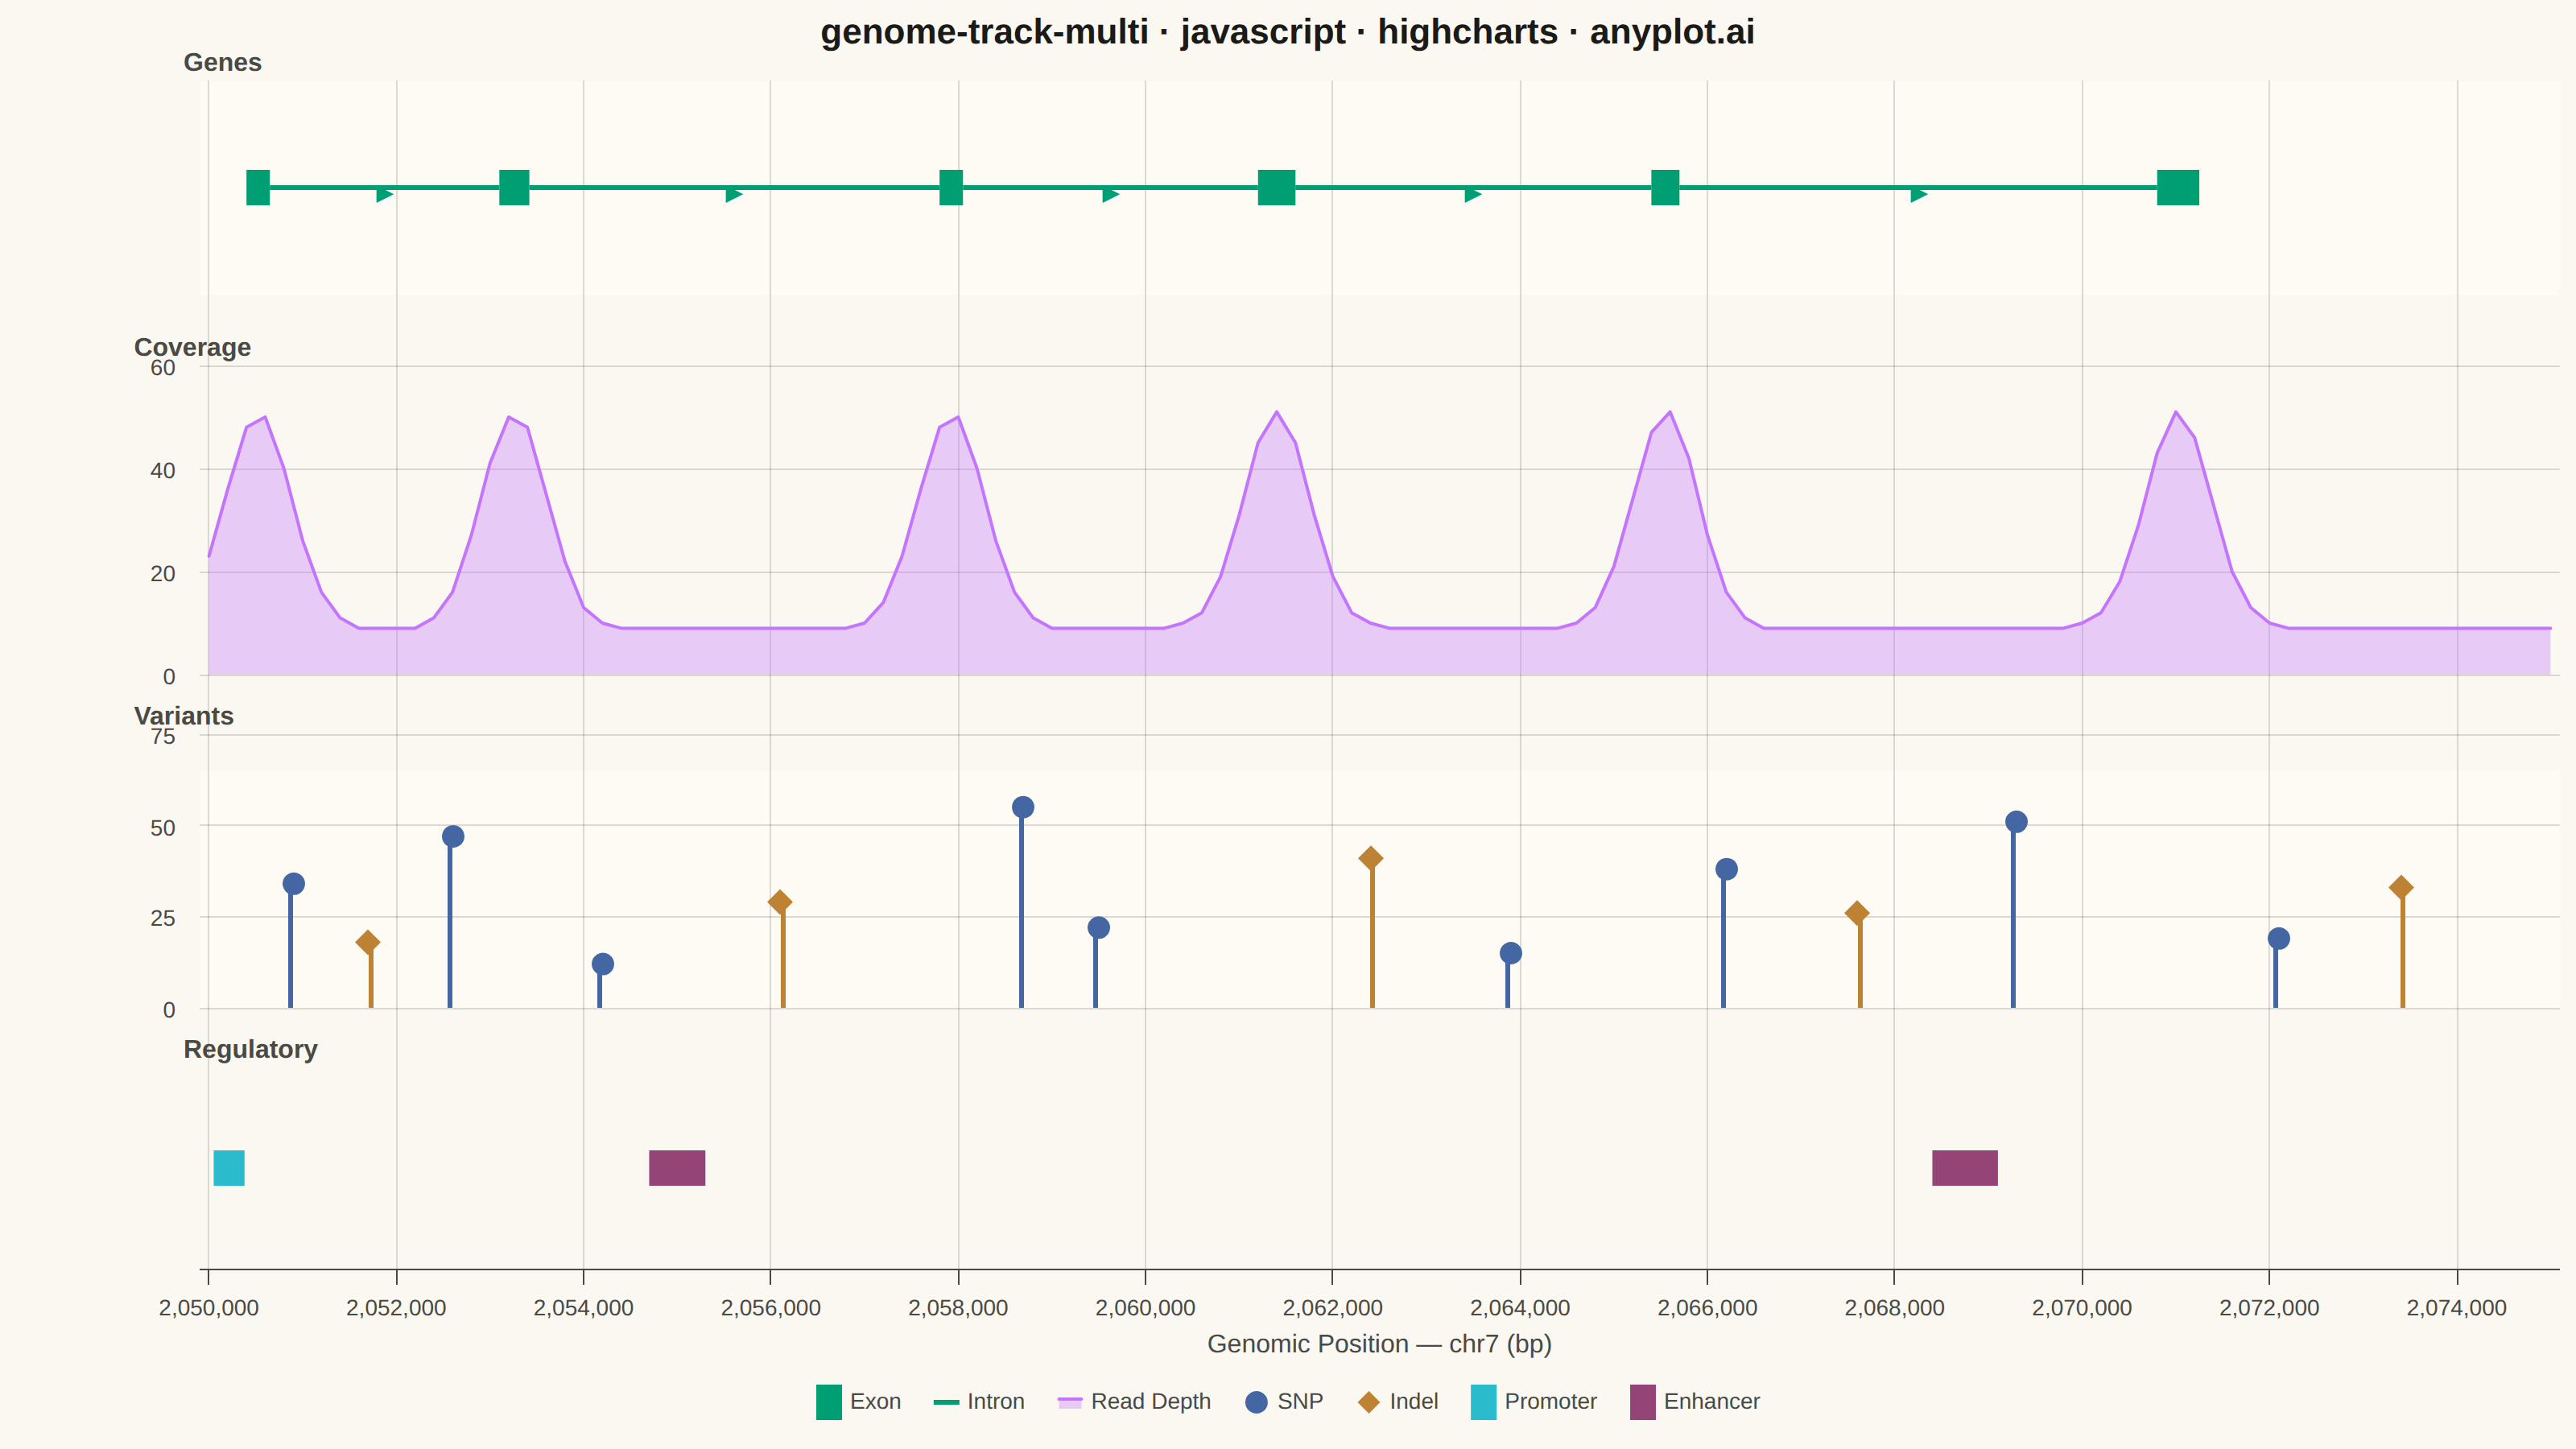
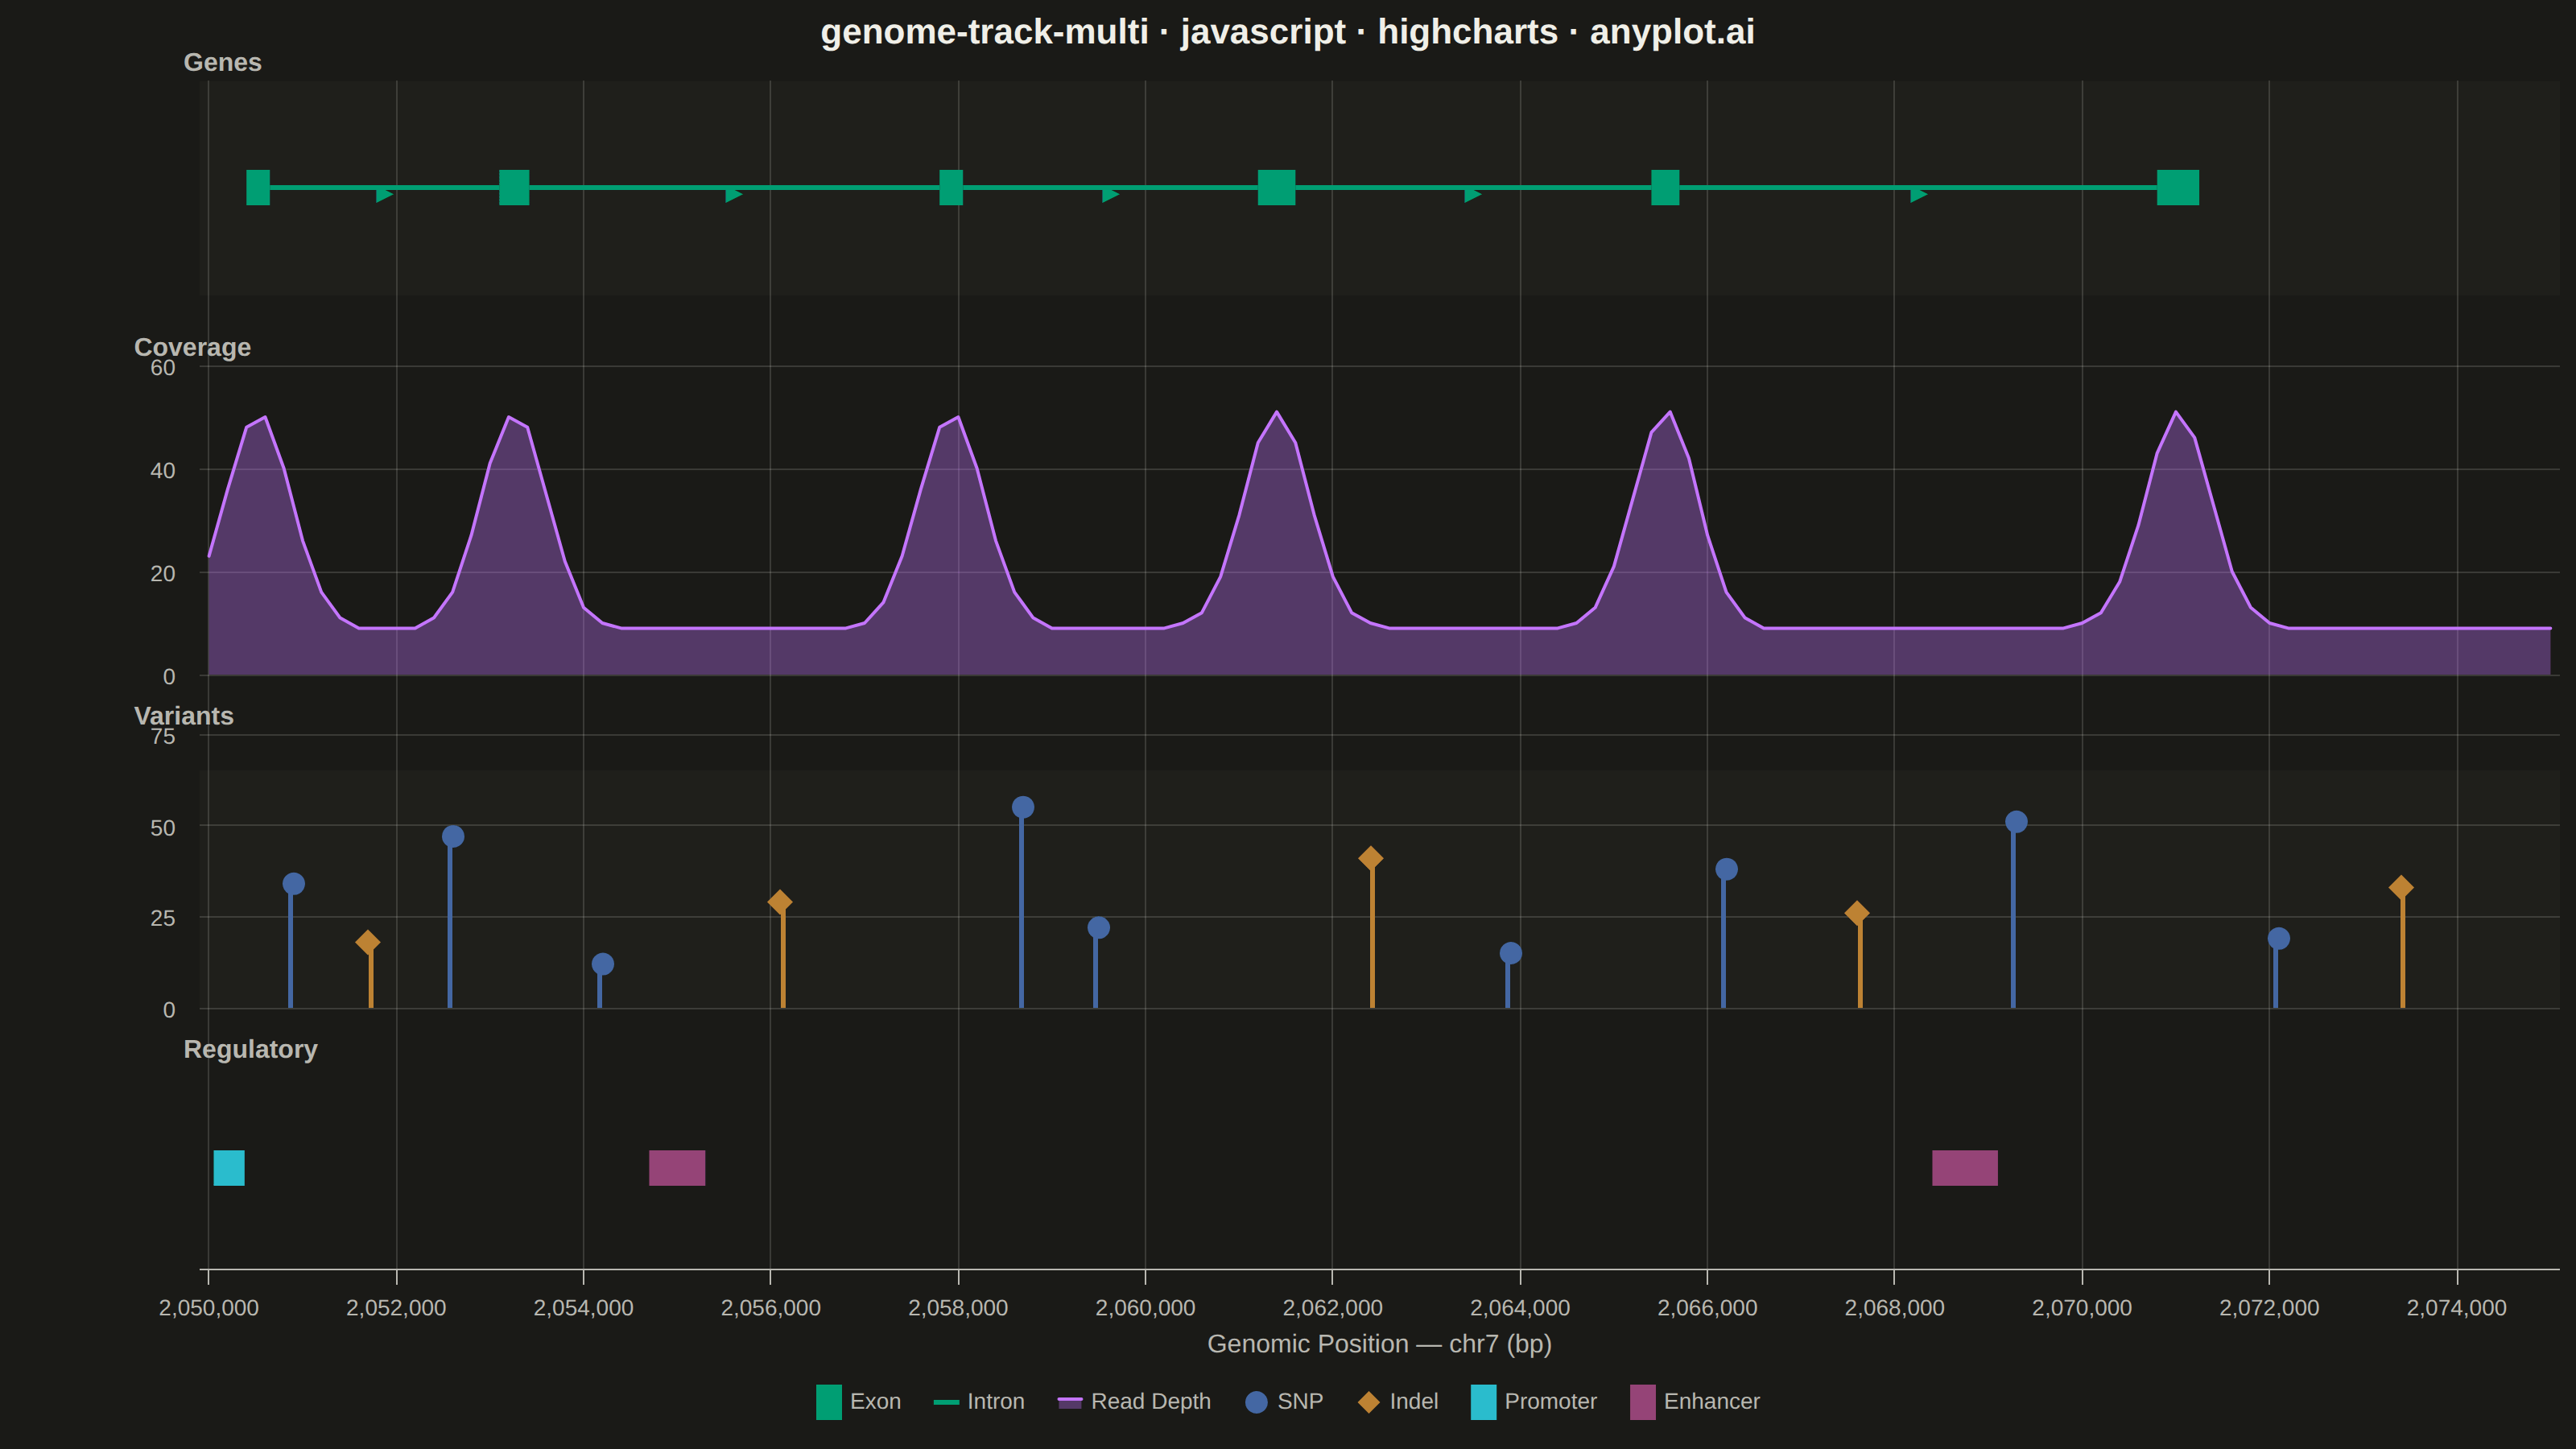
A multi-track genome browser view that displays different types of genomic data aligned along a shared chromosomal coordinate axis. Multiple parallel horizontal tracks (gene annotations, read coverage, variants, regulatory elements) are stacked vertically, each showing a different data type at the same genomic locus. This visualization is essential for integrative genomics, enabling researchers to explore relationships between gene structure, expression, variation, and regulation in a single coordinated view.
// anyplot.ai
// genome-track-multi: Genome Track Viewer
// Library: highcharts 12.6.0 | JavaScript 22.23.2
// Quality: 92/100 | Created: 2026-08-25
//# anyplot-orientation: landscape

const t = window.ANYPLOT_TOKENS;

// --- Data: chr7:2,050,000-2,075,000 (25 kb window), fictional ZNF-142 locus --

const REGION_START = 2050000;
const REGION_END = 2075000;
const GENE_STRAND = "+";
const GENE_Y = 1;
const strandArrow = GENE_STRAND === "+" ? "▶" : "◀";

// Gene model — 6 exons separated by 5 introns
const exons = [
  [2050400, 2050650],
  [2053100, 2053420],
  [2057800, 2058050],
  [2061200, 2061600],
  [2065400, 2065700],
  [2070800, 2071250],
];
const introns = exons.slice(0, -1).map((exon, i) => [exon[1], exons[i + 1][0]]);

// Coverage — read depth sampled every 200bp, higher over exons
function gaussianBump(x, center, sigma, amplitude) {
  return amplitude * Math.exp(-((x - center) ** 2) / (2 * sigma ** 2));
}
const coverage = [];
for (let x = REGION_START; x <= REGION_END; x += 200) {
  let depth = 9;
  exons.forEach(([s, e]) => {
    depth += gaussianBump(x, (s + e) / 2, 350, 42);
  });
  coverage.push([x, Math.round(depth)]);
}

// Variants — SNPs and indels with a Phred-like quality score (0-60)
const variants = [
  { pos: 2050900, quality: 34, type: "SNP" },
  { pos: 2051700, quality: 18, type: "indel" },
  { pos: 2052600, quality: 47, type: "SNP" },
  { pos: 2054200, quality: 12, type: "SNP" },
  { pos: 2056100, quality: 29, type: "indel" },
  { pos: 2058700, quality: 55, type: "SNP" },
  { pos: 2059500, quality: 22, type: "SNP" },
  { pos: 2062400, quality: 41, type: "indel" },
  { pos: 2063900, quality: 15, type: "SNP" },
  { pos: 2066200, quality: 38, type: "SNP" },
  { pos: 2067600, quality: 26, type: "indel" },
  { pos: 2069300, quality: 51, type: "SNP" },
  { pos: 2072100, quality: 19, type: "SNP" },
  { pos: 2073400, quality: 33, type: "indel" },
];
const snpPoints = variants.filter((v) => v.type === "SNP").map((v) => [v.pos, v.quality]);
const indelPoints = variants.filter((v) => v.type === "indel").map((v) => [v.pos, v.quality]);

// Regulatory elements
const regulatory = [
  { start: 2050050, end: 2050380, kind: "promoter" },
  { start: 2054700, end: 2055300, kind: "enhancer" },
  { start: 2068400, end: 2069100, kind: "enhancer" },
];

// --- Track layout: 4 stacked panes sharing one x-axis -----------------------

const shading = Highcharts.color(t.elevatedBg).setOpacity(0.5).get();
const trackTitleStyle = { color: t.inkSoft, fontSize: "16px", fontWeight: "600" };

function trackAxis(title, top, height, extra) {
  return Object.assign(
    {
      title: { text: title, align: "high", rotation: 0, textAlign: "left", x: 0, y: -6, style: trackTitleStyle },
      top,
      height,
      offset: 0,
      lineWidth: 0,
      tickLength: 0,
      gridLineColor: t.grid,
      labels: { style: { color: t.inkSoft, fontSize: "14px" } },
    },
    extra
  );
}

const yAxis = [
  trackAxis("Genes", "0%", "18%", {
    min: 0,
    max: 2,
    gridLineWidth: 0,
    labels: { enabled: false },
    plotBands: [{ from: 0, to: 2, color: shading }],
  }),
  trackAxis("Coverage", "24%", "26%", { min: 0, max: 60, gridLineWidth: 1 }),
  trackAxis("Variants", "55%", "23%", {
    min: 0,
    max: 65,
    gridLineWidth: 1,
    plotBands: [{ from: 0, to: 65, color: shading }],
  }),
  trackAxis("Regulatory", "83%", "17%", { min: 0, max: 2, gridLineWidth: 0, labels: { enabled: false } }),
];

// --- Series ------------------------------------------------------------

const series = [];

// Gene track: thick segments = exons, thin segments = introns, arrows = strand
exons.forEach(([s, e], i) => {
  series.push({
    type: "line",
    yAxis: 0,
    data: [
      [s, GENE_Y],
      [e, GENE_Y],
    ],
    color: t.palette[0],
    lineWidth: 22,
    linecap: "square",
    marker: { enabled: false },
    enableMouseTracking: false,
    name: "Exon",
    showInLegend: i === 0,
  });
});
introns.forEach(([s, e], i) => {
  series.push({
    type: "line",
    yAxis: 0,
    data: [
      [s, GENE_Y],
      [e, GENE_Y],
    ],
    color: t.palette[0],
    lineWidth: 3,
    linecap: "square",
    marker: { enabled: false },
    enableMouseTracking: false,
    name: "Intron",
    showInLegend: i === 0,
  });
});
series.push({
  type: "scatter",
  yAxis: 0,
  data: introns.map(([s, e]) => ({ x: (s + e) / 2, y: GENE_Y })),
  marker: { enabled: false },
  enableMouseTracking: false,
  showInLegend: false,
  dataLabels: {
    enabled: true,
    format: strandArrow,
    allowOverlap: true,
    verticalAlign: "middle",
    y: 1,
    style: { color: t.palette[0], fontSize: "13px", fontWeight: "700", textOutline: "none" },
  },
});

// Coverage track: filled area of read depth
series.push({
  type: "area",
  yAxis: 1,
  name: "Read Depth",
  data: coverage,
  color: t.palette[1],
  fillOpacity: 0.35,
  lineWidth: 2,
  marker: { enabled: false },
  threshold: 0,
  showInLegend: true,
});

// Variant track: lollipops (thin stem + marker head), quality encodes height
series.push({
  type: "column",
  yAxis: 2,
  data: snpPoints,
  color: t.palette[2],
  pointWidth: 3,
  borderWidth: 0,
  enableMouseTracking: false,
  showInLegend: false,
});
series.push({
  type: "scatter",
  yAxis: 2,
  name: "SNP",
  data: snpPoints,
  color: t.palette[2],
  marker: { symbol: "circle", radius: 7, lineWidth: 0 },
  showInLegend: true,
});
series.push({
  type: "column",
  yAxis: 2,
  data: indelPoints,
  color: t.palette[3],
  pointWidth: 3,
  borderWidth: 0,
  enableMouseTracking: false,
  showInLegend: false,
});
series.push({
  type: "scatter",
  yAxis: 2,
  name: "Indel",
  data: indelPoints,
  color: t.palette[3],
  marker: { symbol: "diamond", radius: 8, lineWidth: 0 },
  showInLegend: true,
});

// Regulatory track: colored rectangles per element kind
const regColors = { promoter: t.palette[5], enhancer: t.palette[6] };
const regSeen = new Set();
regulatory.forEach((r) => {
  const first = !regSeen.has(r.kind);
  regSeen.add(r.kind);
  series.push({
    type: "line",
    yAxis: 3,
    data: [
      [r.start, GENE_Y],
      [r.end, GENE_Y],
    ],
    color: regColors[r.kind],
    lineWidth: 22,
    linecap: "square",
    marker: { enabled: false },
    enableMouseTracking: false,
    name: r.kind === "promoter" ? "Promoter" : "Enhancer",
    showInLegend: first,
  });
});

// --- Chart ---------------------------------------------------------------

Highcharts.chart("container", {
  chart: { type: "line", backgroundColor: "transparent", animation: false, style: { fontFamily: "inherit" } },
  credits: { enabled: false },
  colors: t.palette,
  title: {
    text: "genome-track-multi · javascript · highcharts · anyplot.ai",
    style: { color: t.ink, fontSize: "22px", fontWeight: "600" },
  },
  xAxis: {
    min: REGION_START,
    max: REGION_END,
    title: { text: "Genomic Position — chr7 (bp)", style: { color: t.inkSoft, fontSize: "16px" } },
    lineColor: t.inkSoft,
    tickColor: t.inkSoft,
    gridLineColor: t.grid,
    gridLineWidth: 1,
    labels: {
      style: { color: t.inkSoft, fontSize: "14px" },
      formatter() {
        return Highcharts.numberFormat(this.value, 0, ".", ",");
      },
    },
  },
  yAxis,
  legend: {
    itemStyle: { color: t.inkSoft, fontSize: "14px" },
    itemHoverStyle: { color: t.ink },
  },
  tooltip: {
    formatter() {
      const pos = Highcharts.numberFormat(this.x, 0, ".", ",");
      if (this.series.type === "line") return `<b>${this.series.name}</b><br/>pos ${pos}`;
      return `<b>${this.series.name}</b><br/>pos ${pos}<br/>value ${this.y}`;
    },
  },
  plotOptions: {
    series: { animation: false, states: { hover: { enabled: true } } },
  },
  series,
});
Runnable source as JSON, for any HTTP client: https://api.anyplot.ai/specs/genome-track-multi/highcharts/code. Any spec id and library id listed in llms-full.txt fit the same URL shape; every URL below is complete and callable.
{
  "spec_id": "genome-track-multi",
  "language": "javascript",
  "library": "highcharts",
  "page": "https://anyplot.ai/genome-track-multi/javascript/highcharts",
  "hub": "https://anyplot.ai/genome-track-multi",
  "code_json": "https://api.anyplot.ai/specs/genome-track-multi/highcharts/code",
  "spec_json": "https://api.anyplot.ai/specs/genome-track-multi",
  "render_light_png": "https://storage.googleapis.com/anyplot-images/plots/genome-track-multi/javascript/highcharts/plot-light.png",
  "render_dark_png": "https://storage.googleapis.com/anyplot-images/plots/genome-track-multi/javascript/highcharts/plot-dark.png",
  "interactive_light_html": "https://storage.googleapis.com/anyplot-images/plots/genome-track-multi/javascript/highcharts/plot-light.html",
  "interactive_dark_html": "https://storage.googleapis.com/anyplot-images/plots/genome-track-multi/javascript/highcharts/plot-dark.html",
  "quality_score": 92.0,
  "license": "MIT",
  "guide": "https://anyplot.ai/llms.txt"
}
Part of Genome Track Viewer on anyplot.ai.