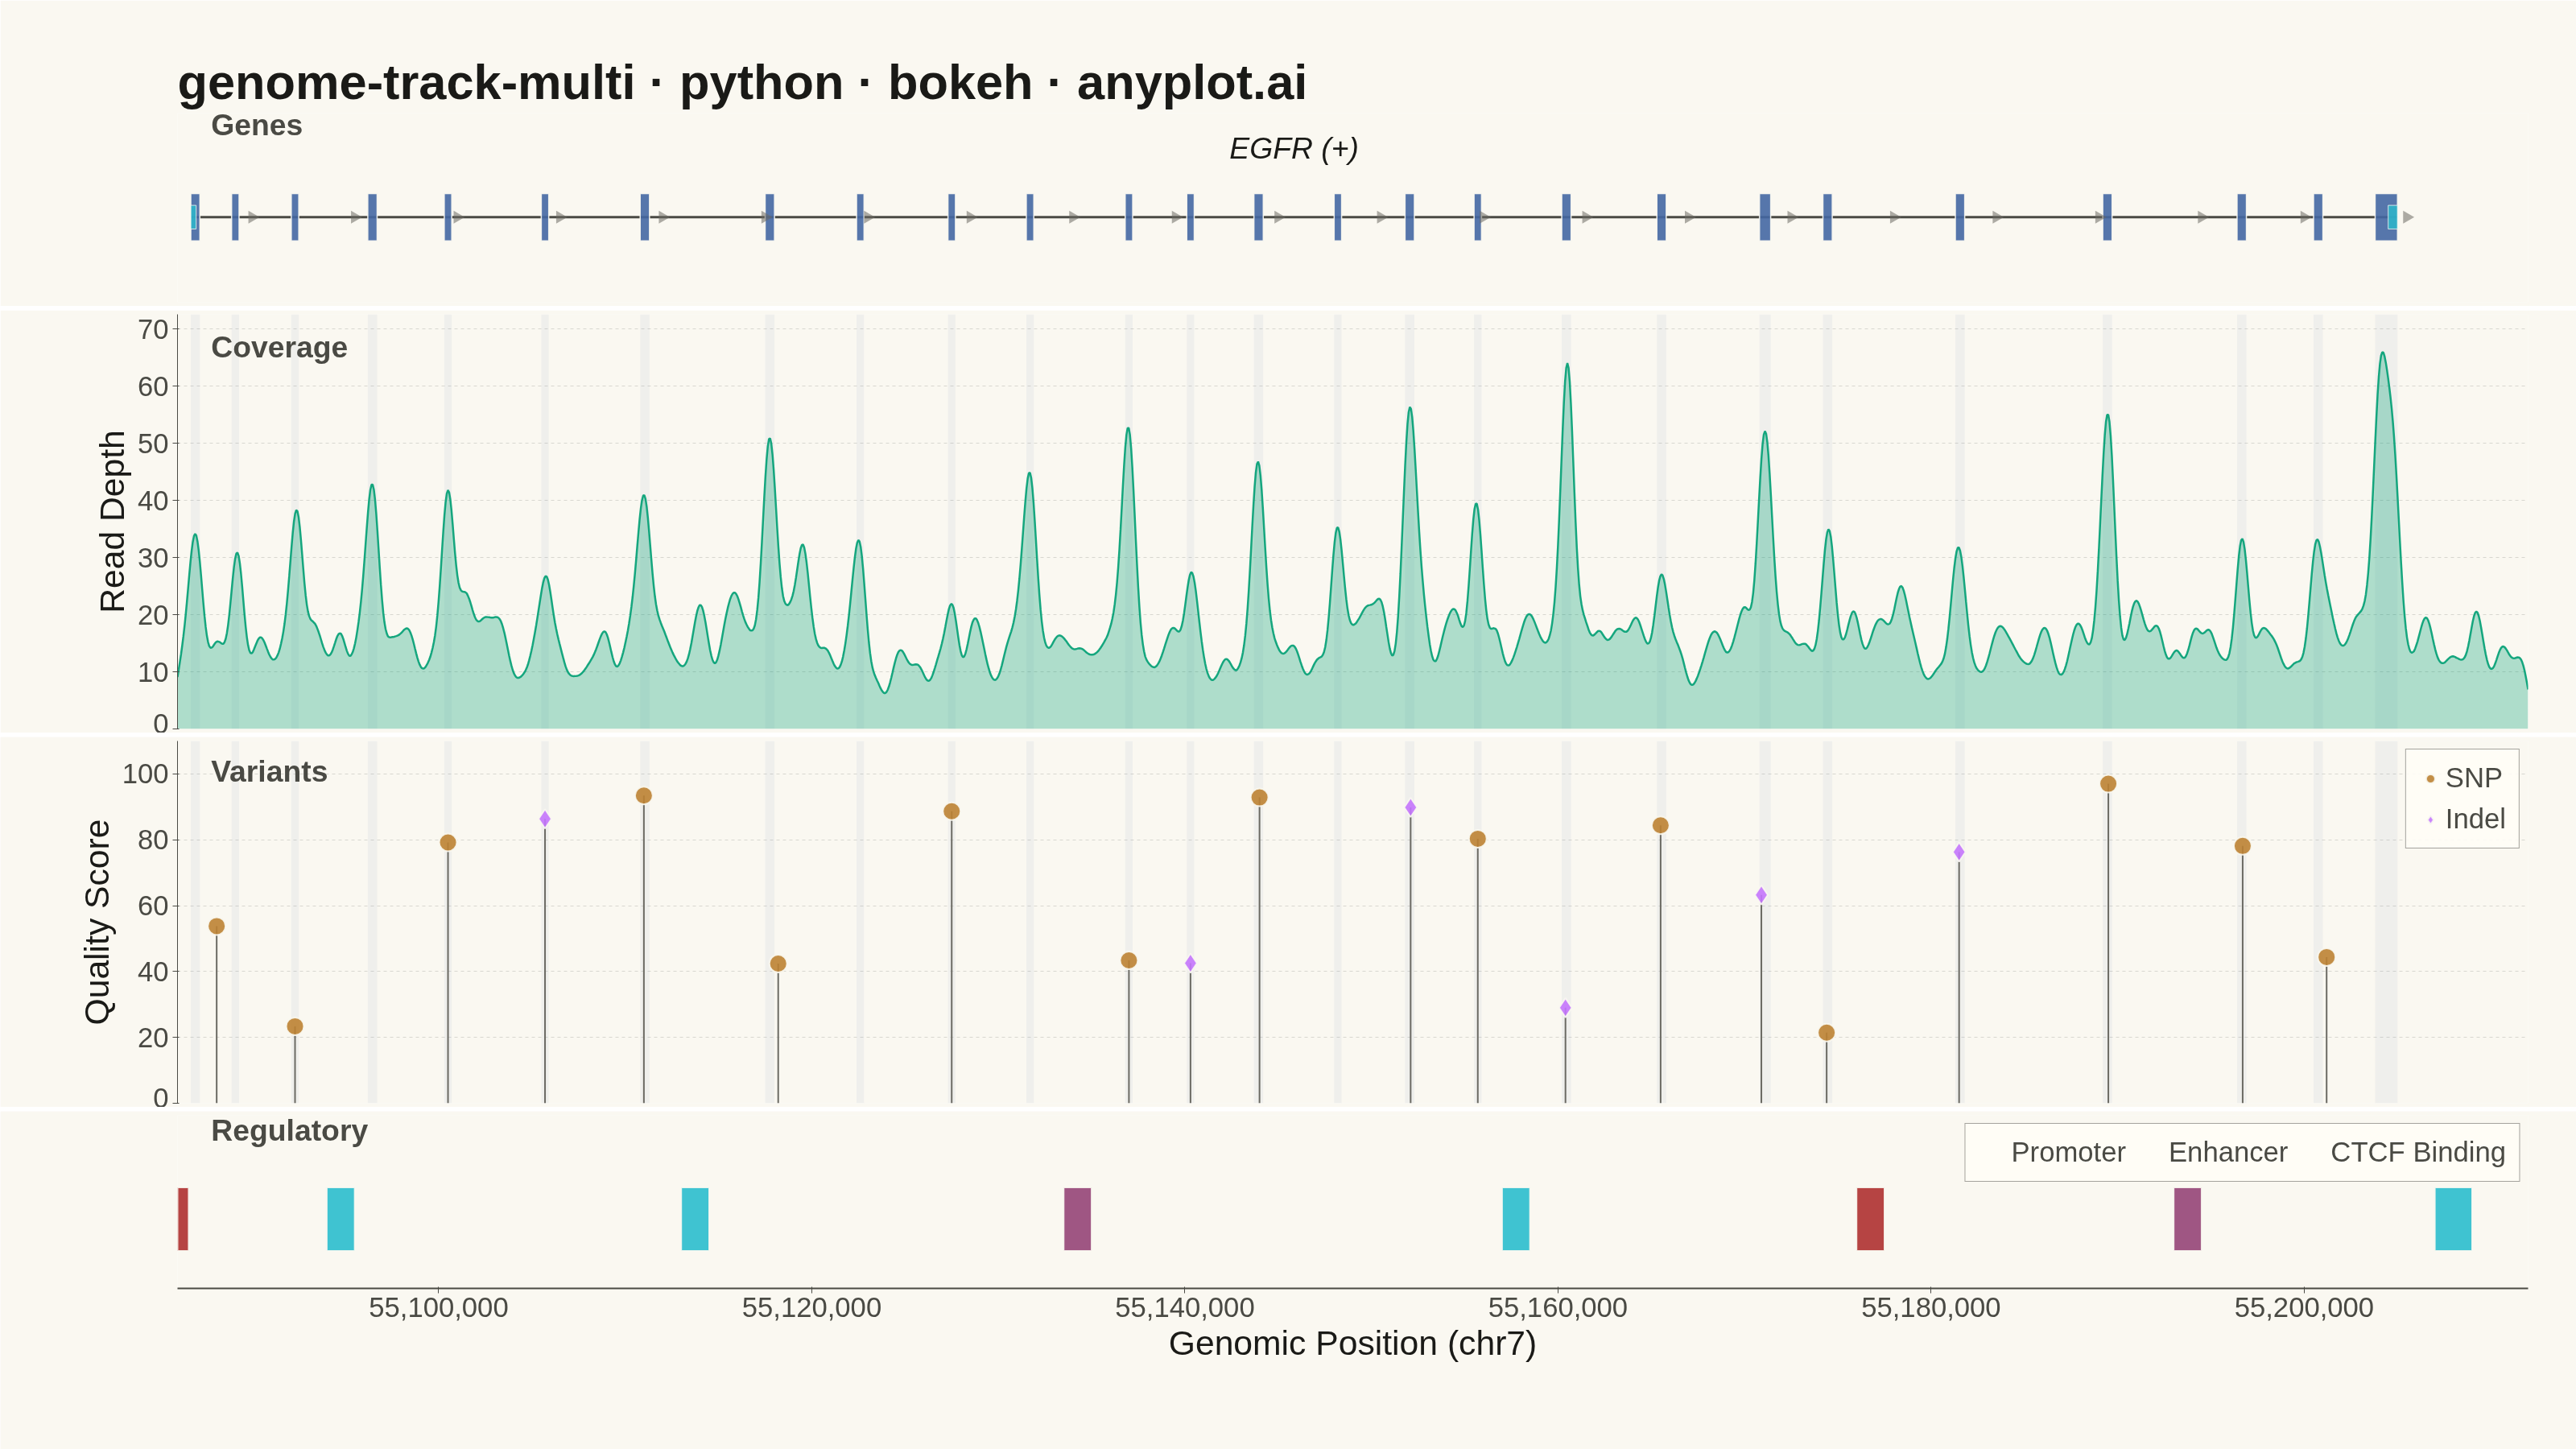
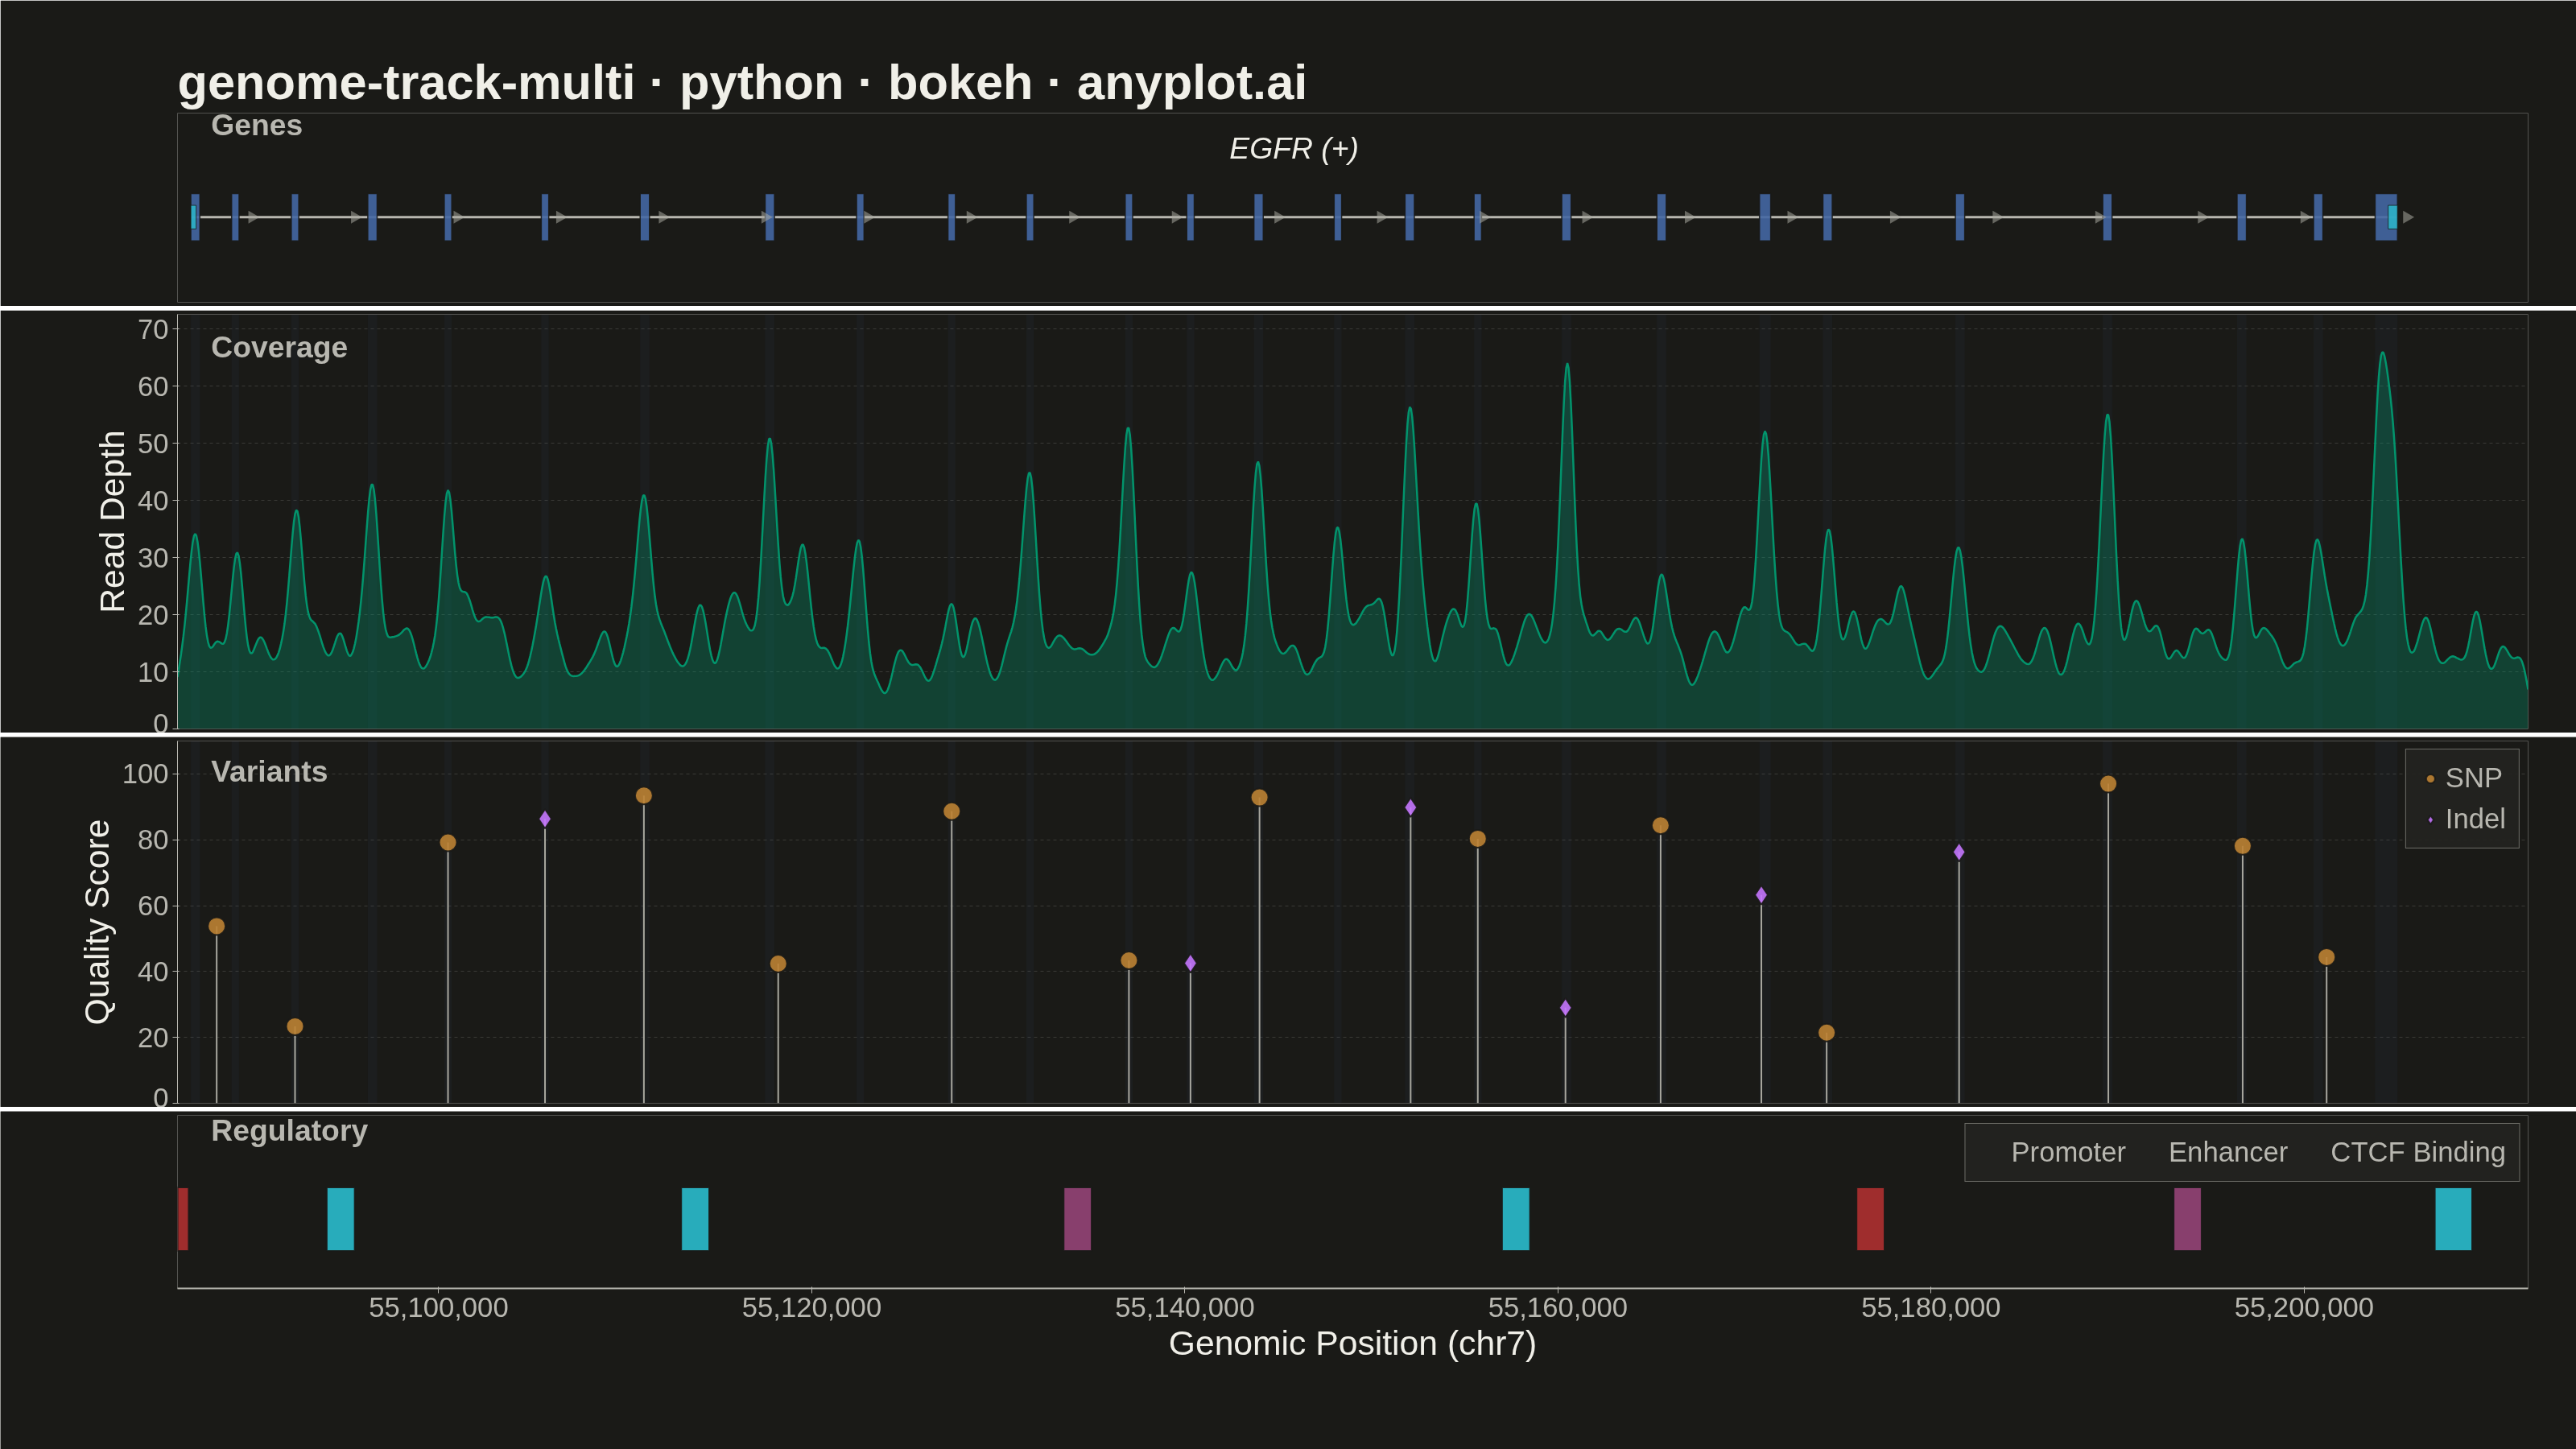
A multi-track genome browser view that displays different types of genomic data aligned along a shared chromosomal coordinate axis. Multiple parallel horizontal tracks (gene annotations, read coverage, variants, regulatory elements) are stacked vertically, each showing a different data type at the same genomic locus. This visualization is essential for integrative genomics, enabling researchers to explore relationships between gene structure, expression, variation, and regulation in a single coordinated view.
""" anyplot.ai
genome-track-multi: Genome Track Viewer
Library: bokeh 3.9.0 | Python 3.13.13
Quality: 92/100 | Updated: 2026-06-02
"""

import os
import sys
import time
from pathlib import Path


# Remove script's own directory from sys.path so 'bokeh' resolves to the installed package
_this_dir = os.path.dirname(os.path.abspath(__file__))
if _this_dir in sys.path:
    sys.path.remove(_this_dir)

import numpy as np
from bokeh.io import output_file, save
from bokeh.layouts import column
from bokeh.models import ColumnDataSource, HoverTool, Label, NumeralTickFormatter, Range1d
from bokeh.plotting import figure
from selenium import webdriver
from selenium.webdriver.chrome.options import Options


THEME = os.getenv("ANYPLOT_THEME", "light")

# Theme-adaptive chrome tokens (Imprint palette)
PAGE_BG = "#FAF8F1" if THEME == "light" else "#1A1A17"
ELEVATED_BG = "#FFFDF6" if THEME == "light" else "#242420"
INK = "#1A1A17" if THEME == "light" else "#F0EFE8"
INK_SOFT = "#4A4A44" if THEME == "light" else "#B8B7B0"
INK_MUTED = "#6B6A63" if THEME == "light" else "#A8A79F"

# Imprint categorical palette (canonical order)
IMPRINT = ["#009E73", "#C475FD", "#4467A3", "#BD8233", "#AE3030", "#2ABCCD", "#954477", "#99B314"]

# Data-series color assignments (Imprint palette — semantic roles)
COLOR_COVERAGE = IMPRINT[0]  # #009E73 brand green — primary data series (coverage)
COLOR_EXON = IMPRINT[2]  # #4467A3 blue — coding exon blocks
COLOR_UTR = IMPRINT[5]  # #2ABCCD cyan — UTR sub-features
COLOR_SNP = IMPRINT[3]  # #BD8233 ochre — SNP variants
COLOR_INDEL = IMPRINT[1]  # #C475FD lavender — Indel variants
COLOR_PROMOTER = IMPRINT[4]  # #AE3030 red — promoter (activating regulatory)
COLOR_ENHANCER = IMPRINT[5]  # #2ABCCD cyan — enhancers
COLOR_CTCF = IMPRINT[6]  # #954477 rose — CTCF binding sites

np.random.seed(42)

chrom = "chr7"
region_start = 55_086_000
region_end = 55_212_000

# --- Gene Track Data ---
genes = [{"name": "EGFR", "strand": "+", "tx_start": 55_086_714, "tx_end": 55_205_000}]
exons = [
    (55_086_714, 55_087_200),
    (55_088_900, 55_089_300),
    (55_092_100, 55_092_500),
    (55_096_200, 55_096_700),
    (55_100_300, 55_100_700),
    (55_105_500, 55_105_900),
    (55_110_800, 55_111_300),
    (55_117_500, 55_118_000),
    (55_122_400, 55_122_800),
    (55_127_300, 55_127_700),
    (55_131_500, 55_131_900),
    (55_136_800, 55_137_200),
    (55_140_100, 55_140_500),
    (55_143_700, 55_144_200),
    (55_148_000, 55_148_400),
    (55_151_800, 55_152_300),
    (55_155_500, 55_155_900),
    (55_160_200, 55_160_700),
    (55_165_300, 55_165_800),
    (55_170_800, 55_171_400),
    (55_174_200, 55_174_700),
    (55_181_300, 55_181_800),
    (55_189_200, 55_189_700),
    (55_196_400, 55_196_900),
    (55_200_500, 55_201_000),
    (55_203_800, 55_205_000),
]
utrs_5 = [(55_086_714, 55_087_000)]
utrs_3 = [(55_204_500, 55_205_000)]

# --- Coverage Track Data ---
positions = np.linspace(region_start, region_end, 2000)
base_coverage = np.random.exponential(15, 2000)
for ex_start, ex_end in exons:
    mask = (positions >= ex_start) & (positions <= ex_end)
    base_coverage[mask] += np.random.exponential(45, mask.sum())
kernel = np.exp(-0.5 * np.linspace(-3, 3, 31) ** 2)
kernel /= kernel.sum()
coverage = np.clip(np.convolve(base_coverage, kernel, mode="same"), 0, None)
cov_max = float(coverage.max()) * 1.1

# --- Variant Track Data ---
variant_positions = [
    55_088_100,
    55_092_300,
    55_100_500,
    55_111_000,
    55_118_200,
    55_127_500,
    55_137_000,
    55_144_000,
    55_155_700,
    55_165_500,
    55_174_400,
    55_189_500,
    55_196_700,
    55_201_200,
    55_105_700,
    55_140_300,
    55_152_100,
    55_160_400,
    55_181_500,
    55_170_900,
]
variant_types = ["SNP"] * 14 + ["Indel"] * 6
variant_quality = np.random.uniform(20, 100, len(variant_positions))
var_max = 110.0

# --- Regulatory Track Data ---
reg_elements = [
    {"start": 55_086_000, "end": 55_086_600, "type": "Promoter"},
    {"start": 55_094_000, "end": 55_095_500, "type": "Enhancer"},
    {"start": 55_113_000, "end": 55_114_500, "type": "Enhancer"},
    {"start": 55_133_500, "end": 55_135_000, "type": "CTCF Binding"},
    {"start": 55_157_000, "end": 55_158_500, "type": "Enhancer"},
    {"start": 55_176_000, "end": 55_177_500, "type": "Promoter"},
    {"start": 55_193_000, "end": 55_194_500, "type": "CTCF Binding"},
    {"start": 55_207_000, "end": 55_209_000, "type": "Enhancer"},
]
reg_color_map = {"Promoter": COLOR_PROMOTER, "Enhancer": COLOR_ENHANCER, "CTCF Binding": COLOR_CTCF}

shared_x_range = Range1d(start=region_start, end=region_end)
W = 3200
BL = 220  # min_border_left — room for y-axis label + tick labels at 32pt+26pt
BR = 60  # min_border_right

# ============================================================
# Track 1: Gene Annotations (top — carries the chart title)
# ============================================================
p_gene = figure(
    width=W,
    height=380,
    x_range=shared_x_range,
    y_range=Range1d(-1.8, 2.2),
    title="genome-track-multi · python · bokeh · anyplot.ai",
    tools="",
    toolbar_location=None,
    min_border_top=140,
    min_border_bottom=5,
    min_border_left=BL,
    min_border_right=BR,
)

# Intron backbone
p_gene.segment(x0=[genes[0]["tx_start"]], y0=[0], x1=[genes[0]["tx_end"]], y1=[0], line_color=INK_SOFT, line_width=3)

# Exon blocks
exon_src = ColumnDataSource(
    data={
        "left": [e[0] for e in exons],
        "right": [e[1] for e in exons],
        "top": [0.5] * len(exons),
        "bottom": [-0.5] * len(exons),
    }
)
p_gene.quad(
    left="left",
    right="right",
    top="top",
    bottom="bottom",
    source=exon_src,
    fill_color=COLOR_EXON,
    line_color=PAGE_BG,
    line_width=1.5,
    alpha=0.9,
)

# UTR blocks (thinner)
for utr_s, utr_e in utrs_5 + utrs_3:
    p_gene.quad(
        left=[utr_s],
        right=[utr_e],
        top=[0.25],
        bottom=[-0.25],
        fill_color=COLOR_UTR,
        line_color=PAGE_BG,
        line_width=1,
        alpha=0.8,
    )

# Strand direction indicators
for pos in np.arange(region_start + 4000, region_end - 4000, 5500):
    p_gene.scatter(
        x=[pos], y=[0], size=16, angle=-np.pi / 2, marker="triangle", fill_color=INK_MUTED, line_color=None, alpha=0.55
    )

# Gene label
p_gene.text(
    x=[(genes[0]["tx_start"] + genes[0]["tx_end"]) / 2],
    y=[1.1],
    text=["EGFR (+)"],
    text_font_size="28pt",
    text_align="center",
    text_color=INK,
    text_font_style="italic",
)
p_gene.add_layout(
    Label(
        x=region_start + 1800, y=1.6, text="Genes", text_font_size="28pt", text_color=INK_SOFT, text_font_style="bold"
    )
)

p_gene.title.text_font_size = "46pt"
p_gene.title.text_color = INK
p_gene.xaxis.visible = False
p_gene.yaxis.visible = False
p_gene.xgrid.grid_line_color = None
p_gene.ygrid.grid_line_color = None
p_gene.background_fill_color = PAGE_BG
p_gene.border_fill_color = PAGE_BG
p_gene.outline_line_color = None

# ============================================================
# Track 2: Read Coverage
# ============================================================
p_cov = figure(
    width=W,
    height=525,
    x_range=shared_x_range,
    y_range=Range1d(0, cov_max),
    tools="",
    toolbar_location=None,
    min_border_top=5,
    min_border_bottom=5,
    min_border_left=BL,
    min_border_right=BR,
)

# Subtle exon position shading — visually ties coverage peaks to gene structure
for ex_start, ex_end in exons:
    p_cov.quad(
        left=[ex_start],
        right=[ex_end],
        top=[cov_max],
        bottom=[0],
        fill_color=COLOR_EXON,
        fill_alpha=0.06,
        line_color=None,
    )

cov_src = ColumnDataSource(
    data={
        "x": positions,
        "y": coverage,
        "pos_fmt": [f"{int(p):,}" for p in positions],
        "depth_fmt": [f"{d:.1f}" for d in coverage],
    }
)
p_cov.varea(x="x", y1=0, y2="y", source=cov_src, fill_color=COLOR_COVERAGE, fill_alpha=0.30)
p_cov.line(x="x", y="y", source=cov_src, line_color=COLOR_COVERAGE, line_width=2.5, alpha=0.9)

p_cov.add_tools(HoverTool(tooltips=[("Position", "@pos_fmt"), ("Depth", "@depth_fmt×")], mode="vline"))
p_cov.add_layout(
    Label(
        x=region_start + 1800,
        y=cov_max * 0.88,
        text="Coverage",
        text_font_size="28pt",
        text_color=INK_SOFT,
        text_font_style="bold",
    )
)

p_cov.xaxis.visible = False
p_cov.yaxis.axis_label = "Read Depth"
p_cov.yaxis.axis_label_text_font_size = "32pt"
p_cov.yaxis.axis_label_text_font_style = "normal"
p_cov.yaxis.axis_label_text_color = INK
p_cov.yaxis.major_label_text_font_size = "26pt"
p_cov.yaxis.major_label_text_color = INK_SOFT
p_cov.yaxis.axis_line_color = INK_SOFT
p_cov.yaxis.minor_tick_line_color = None
p_cov.yaxis.major_tick_line_color = INK_SOFT
p_cov.xgrid.grid_line_color = None
p_cov.ygrid.grid_line_color = INK
p_cov.ygrid.grid_line_alpha = 0.15
p_cov.ygrid.grid_line_dash = [4, 4]
p_cov.background_fill_color = PAGE_BG
p_cov.border_fill_color = PAGE_BG
p_cov.outline_line_color = None

# ============================================================
# Track 3: Variants (lollipop markers)
# ============================================================
p_var = figure(
    width=W,
    height=460,
    x_range=shared_x_range,
    y_range=Range1d(0, var_max),
    tools="",
    toolbar_location=None,
    min_border_top=5,
    min_border_bottom=5,
    min_border_left=BL,
    min_border_right=BR,
)

# Subtle exon position shading — visually ties variants to gene structure
for ex_start, ex_end in exons:
    p_var.quad(
        left=[ex_start],
        right=[ex_end],
        top=[var_max],
        bottom=[0],
        fill_color=COLOR_EXON,
        fill_alpha=0.06,
        line_color=None,
    )

# Lollipop stems
for i, vp in enumerate(variant_positions):
    p_var.segment(x0=[vp], y0=[0], x1=[vp], y1=[variant_quality[i]], line_color=INK_MUTED, line_width=2)

snp_idx = [i for i, t in enumerate(variant_types) if t == "SNP"]
snp_src = ColumnDataSource(
    data={
        "x": [variant_positions[i] for i in snp_idx],
        "y": [variant_quality[i] for i in snp_idx],
        "pos_fmt": [f"{variant_positions[i]:,}" for i in snp_idx],
        "qual_fmt": [f"{variant_quality[i]:.1f}" for i in snp_idx],
        "type": ["SNP"] * len(snp_idx),
    }
)
p_var.scatter(
    x="x",
    y="y",
    source=snp_src,
    size=22,
    color=COLOR_SNP,
    alpha=0.9,
    line_color=PAGE_BG,
    line_width=2,
    legend_label="SNP",
)

indel_idx = [i for i, t in enumerate(variant_types) if t == "Indel"]
indel_src = ColumnDataSource(
    data={
        "x": [variant_positions[i] for i in indel_idx],
        "y": [variant_quality[i] for i in indel_idx],
        "pos_fmt": [f"{variant_positions[i]:,}" for i in indel_idx],
        "qual_fmt": [f"{variant_quality[i]:.1f}" for i in indel_idx],
        "type": ["Indel"] * len(indel_idx),
    }
)
p_var.scatter(
    x="x",
    y="y",
    source=indel_src,
    size=24,
    color=COLOR_INDEL,
    marker="diamond",
    alpha=0.9,
    line_color=PAGE_BG,
    line_width=2,
    legend_label="Indel",
)

p_var.add_tools(HoverTool(tooltips=[("Type", "@type"), ("Position", "@pos_fmt"), ("Quality", "@qual_fmt")]))
p_var.add_layout(
    Label(
        x=region_start + 1800,
        y=var_max * 0.87,
        text="Variants",
        text_font_size="28pt",
        text_color=INK_SOFT,
        text_font_style="bold",
    )
)

p_var.xaxis.visible = False
p_var.yaxis.axis_label = "Quality Score"
p_var.yaxis.axis_label_text_font_size = "32pt"
p_var.yaxis.axis_label_text_font_style = "normal"
p_var.yaxis.axis_label_text_color = INK
p_var.yaxis.major_label_text_font_size = "26pt"
p_var.yaxis.major_label_text_color = INK_SOFT
p_var.yaxis.axis_line_color = INK_SOFT
p_var.yaxis.minor_tick_line_color = None
p_var.yaxis.major_tick_line_color = INK_SOFT
p_var.xgrid.grid_line_color = None
p_var.ygrid.grid_line_color = INK
p_var.ygrid.grid_line_alpha = 0.15
p_var.ygrid.grid_line_dash = [4, 4]
p_var.background_fill_color = PAGE_BG
p_var.border_fill_color = PAGE_BG
p_var.outline_line_color = None
p_var.legend.label_text_font_size = "26pt"
p_var.legend.label_text_color = INK_SOFT
p_var.legend.glyph_height = 28
p_var.legend.glyph_width = 28
p_var.legend.spacing = 12
p_var.legend.padding = 16
p_var.legend.background_fill_alpha = 0.9
p_var.legend.background_fill_color = ELEVATED_BG
p_var.legend.border_line_color = INK_SOFT
p_var.legend.location = "top_right"

# ============================================================
# Track 4: Regulatory Elements (bottom — has x-axis labels)
# ============================================================
p_reg = figure(
    width=W,
    height=420,
    x_range=shared_x_range,
    y_range=Range1d(-1.2, 1.8),
    tools="",
    toolbar_location=None,
    min_border_top=5,
    min_border_bottom=200,
    min_border_left=BL,
    min_border_right=BR,
)

reg_src = ColumnDataSource(
    data={
        "left": [e["start"] for e in reg_elements],
        "right": [e["end"] for e in reg_elements],
        "top": [0.55] * len(reg_elements),
        "bottom": [-0.55] * len(reg_elements),
        "type": [e["type"] for e in reg_elements],
        "color": [reg_color_map[e["type"]] for e in reg_elements],
        "start_fmt": [f"{e['start']:,}" for e in reg_elements],
        "end_fmt": [f"{e['end']:,}" for e in reg_elements],
    }
)
p_reg.quad(
    left="left",
    right="right",
    top="top",
    bottom="bottom",
    source=reg_src,
    fill_color="color",
    line_color=PAGE_BG,
    line_width=2,
    alpha=0.9,
)

p_reg.add_tools(HoverTool(tooltips=[("Type", "@type"), ("Start", "@start_fmt"), ("End", "@end_fmt")]))

# Legend via invisible glyphs (one per reg type)
for reg_type, reg_col in reg_color_map.items():
    p_reg.quad(
        left=[0], right=[0], top=[0], bottom=[0], fill_color=reg_col, line_color=reg_col, alpha=0, legend_label=reg_type
    )

p_reg.add_layout(
    Label(
        x=region_start + 1800,
        y=1.25,
        text="Regulatory",
        text_font_size="28pt",
        text_color=INK_SOFT,
        text_font_style="bold",
    )
)

p_reg.yaxis.visible = False
p_reg.xaxis.axis_label = f"Genomic Position ({chrom})"
p_reg.xaxis.axis_label_text_font_size = "32pt"
p_reg.xaxis.axis_label_text_font_style = "normal"
p_reg.xaxis.axis_label_text_color = INK
p_reg.xaxis.major_label_text_font_size = "26pt"
p_reg.xaxis.major_label_text_color = INK_SOFT
p_reg.xaxis.formatter = NumeralTickFormatter(format="0,0")
p_reg.xaxis.axis_line_width = 2
p_reg.xaxis.axis_line_color = INK_SOFT
p_reg.xaxis.minor_tick_line_color = None
p_reg.xaxis.major_tick_line_color = INK_SOFT
p_reg.xgrid.grid_line_color = None
p_reg.ygrid.grid_line_color = None
p_reg.background_fill_color = PAGE_BG
p_reg.border_fill_color = PAGE_BG
p_reg.outline_line_color = None
p_reg.legend.label_text_font_size = "26pt"
p_reg.legend.label_text_color = INK_SOFT
p_reg.legend.glyph_height = 28
p_reg.legend.glyph_width = 36
p_reg.legend.spacing = 12
p_reg.legend.padding = 16
p_reg.legend.background_fill_alpha = 0.9
p_reg.legend.background_fill_color = ELEVATED_BG
p_reg.legend.border_line_color = INK_SOFT
p_reg.legend.location = "top_right"
p_reg.legend.orientation = "horizontal"

# Stack all four tracks; heights sum to ~1800px with spacing
layout = column(p_gene, p_cov, p_var, p_reg, spacing=5)

# Save interactive HTML
output_file(f"plot-{THEME}.html")
save(layout)

# Screenshot with headless Chrome via Selenium — avoids broken export_png chromedriver path.
# Use a taller window to accommodate browser chrome, then CDP-override viewport to exactly W×H.
W_PX, H_PX = 3200, 1800
opts = Options()
for arg in (
    "--headless=new",
    "--no-sandbox",
    "--disable-dev-shm-usage",
    "--disable-gpu",
    f"--window-size={W_PX},{H_PX + 200}",
    "--hide-scrollbars",
    "--force-device-scale-factor=1",
):
    opts.add_argument(arg)
driver = webdriver.Chrome(options=opts)
driver.execute_cdp_cmd(
    "Emulation.setDeviceMetricsOverride", {"width": W_PX, "height": H_PX, "deviceScaleFactor": 1, "mobile": False}
)
driver.get(f"file://{Path(f'plot-{THEME}.html').resolve()}")
time.sleep(3)
driver.save_screenshot(f"plot-{THEME}.png")
driver.quit()
Runnable source as JSON, for any HTTP client: https://api.anyplot.ai/specs/genome-track-multi/bokeh/code. Any spec id and library id listed in llms-full.txt fit the same URL shape; every URL below is complete and callable.
{
  "spec_id": "genome-track-multi",
  "language": "python",
  "library": "bokeh",
  "page": "https://anyplot.ai/genome-track-multi/python/bokeh",
  "hub": "https://anyplot.ai/genome-track-multi",
  "code_json": "https://api.anyplot.ai/specs/genome-track-multi/bokeh/code",
  "spec_json": "https://api.anyplot.ai/specs/genome-track-multi",
  "render_light_png": "https://storage.googleapis.com/anyplot-images/plots/genome-track-multi/python/bokeh/plot-light.png",
  "render_dark_png": "https://storage.googleapis.com/anyplot-images/plots/genome-track-multi/python/bokeh/plot-dark.png",
  "interactive_light_html": "https://storage.googleapis.com/anyplot-images/plots/genome-track-multi/python/bokeh/plot-light.html",
  "interactive_dark_html": "https://storage.googleapis.com/anyplot-images/plots/genome-track-multi/python/bokeh/plot-dark.html",
  "quality_score": 92.0,
  "license": "MIT",
  "guide": "https://anyplot.ai/llms.txt"
}
Part of Genome Track Viewer on anyplot.ai.