The same plot in 14 other libraries — Python: Altair, Bokeh, lets-plot, Matplotlib, Plotly, plotnine, Pygal, Seaborn; R: ggplot2; JavaScript: Chart.js, D3.js, Apache ECharts, Highcharts, MUI X Charts. Compare all 15 side by side: Genome Track Viewer in Python, R, Julia and JavaScript.
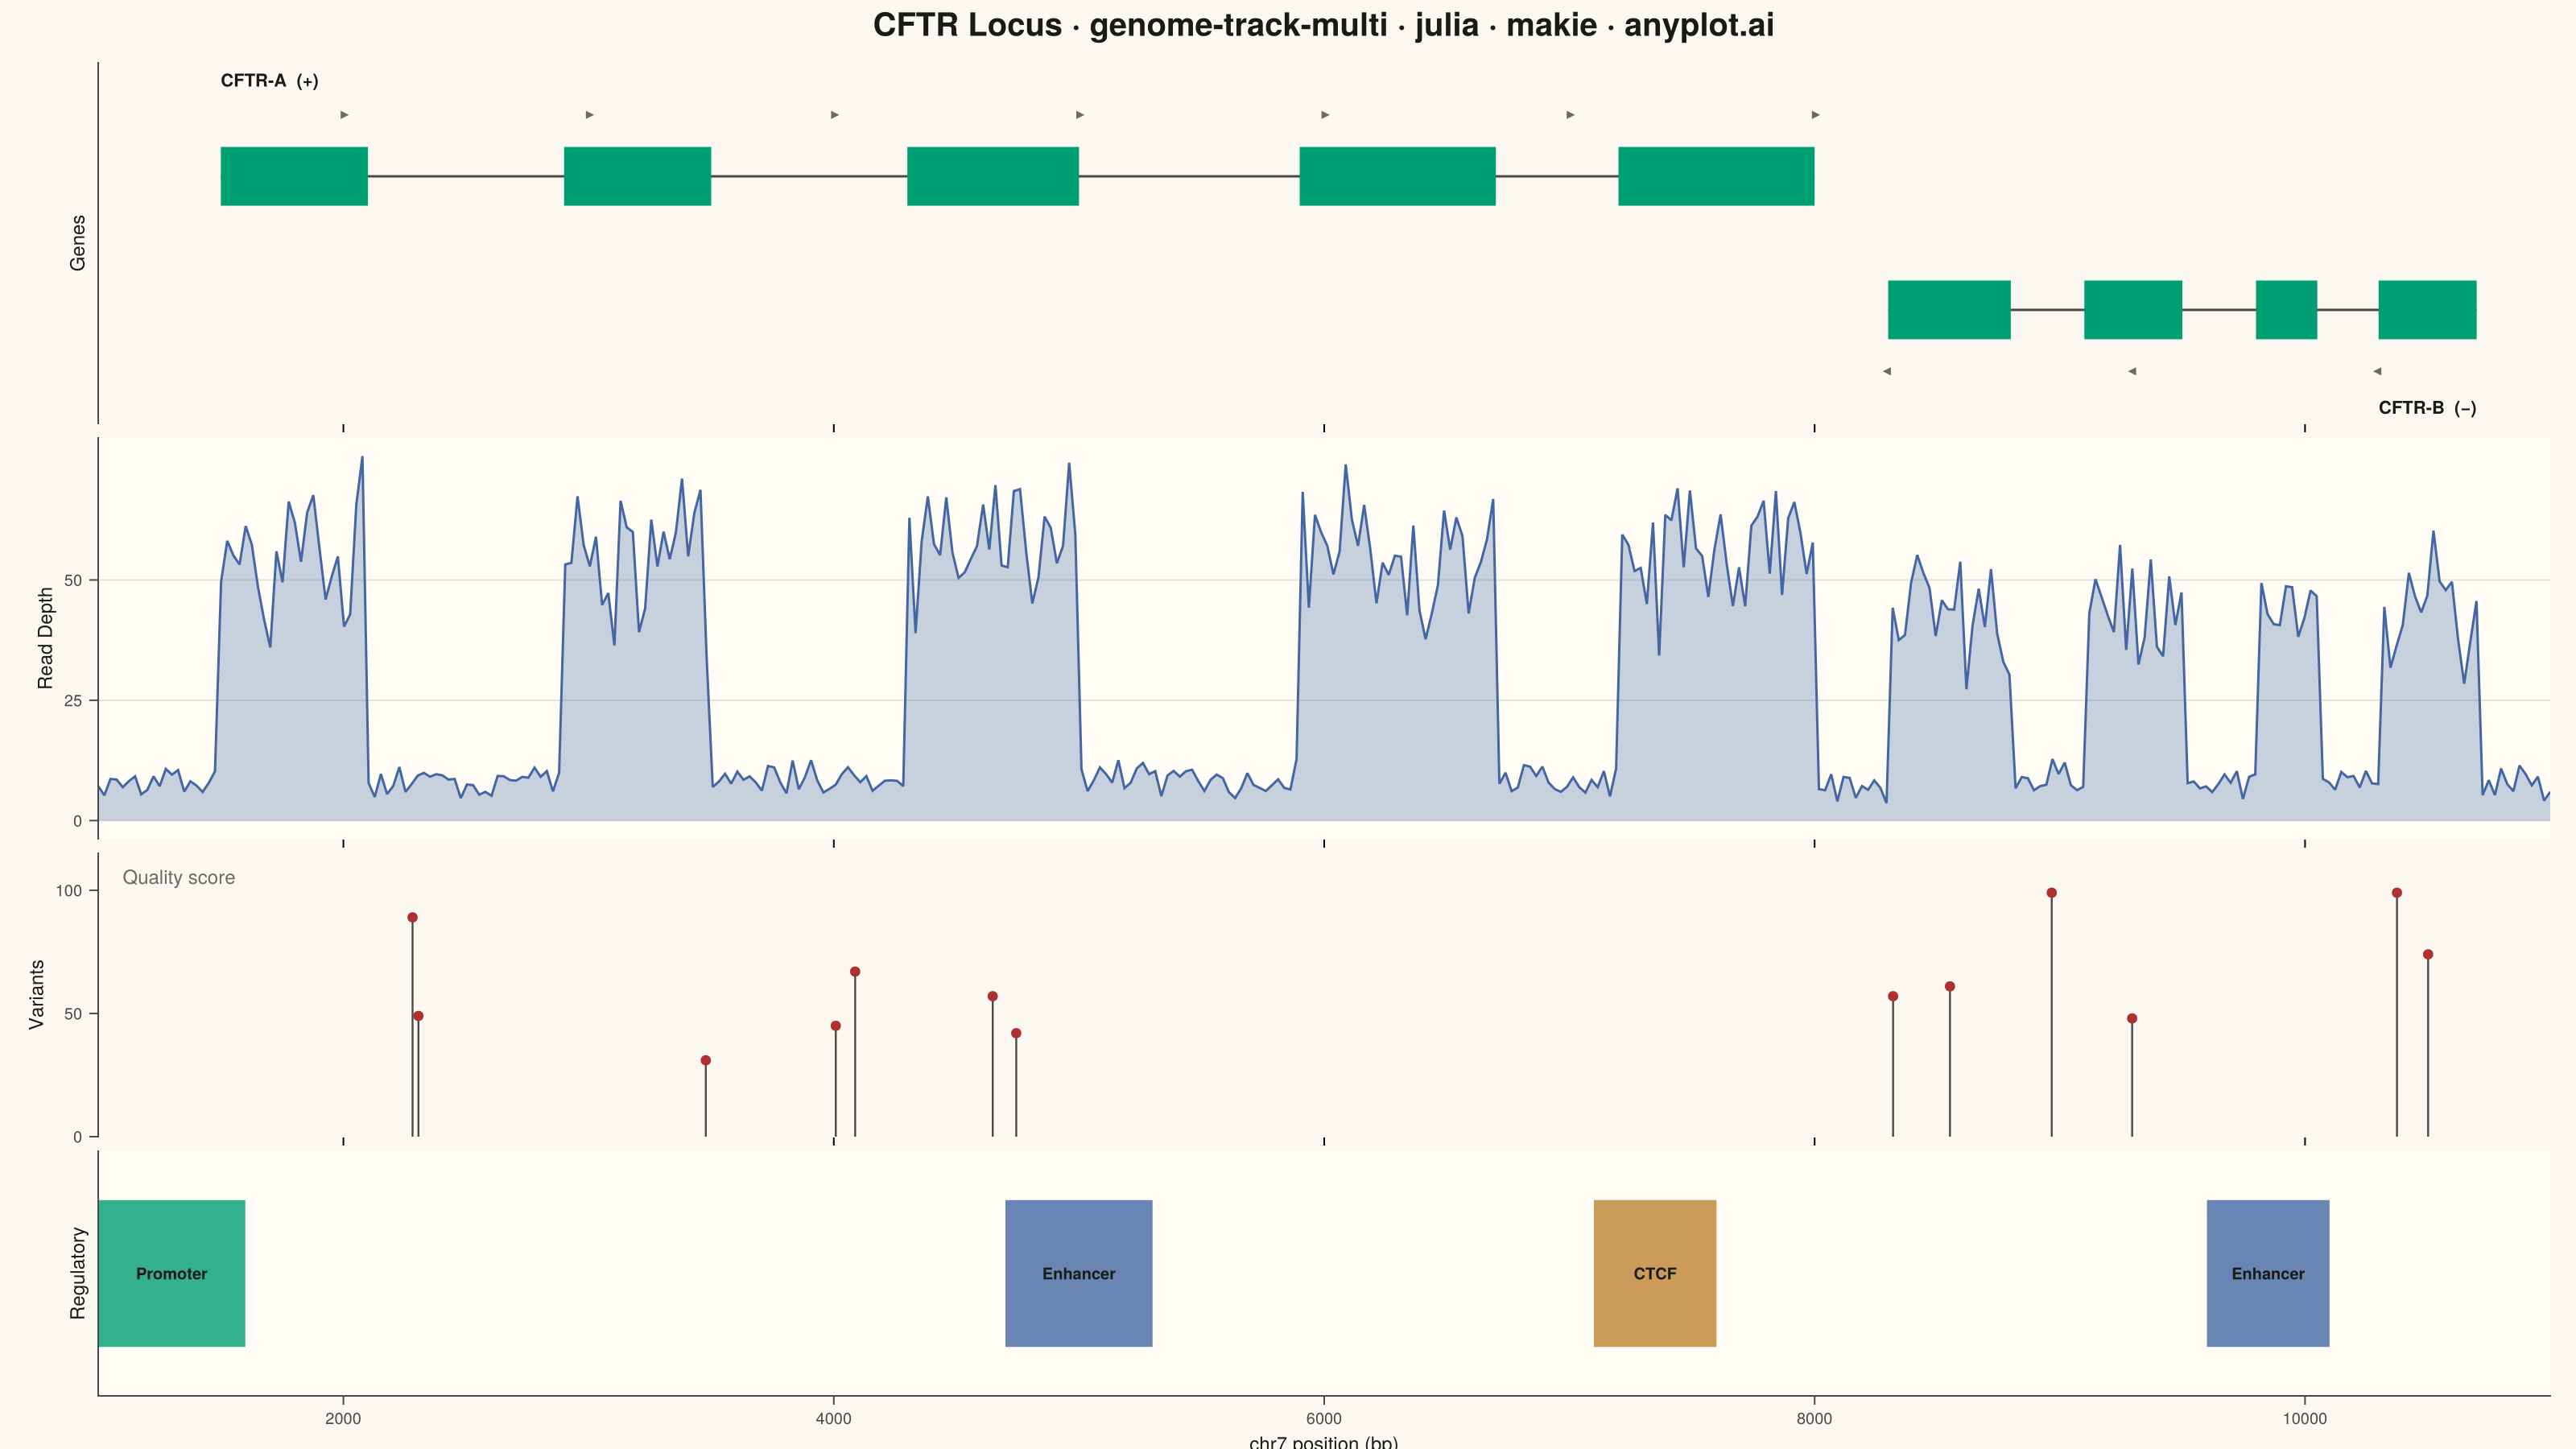
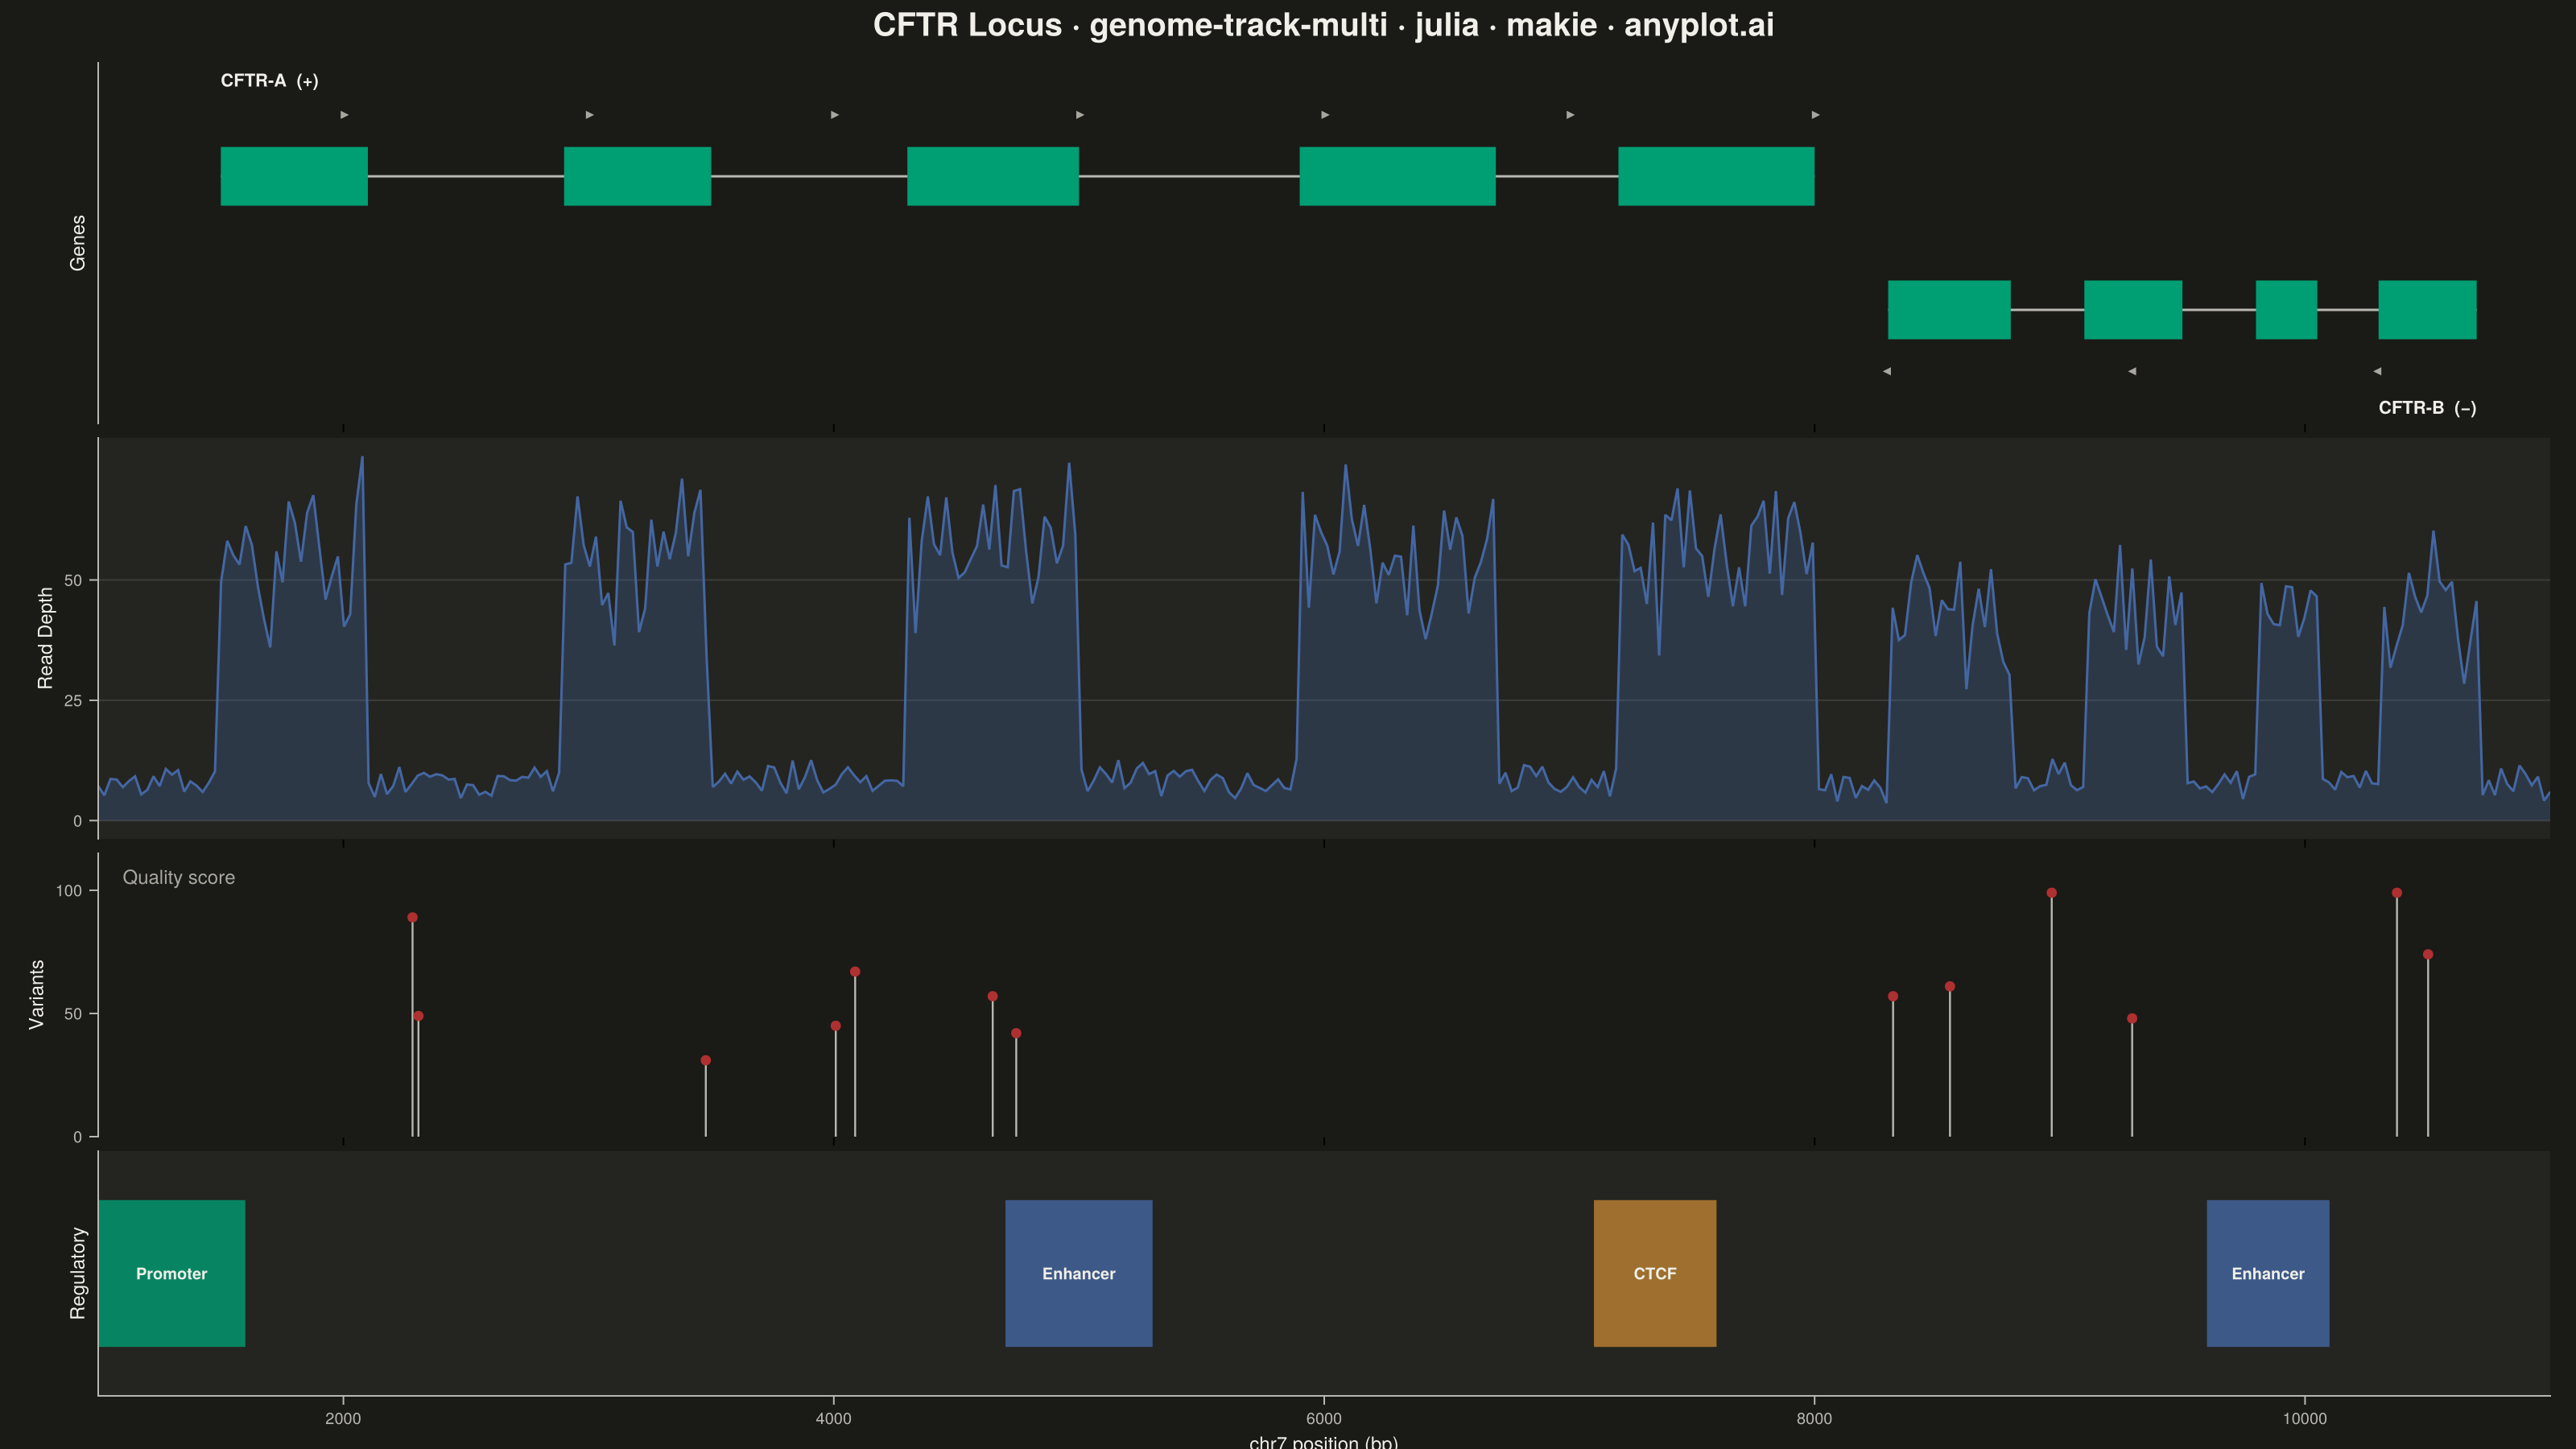
A multi-track genome browser view that displays different types of genomic data aligned along a shared chromosomal coordinate axis. Multiple parallel horizontal tracks (gene annotations, read coverage, variants, regulatory elements) are stacked vertically, each showing a different data type at the same genomic locus. This visualization is essential for integrative genomics, enabling researchers to explore relationships between gene structure, expression, variation, and regulation in a single coordinated view.
# anyplot.ai
# genome-track-multi: Genome Track Viewer
# Library: makie 0.22.10 | Julia 1.11.9
# Quality: 90/100 | Created: 2026-06-02

using CairoMakie
using Colors
using Random

Random.seed!(42)

# Theme tokens — Imprint palette, theme-adaptive chrome
const THEME       = get(ENV, "ANYPLOT_THEME", "light")
const PAGE_BG     = THEME == "light" ? colorant"#FAF8F1" : colorant"#1A1A17"
const ELEVATED_BG = THEME == "light" ? colorant"#FFFDF6" : colorant"#242420"
const INK         = THEME == "light" ? colorant"#1A1A17" : colorant"#F0EFE8"
const INK_SOFT    = THEME == "light" ? colorant"#4A4A44" : colorant"#B8B7B0"
const INK_MUTED   = THEME == "light" ? colorant"#6B6A63" : colorant"#A8A79F"

const IMPRINT_PALETTE = [
    colorant"#009E73",  # 1 — brand green
    colorant"#C475FD",  # 2 — lavender
    colorant"#4467A3",  # 3 — blue
    colorant"#BD8233",  # 4 — ochre
    colorant"#AE3030",  # 5 — matte red (semantic: variants/mutations)
    colorant"#2ABCCD",  # 6 — cyan
    colorant"#954477",  # 7 — rose
    colorant"#99B314",  # 8 — lime
]

# Genomic region: chr7, CFTR-like locus (simplified coordinates)
reg_start = 1_000
reg_end   = 11_000

# Gene track — two genes on opposite strands
ga_exon_starts = [1500, 2900, 4300, 5900, 7200]
ga_exon_ends   = [2100, 3500, 5000, 6700, 8000]
ga_gene_start  = 1500
ga_gene_end    = 8000
ga_y           = 0.55

gb_exon_starts = [8300, 9100, 9800, 10300]
gb_exon_ends   = [8800, 9500, 10050, 10700]
gb_gene_start  = 8300
gb_gene_end    = 10700
gb_y           = -0.45

# Coverage track (read depth peaks over exon regions)
cov_pos   = collect(range(Float64(reg_start), Float64(reg_end), length = 400))
cov_depth = fill(8.0, 400)
for (es, ee) in zip(ga_exon_starts, ga_exon_ends)
    mask = (cov_pos .>= es) .& (cov_pos .<= ee)
    cov_depth[mask] .+= 48.0 .+ randn(sum(mask)) .* 9.0
end
for (es, ee) in zip(gb_exon_starts, gb_exon_ends)
    mask = (cov_pos .>= es) .& (cov_pos .<= ee)
    cov_depth[mask] .+= 36.0 .+ randn(sum(mask)) .* 7.0
end
cov_depth .= max.(0.0, cov_depth .+ randn(400) .* 2.0)

# Variant track — SNP positions with quality scores
snp_pos = sort(rand(reg_start:reg_end, 13))
snp_q   = rand(28:99, 13)

# Regulatory elements: (start, end, label, palette color)
reg_els = [
    (1000, 1600, "Promoter", IMPRINT_PALETTE[1]),
    (4700, 5300, "Enhancer", IMPRINT_PALETTE[3]),
    (7100, 7600, "CTCF",     IMPRINT_PALETTE[4]),
    (9600, 10100,"Enhancer", IMPRINT_PALETTE[3]),
]

# Title (60 chars < 67 baseline → default titlesize = 20)
title_str = "CFTR Locus · genome-track-multi · julia · makie · anyplot.ai"
titlesize = max(14, round(Int, 20 * min(1.0, 67.0 / length(title_str))))

grid_col = RGBAf(INK.r, INK.g, INK.b, 0.12)

# Figure
fig = Figure(
    size            = (1600, 900),
    fontsize        = 12,
    backgroundcolor = PAGE_BG,
)

# Title label above all tracks
Label(
    fig[0, 1];
    text      = title_str,
    fontsize  = titlesize,
    color     = INK,
    font      = :bold,
    tellwidth = false,
    padding   = (0, 0, 4, 2),
)

# ---- Track 1: Gene Annotations ----------------------------------------
ax_gene = Axis(
    fig[1, 1];
    ylabel             = "Genes",
    ylabelsize         = 12,
    ylabelcolor        = INK,
    backgroundcolor    = PAGE_BG,
    topspinevisible    = false,
    rightspinevisible  = false,
    bottomspinevisible = false,
    leftspinecolor     = INK_SOFT,
    xgridvisible       = false,
    ygridvisible       = false,
    yticklabelsvisible = false,
    yticksvisible      = false,
    limits             = (reg_start, reg_end, -1.3, 1.4),
)
hidexdecorations!(ax_gene; ticks = false, grid = false)

# Gene A — backbone + exon rectangles + strand arrows
lines!(ax_gene, [Float64(ga_gene_start), Float64(ga_gene_end)], [ga_y, ga_y];
    color = INK_SOFT, linewidth = 1.5)

for (s, e) in zip(ga_exon_starts, ga_exon_ends)
    poly!(ax_gene,
        [Point2f(s, ga_y - 0.22), Point2f(e, ga_y - 0.22),
         Point2f(e, ga_y + 0.22), Point2f(s, ga_y + 0.22)];
        color = IMPRINT_PALETTE[1], strokewidth = 0)
end

for xp in (ga_gene_start + 500):1000:ga_gene_end
    scatter!(ax_gene, [Float64(xp)], [ga_y + 0.46];
        marker = :rtriangle, color = INK_MUTED, markersize = 7, strokewidth = 0)
end

text!(ax_gene, Float64(ga_gene_start), ga_y + 0.72;
    text = "CFTR-A  (+)", fontsize = 11, color = INK, align = (:left, :center),
    font = :bold)

# Gene B — backbone + exon rectangles + strand arrows
lines!(ax_gene, [Float64(gb_gene_start), Float64(gb_gene_end)], [gb_y, gb_y];
    color = INK_SOFT, linewidth = 1.5)

for (s, e) in zip(gb_exon_starts, gb_exon_ends)
    poly!(ax_gene,
        [Point2f(s, gb_y - 0.22), Point2f(e, gb_y - 0.22),
         Point2f(e, gb_y + 0.22), Point2f(s, gb_y + 0.22)];
        color = IMPRINT_PALETTE[1], strokewidth = 0)
end

for xp in (gb_gene_end - 400):-1000:gb_gene_start
    scatter!(ax_gene, [Float64(xp)], [gb_y - 0.46];
        marker = :ltriangle, color = INK_MUTED, markersize = 7, strokewidth = 0)
end

text!(ax_gene, Float64(gb_gene_end), gb_y - 0.73;
    text = "CFTR-B  (−)", fontsize = 11, color = INK, align = (:right, :center),
    font = :bold)

# ---- Track 2: Read Coverage -------------------------------------------
ax_cov = Axis(
    fig[2, 1];
    ylabel             = "Read Depth",
    ylabelsize         = 12,
    ylabelcolor        = INK,
    yticklabelcolor    = INK_SOFT,
    yticklabelsize     = 10,
    ytickcolor         = INK_SOFT,
    backgroundcolor    = ELEVATED_BG,
    topspinevisible    = false,
    rightspinevisible  = false,
    bottomspinevisible = false,
    leftspinecolor     = INK_SOFT,
    xgridvisible       = false,
    ygridcolor         = grid_col,
    yticks             = [0, 25, 50],
)
hidexdecorations!(ax_cov; ticks = false, grid = false)

band!(ax_cov, cov_pos, fill(0.0, 400), cov_depth;
    color = RGBAf(IMPRINT_PALETTE[3].r, IMPRINT_PALETTE[3].g, IMPRINT_PALETTE[3].b, 0.30))
lines!(ax_cov, cov_pos, cov_depth;
    color = IMPRINT_PALETTE[3], linewidth = 1.5)

# ---- Track 3: Variants (SNPs, lollipop plot) -------------------------
ax_var = Axis(
    fig[3, 1];
    ylabel             = "Variants",
    ylabelsize         = 12,
    ylabelcolor        = INK,
    yticklabelcolor    = INK_SOFT,
    yticklabelsize     = 10,
    ytickcolor         = INK_SOFT,
    backgroundcolor    = PAGE_BG,
    topspinevisible    = false,
    rightspinevisible  = false,
    bottomspinevisible = false,
    leftspinecolor     = INK_SOFT,
    xgridvisible       = false,
    ygridvisible       = false,
    limits             = (reg_start, reg_end, 0.0, 115.0),
    yticks             = [0, 50, 100],
)
hidexdecorations!(ax_var; ticks = false, grid = false)

for (pos, q) in zip(snp_pos, snp_q)
    lines!(ax_var, [Float64(pos), Float64(pos)], [0.0, Float64(q)];
        color = INK_SOFT, linewidth = 1.2)
    scatter!(ax_var, [Float64(pos)], [Float64(q)];
        color = IMPRINT_PALETTE[5], markersize = 9, strokewidth = 0)
end

text!(ax_var, Float64(reg_start + 100), 110.0;
    text = "Quality score", fontsize = 12, color = INK_MUTED, align = (:left, :top))

# ---- Track 4: Regulatory Elements ------------------------------------
ax_reg = Axis(
    fig[4, 1];
    xlabel             = "chr7 position (bp)",
    ylabel             = "Regulatory",
    xlabelsize         = 12,
    ylabelsize         = 12,
    xlabelcolor        = INK,
    ylabelcolor        = INK,
    xticklabelcolor    = INK_SOFT,
    xticklabelsize     = 10,
    xtickcolor         = INK_SOFT,
    backgroundcolor    = ELEVATED_BG,
    topspinevisible    = false,
    rightspinevisible  = false,
    leftspinecolor     = INK_SOFT,
    bottomspinecolor   = INK_SOFT,
    xgridvisible       = false,
    ygridvisible       = false,
    limits             = (reg_start, reg_end, 0.0, 1.0),
    yticklabelsvisible = false,
    yticksvisible      = false,
)

for (s, e, lbl, clr) in reg_els
    poly!(ax_reg,
        [Point2f(s, 0.2), Point2f(e, 0.2), Point2f(e, 0.8), Point2f(s, 0.8)];
        color = (clr, 0.80), strokewidth = 0)
    text!(ax_reg, (s + e) / 2.0, 0.5;
        text = lbl, fontsize = 10, color = INK,
        align = (:center, :center), font = :bold)
end

# Link x-axes and enforce shared range
linkxaxes!(ax_gene, ax_cov, ax_var, ax_reg)
xlims!(ax_gene, Float64(reg_start), Float64(reg_end))
xlims!(ax_cov,  Float64(reg_start), Float64(reg_end))
xlims!(ax_var,  Float64(reg_start), Float64(reg_end))
xlims!(ax_reg,  Float64(reg_start), Float64(reg_end))

# Row proportions
rowsize!(fig.layout, 0, Fixed(38))
rowsize!(fig.layout, 1, Relative(0.28))
rowsize!(fig.layout, 2, Relative(0.31))
rowsize!(fig.layout, 3, Relative(0.22))
rowsize!(fig.layout, 4, Relative(0.19))
rowgap!(fig.layout, 4)

# Save
save("plot-$(THEME).png", fig; px_per_unit = 2)
Runnable source as JSON, for any HTTP client: https://api.anyplot.ai/specs/genome-track-multi/makie/code. Any spec id and library id listed in llms-full.txt fit the same URL shape; every URL below is complete and callable.
{
  "spec_id": "genome-track-multi",
  "language": "julia",
  "library": "makie",
  "page": "https://anyplot.ai/genome-track-multi/julia/makie",
  "hub": "https://anyplot.ai/genome-track-multi",
  "code_json": "https://api.anyplot.ai/specs/genome-track-multi/makie/code",
  "spec_json": "https://api.anyplot.ai/specs/genome-track-multi",
  "render_light_png": "https://storage.googleapis.com/anyplot-images/plots/genome-track-multi/julia/makie/plot-light.png",
  "render_dark_png": "https://storage.googleapis.com/anyplot-images/plots/genome-track-multi/julia/makie/plot-dark.png",
  "quality_score": 90.0,
  "license": "MIT",
  "guide": "https://anyplot.ai/llms.txt"
}
Part of Genome Track Viewer on anyplot.ai.