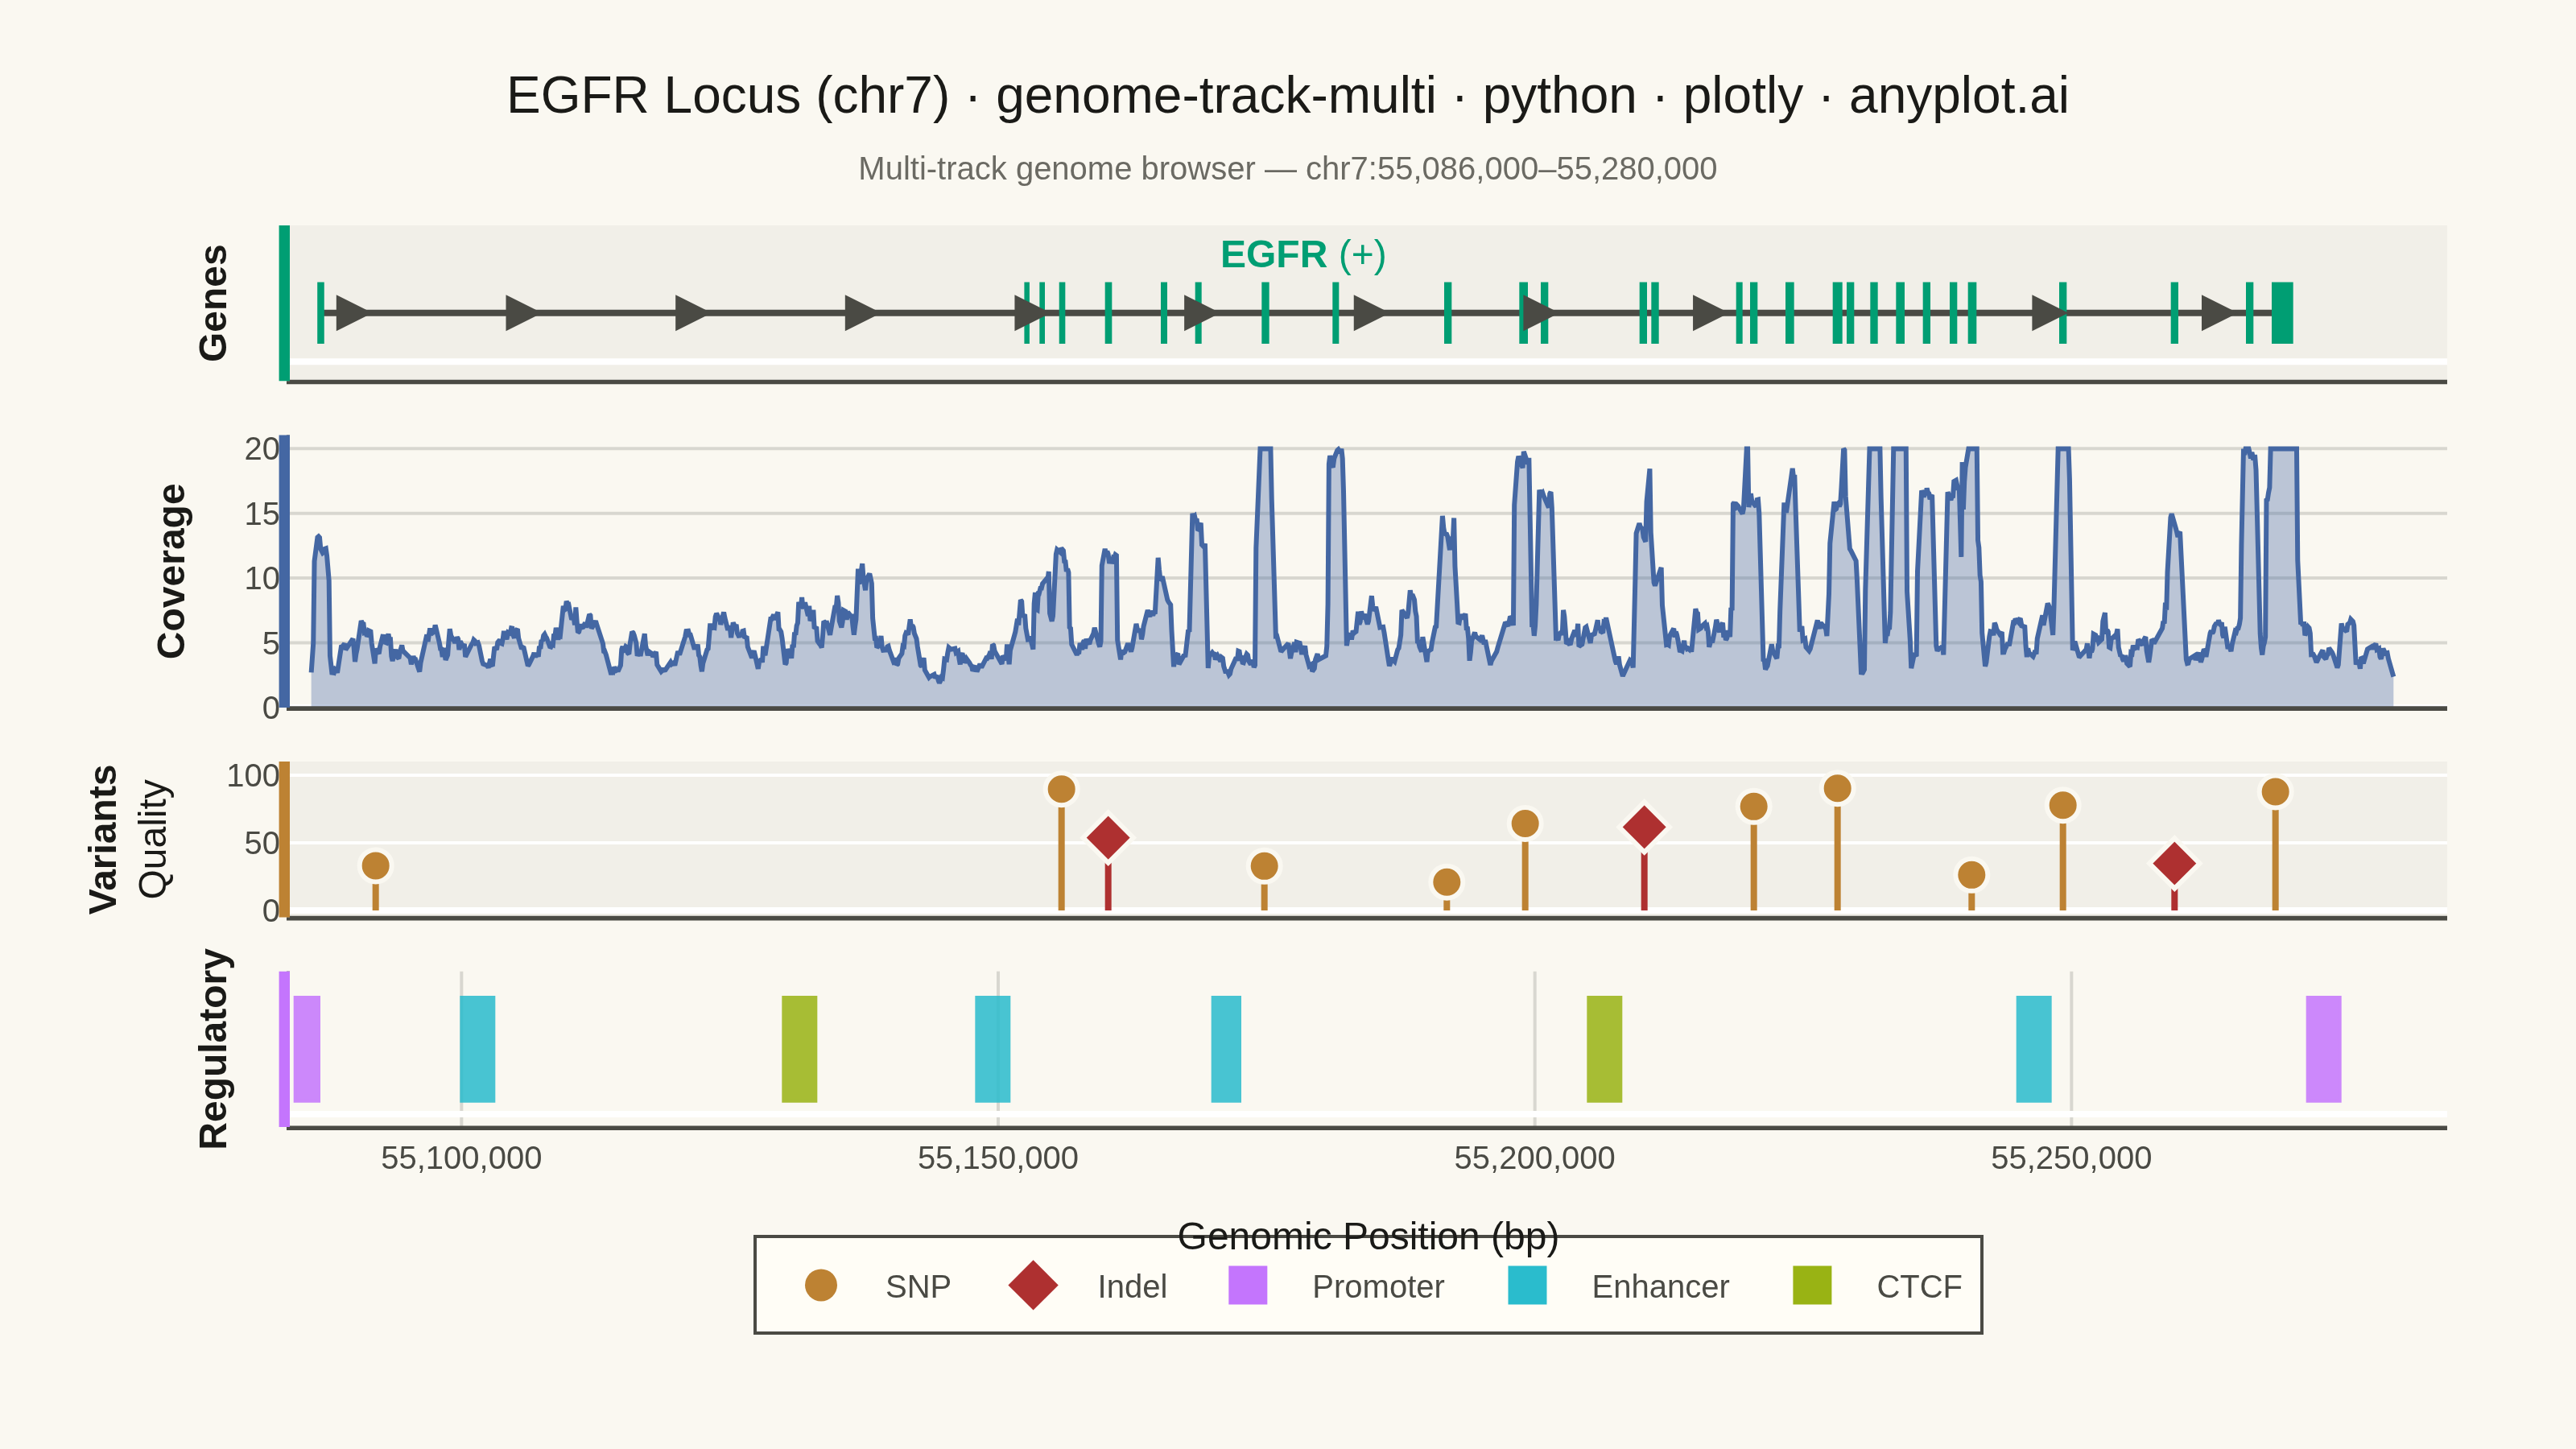
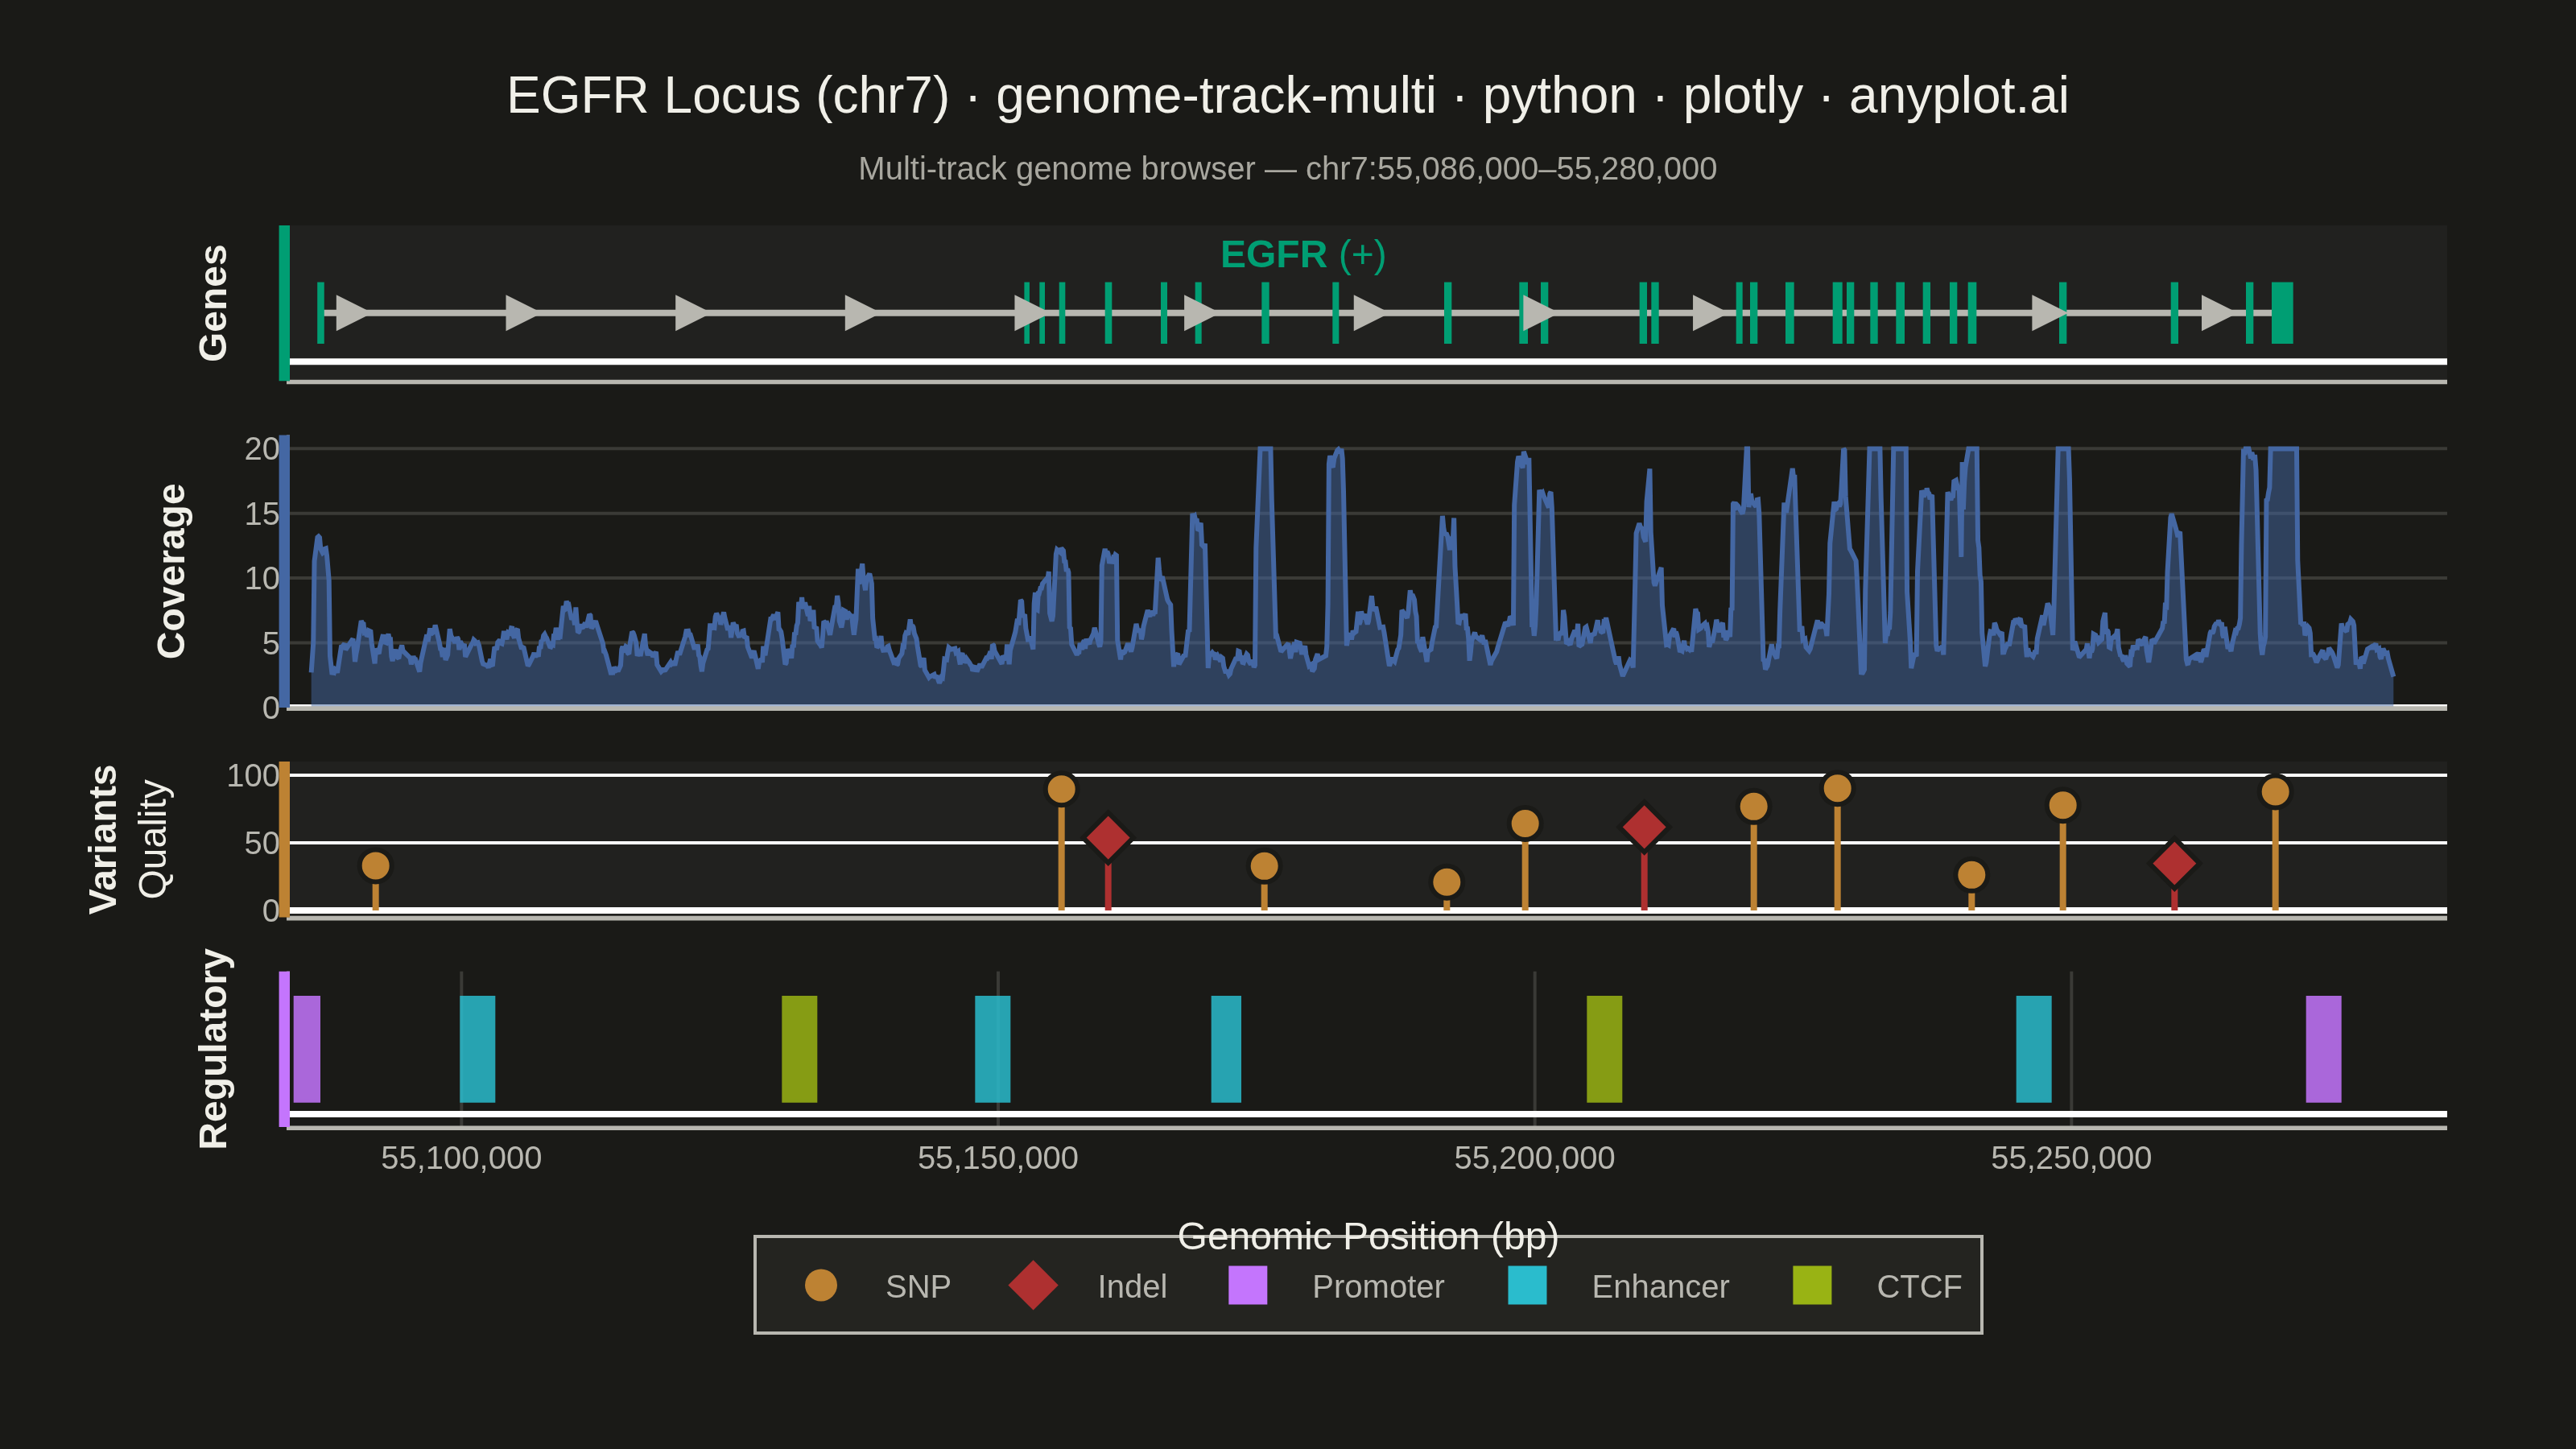
A multi-track genome browser view that displays different types of genomic data aligned along a shared chromosomal coordinate axis. Multiple parallel horizontal tracks (gene annotations, read coverage, variants, regulatory elements) are stacked vertically, each showing a different data type at the same genomic locus. This visualization is essential for integrative genomics, enabling researchers to explore relationships between gene structure, expression, variation, and regulation in a single coordinated view.
""" anyplot.ai
genome-track-multi: Genome Track Viewer
Library: plotly 6.7.0 | Python 3.13.13
Quality: 93/100 | Updated: 2026-06-02
"""

import os

import numpy as np
import plotly.graph_objects as go
from plotly.subplots import make_subplots


# Theme tokens — Imprint palette + theme-adaptive chrome
THEME = os.getenv("ANYPLOT_THEME", "light")
PAGE_BG = "#FAF8F1" if THEME == "light" else "#1A1A17"
ELEVATED_BG = "#FFFDF6" if THEME == "light" else "#242420"
INK = "#1A1A17" if THEME == "light" else "#F0EFE8"
INK_SOFT = "#4A4A44" if THEME == "light" else "#B8B7B0"
INK_MUTED = "#6B6A63" if THEME == "light" else "#A8A79F"
GRID = "rgba(26,26,23,0.15)" if THEME == "light" else "rgba(240,239,232,0.15)"
TRACK_BG = "rgba(26,26,23,0.04)" if THEME == "light" else "rgba(240,239,232,0.04)"

# Imprint categorical palette — positions assigned by track role
EXON_COLOR = "#009E73"  # Imprint pos 1 — brand green (gene annotation)
INTRON_COLOR = INK_SOFT  # theme-adaptive structural chrome
COVERAGE_COLOR = "#4467A3"  # Imprint pos 3 — blue (expression depth)
SNP_COLOR = "#BD8233"  # Imprint pos 4 — ochre
INDEL_COLOR = "#AE3030"  # Imprint pos 5 — matte red (more impactful variant)
PROMOTER_COLOR = "#C475FD"  # Imprint pos 2 — lavender
ENHANCER_COLOR = "#2ABCCD"  # Imprint pos 6 — cyan
CTCF_COLOR = "#99B314"  # Imprint pos 8 — lime

# Data
np.random.seed(42)

# Genomic region: chr7, EGFR locus
chrom = "chr7"
region_start = 55_086_000
region_end = 55_280_000

# Gene track — EGFR structure (28 exons)
gene_name = "EGFR"
strand = "+"
exons = [
    (55_086_714, 55_087_058),
    (55_152_580, 55_152_770),
    (55_154_000, 55_154_200),
    (55_155_830, 55_156_100),
    (55_160_100, 55_160_450),
    (55_165_300, 55_165_600),
    (55_168_500, 55_168_800),
    (55_174_700, 55_175_100),
    (55_181_300, 55_181_600),
    (55_191_700, 55_192_100),
    (55_198_700, 55_199_200),
    (55_200_700, 55_201_100),
    (55_209_900, 55_210_300),
    (55_211_000, 55_211_400),
    (55_218_900, 55_219_200),
    (55_220_200, 55_220_600),
    (55_223_500, 55_224_000),
    (55_227_900, 55_228_500),
    (55_229_200, 55_229_600),
    (55_231_400, 55_231_800),
    (55_233_800, 55_234_300),
    (55_236_300, 55_236_700),
    (55_238_800, 55_239_200),
    (55_240_500, 55_241_000),
    (55_249_000, 55_249_400),
    (55_259_400, 55_259_800),
    (55_266_400, 55_266_800),
    (55_268_800, 55_270_500),
]
gene_start = exons[0][0]
gene_end = exons[-1][1]

# Coverage track — RNA-seq read depth, clipped at 95th percentile
# to prevent the extreme 3' spike from compressing smaller exon peaks
positions = np.linspace(region_start, region_end, 2000)
base_coverage = np.random.exponential(5, 2000)
for ex_start, ex_end in exons:
    mask = (positions >= ex_start) & (positions <= ex_end)
    base_coverage[mask] += np.random.exponential(40, mask.sum())
coverage = np.convolve(base_coverage, np.ones(15) / 15, mode="same")
coverage = np.clip(coverage, 0, np.percentile(coverage, 95))

# Variant track — SNPs and indels with quality scores
variant_positions = [
    55_092_000,
    55_155_900,
    55_160_250,
    55_174_800,
    55_191_800,
    55_199_100,
    55_210_200,
    55_220_400,
    55_228_200,
    55_240_700,
    55_249_200,
    55_259_600,
    55_269_000,
]
variant_types = ["SNP", "SNP", "Indel", "SNP", "SNP", "SNP", "Indel", "SNP", "SNP", "SNP", "SNP", "Indel", "SNP"]
variant_quality = np.random.uniform(20, 99, len(variant_positions))
variant_labels = [
    "rs121434568",
    "rs28929495",
    "ins_3bp",
    "rs121913229",
    "rs1050171",
    "rs2227983",
    "del_2bp",
    "rs121434569",
    "rs56289927",
    "rs17290699",
    "rs10241451",
    "ins_5bp",
    "rs11543848",
]

# Regulatory track — enhancers, promoters, CTCF binding sites
reg_elements = [
    (55_084_500, 55_086_700, "Promoter"),
    (55_100_000, 55_103_000, "Enhancer"),
    (55_130_000, 55_133_000, "CTCF"),
    (55_148_000, 55_151_000, "Enhancer"),
    (55_170_000, 55_172_500, "Enhancer"),
    (55_205_000, 55_208_000, "CTCF"),
    (55_245_000, 55_248_000, "Enhancer"),
    (55_272_000, 55_275_000, "Promoter"),
]

# Plot — 4 tracks sharing x-axis
fig = make_subplots(rows=4, cols=1, shared_xaxes=True, vertical_spacing=0.06, row_heights=[0.2, 0.35, 0.2, 0.2])

# Track 1: Gene annotations
gene_y = 0.5
fig.add_trace(
    go.Scatter(
        x=[gene_start, gene_end],
        y=[gene_y, gene_y],
        mode="lines",
        line={"color": INTRON_COLOR, "width": 2},
        showlegend=False,
        hoverinfo="skip",
    ),
    row=1,
    col=1,
)
for ex_start, ex_end in exons:
    fig.add_shape(
        type="rect",
        x0=ex_start,
        x1=ex_end,
        y0=0.2,
        y1=0.8,
        fillcolor=EXON_COLOR,
        line={"color": EXON_COLOR, "width": 1},
        row=1,
        col=1,
    )
arrow_positions = np.linspace(gene_start + 5000, gene_end - 5000, 12)
for pos in arrow_positions:
    in_exon = any(es <= pos <= ee for es, ee in exons)
    if not in_exon:
        fig.add_annotation(
            x=pos,
            y=gene_y,
            ax=pos - 2000,
            ay=gene_y,
            xref="x",
            yref="y",
            axref="x",
            ayref="y",
            showarrow=True,
            arrowhead=2,
            arrowsize=1.5,
            arrowwidth=1.5,
            arrowcolor=INTRON_COLOR,
            row=1,
            col=1,
        )
fig.add_annotation(
    x=(gene_start + gene_end) / 2,
    y=1.1,
    text=f"<b>{gene_name}</b> ({strand})",
    showarrow=False,
    font={"size": 12, "color": EXON_COLOR},
    xref="x",
    yref="y",
    row=1,
    col=1,
)

# Track 2: Coverage (filled area)
cov_fill = "rgba(68,103,163,0.35)" if THEME == "light" else "rgba(68,103,163,0.5)"
fig.add_trace(
    go.Scatter(
        x=positions,
        y=coverage,
        mode="lines",
        fill="tozeroy",
        fillcolor=cov_fill,
        line={"color": COVERAGE_COLOR, "width": 1.5},
        showlegend=False,
        hovertemplate="Position: %{x:,.0f}<br>Coverage: %{y:.1f}x<extra></extra>",
    ),
    row=2,
    col=1,
)

# Track 3: Variants (lollipop markers encoding quality score)
var_color_map = {"SNP": SNP_COLOR, "Indel": INDEL_COLOR}
for pos, vtype, qual, vlabel in zip(variant_positions, variant_types, variant_quality, variant_labels, strict=False):
    color = var_color_map[vtype]
    fig.add_trace(
        go.Scatter(
            x=[pos, pos],
            y=[0, qual],
            mode="lines",
            line={"color": color, "width": 2},
            showlegend=False,
            hoverinfo="skip",
        ),
        row=3,
        col=1,
    )
    fig.add_trace(
        go.Scatter(
            x=[pos],
            y=[qual],
            mode="markers",
            marker={
                "size": 10 if vtype == "SNP" else 12,
                "color": color,
                "symbol": "circle" if vtype == "SNP" else "diamond",
                "line": {"color": PAGE_BG, "width": 1.5},
            },
            showlegend=False,
            hovertemplate=f"{vlabel}<br>Type: {vtype}<br>Position: {pos:,}<br>Quality: {qual:.1f}<extra></extra>",
        ),
        row=3,
        col=1,
    )
fig.add_trace(
    go.Scatter(
        x=[None], y=[None], mode="markers", marker={"size": 10, "color": SNP_COLOR, "symbol": "circle"}, name="SNP"
    ),
    row=3,
    col=1,
)
fig.add_trace(
    go.Scatter(
        x=[None], y=[None], mode="markers", marker={"size": 12, "color": INDEL_COLOR, "symbol": "diamond"}, name="Indel"
    ),
    row=3,
    col=1,
)

# Track 4: Regulatory elements (add_shape for clean rectangles; invisible traces for legend)
reg_color_map = {"Promoter": PROMOTER_COLOR, "Enhancer": ENHANCER_COLOR, "CTCF": CTCF_COLOR}
added_legend = set()
for reg_start, reg_end, reg_type in reg_elements:
    color = reg_color_map[reg_type]
    fig.add_shape(
        type="rect",
        x0=reg_start,
        y0=0.1,
        x1=reg_end,
        y1=0.9,
        fillcolor=color,
        line={"color": color, "width": 1},
        opacity=0.85,
        row=4,
        col=1,
    )
    if reg_type not in added_legend:
        added_legend.add(reg_type)
        fig.add_trace(
            go.Scatter(
                x=[None],
                y=[None],
                mode="markers",
                marker={"color": color, "size": 12, "symbol": "square"},
                name=reg_type,
                showlegend=True,
            ),
            row=4,
            col=1,
        )

# Track y-axis labels
for row, label in [(1, "Genes"), (2, "Coverage"), (4, "Regulatory")]:
    fig.update_yaxes(title={"text": f"<b>{label}</b>", "font": {"size": 12, "color": INK}}, row=row, col=1)
fig.update_yaxes(title={"text": "<b>Variants</b><br>Quality", "font": {"size": 12, "color": INK}}, row=3, col=1)

# Title fontsize scaled to title character length
title_text = "EGFR Locus (chr7) · genome-track-multi · python · plotly · anyplot.ai"
subtitle_text = "Multi-track genome browser — chr7:55,086,000–55,280,000"
n = len(title_text)
title_fontsize = max(11, round(16 * 67 / n)) if n > 67 else 16

# Layout
fig.update_layout(
    autosize=False,
    paper_bgcolor=PAGE_BG,
    plot_bgcolor=PAGE_BG,
    font={"color": INK},
    title={
        "text": (f'{title_text}<br><span style="font-size:10px;color:{INK_MUTED}">{subtitle_text}</span>'),
        "font": {"size": title_fontsize, "color": INK},
        "x": 0.5,
    },
    legend={
        "bgcolor": ELEVATED_BG,
        "bordercolor": INK_SOFT,
        "borderwidth": 1,
        "font": {"size": 10, "color": INK_SOFT},
        "orientation": "h",
        "yanchor": "top",
        "y": -0.12,
        "xanchor": "center",
        "x": 0.5,
    },
    margin={"l": 90, "r": 40, "t": 70, "b": 100},
)

# X-axis (bottom track only shows labels and title)
fig.update_xaxes(
    title={"text": "Genomic Position (bp)", "font": {"size": 12, "color": INK}},
    tickfont={"size": 10, "color": INK_SOFT},
    tickformat=",",
    range=[region_start - 2000, region_end + 5000],
    linecolor=INK_SOFT,
    gridcolor=GRID,
    row=4,
    col=1,
)
for row in range(1, 4):
    fig.update_xaxes(
        tickfont={"size": 10}, tickformat=",", showticklabels=False, showgrid=False, linecolor=INK_SOFT, row=row, col=1
    )

# Y-axes per track
fig.update_yaxes(range=[-0.2, 1.4], showticklabels=False, showgrid=False, linecolor=INK_SOFT, row=1, col=1)
fig.update_yaxes(
    tickfont={"size": 10, "color": INK_SOFT}, gridcolor=GRID, gridwidth=1, linecolor=INK_SOFT, row=2, col=1
)
fig.update_yaxes(tickfont={"size": 10, "color": INK_SOFT}, range=[-5, 110], linecolor=INK_SOFT, row=3, col=1)
fig.update_yaxes(range=[-0.1, 1.1], showticklabels=False, showgrid=False, linecolor=INK_SOFT, row=4, col=1)

# Alternating background shading on tracks 1 and 3
for row in [1, 3]:
    fig.add_shape(
        type="rect",
        x0=0,
        x1=1,
        y0=0,
        y1=1,
        xref=f"x{row} domain" if row > 1 else "x domain",
        yref=f"y{row} domain" if row > 1 else "y domain",
        fillcolor=TRACK_BG,
        line={"width": 0},
        layer="below",
    )

# Colored left-edge accent strips per track
accent_colors = {1: EXON_COLOR, 2: COVERAGE_COLOR, 3: SNP_COLOR, 4: PROMOTER_COLOR}
for row, accent in accent_colors.items():
    fig.add_shape(
        type="rect",
        x0=-0.005,
        x1=0.0,
        y0=0,
        y1=1,
        xref=f"x{row} domain" if row > 1 else "x domain",
        yref=f"y{row} domain" if row > 1 else "y domain",
        fillcolor=accent,
        line={"width": 0},
        layer="above",
    )

# Track divider lines
for row in range(1, 5):
    fig.add_shape(
        type="line",
        x0=0,
        x1=1,
        y0=0,
        y1=0,
        xref=f"x{row} domain" if row > 1 else "x domain",
        yref=f"y{row} domain" if row > 1 else "y domain",
        line={"color": INK_SOFT, "width": 0.8},
    )

# Save static PNG (no rangeslider — cleaner layout)
fig.write_image(f"plot-{THEME}.png", width=800, height=450, scale=4)

# Save HTML with rangeslider for interactive navigation
fig.update_xaxes(rangeslider={"visible": True, "thickness": 0.06}, row=4, col=1)
fig.write_html(f"plot-{THEME}.html", include_plotlyjs="cdn")
Runnable source as JSON, for any HTTP client: https://api.anyplot.ai/specs/genome-track-multi/plotly/code. Any spec id and library id listed in llms-full.txt fit the same URL shape; every URL below is complete and callable.
{
  "spec_id": "genome-track-multi",
  "language": "python",
  "library": "plotly",
  "page": "https://anyplot.ai/genome-track-multi/python/plotly",
  "hub": "https://anyplot.ai/genome-track-multi",
  "code_json": "https://api.anyplot.ai/specs/genome-track-multi/plotly/code",
  "spec_json": "https://api.anyplot.ai/specs/genome-track-multi",
  "render_light_png": "https://storage.googleapis.com/anyplot-images/plots/genome-track-multi/python/plotly/plot-light.png",
  "render_dark_png": "https://storage.googleapis.com/anyplot-images/plots/genome-track-multi/python/plotly/plot-dark.png",
  "interactive_light_html": "https://storage.googleapis.com/anyplot-images/plots/genome-track-multi/python/plotly/plot-light.html",
  "interactive_dark_html": "https://storage.googleapis.com/anyplot-images/plots/genome-track-multi/python/plotly/plot-dark.html",
  "quality_score": 93.0,
  "license": "MIT",
  "guide": "https://anyplot.ai/llms.txt"
}
Part of Genome Track Viewer on anyplot.ai.