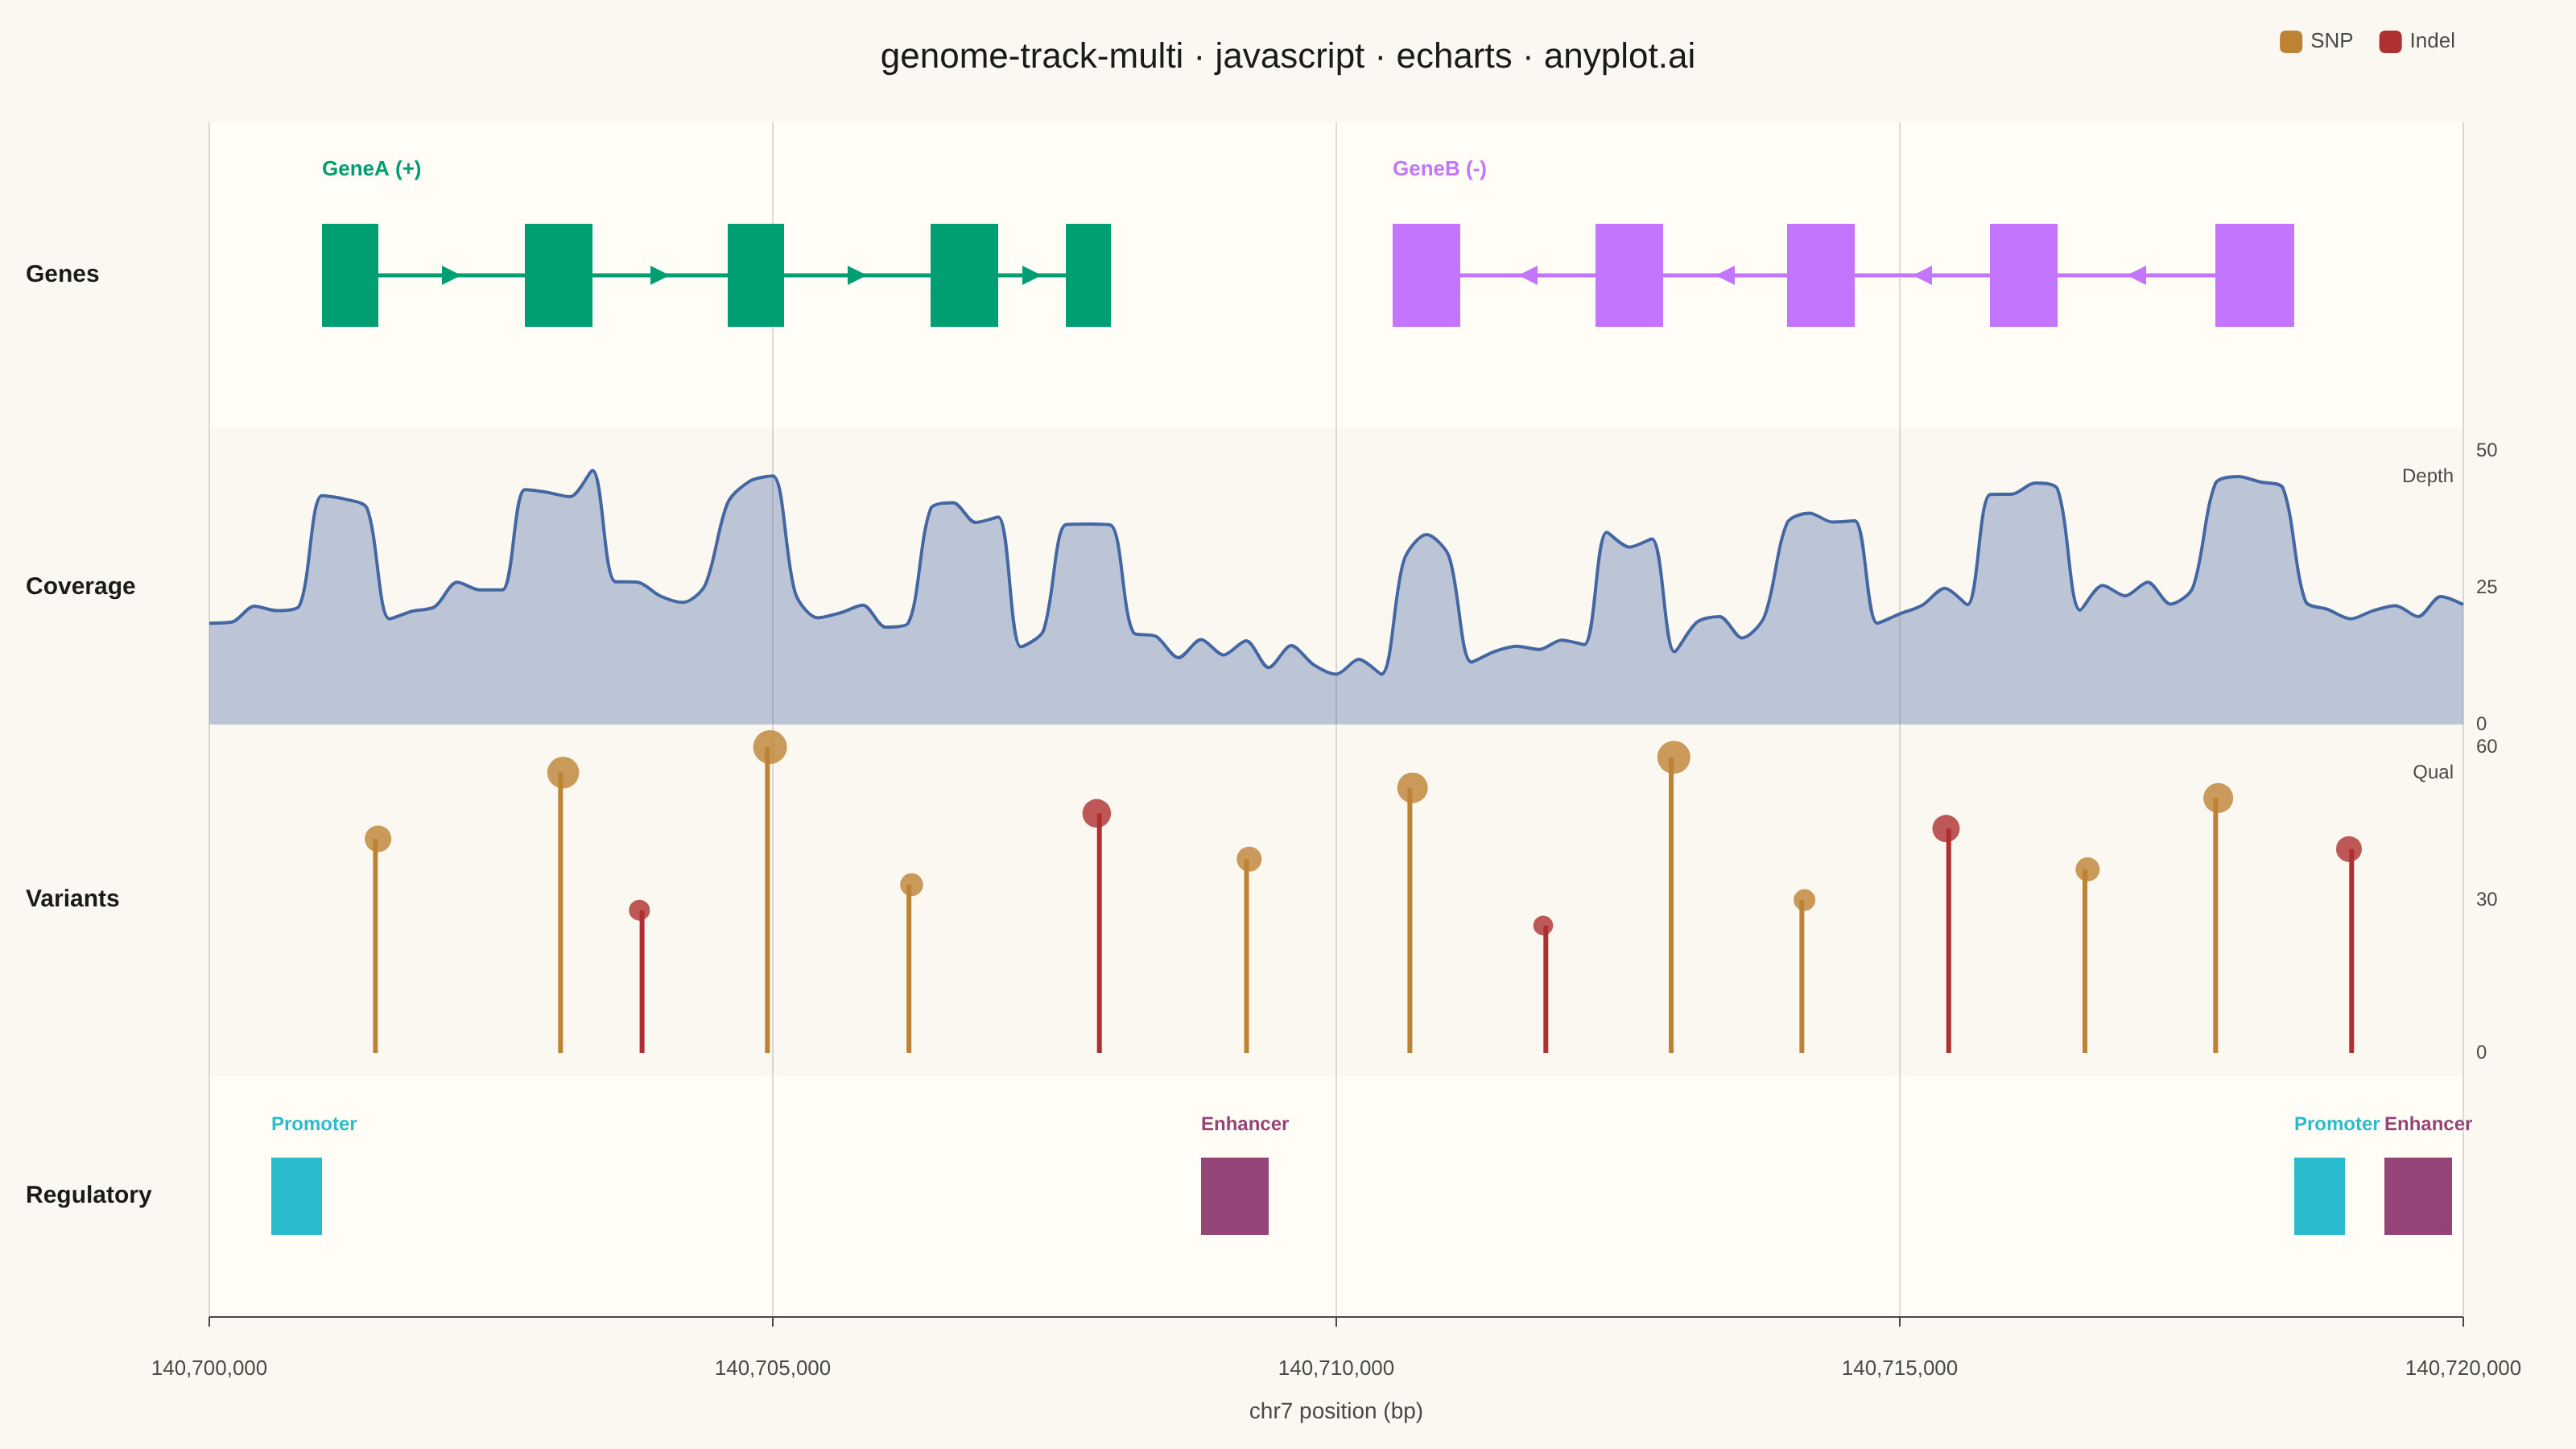
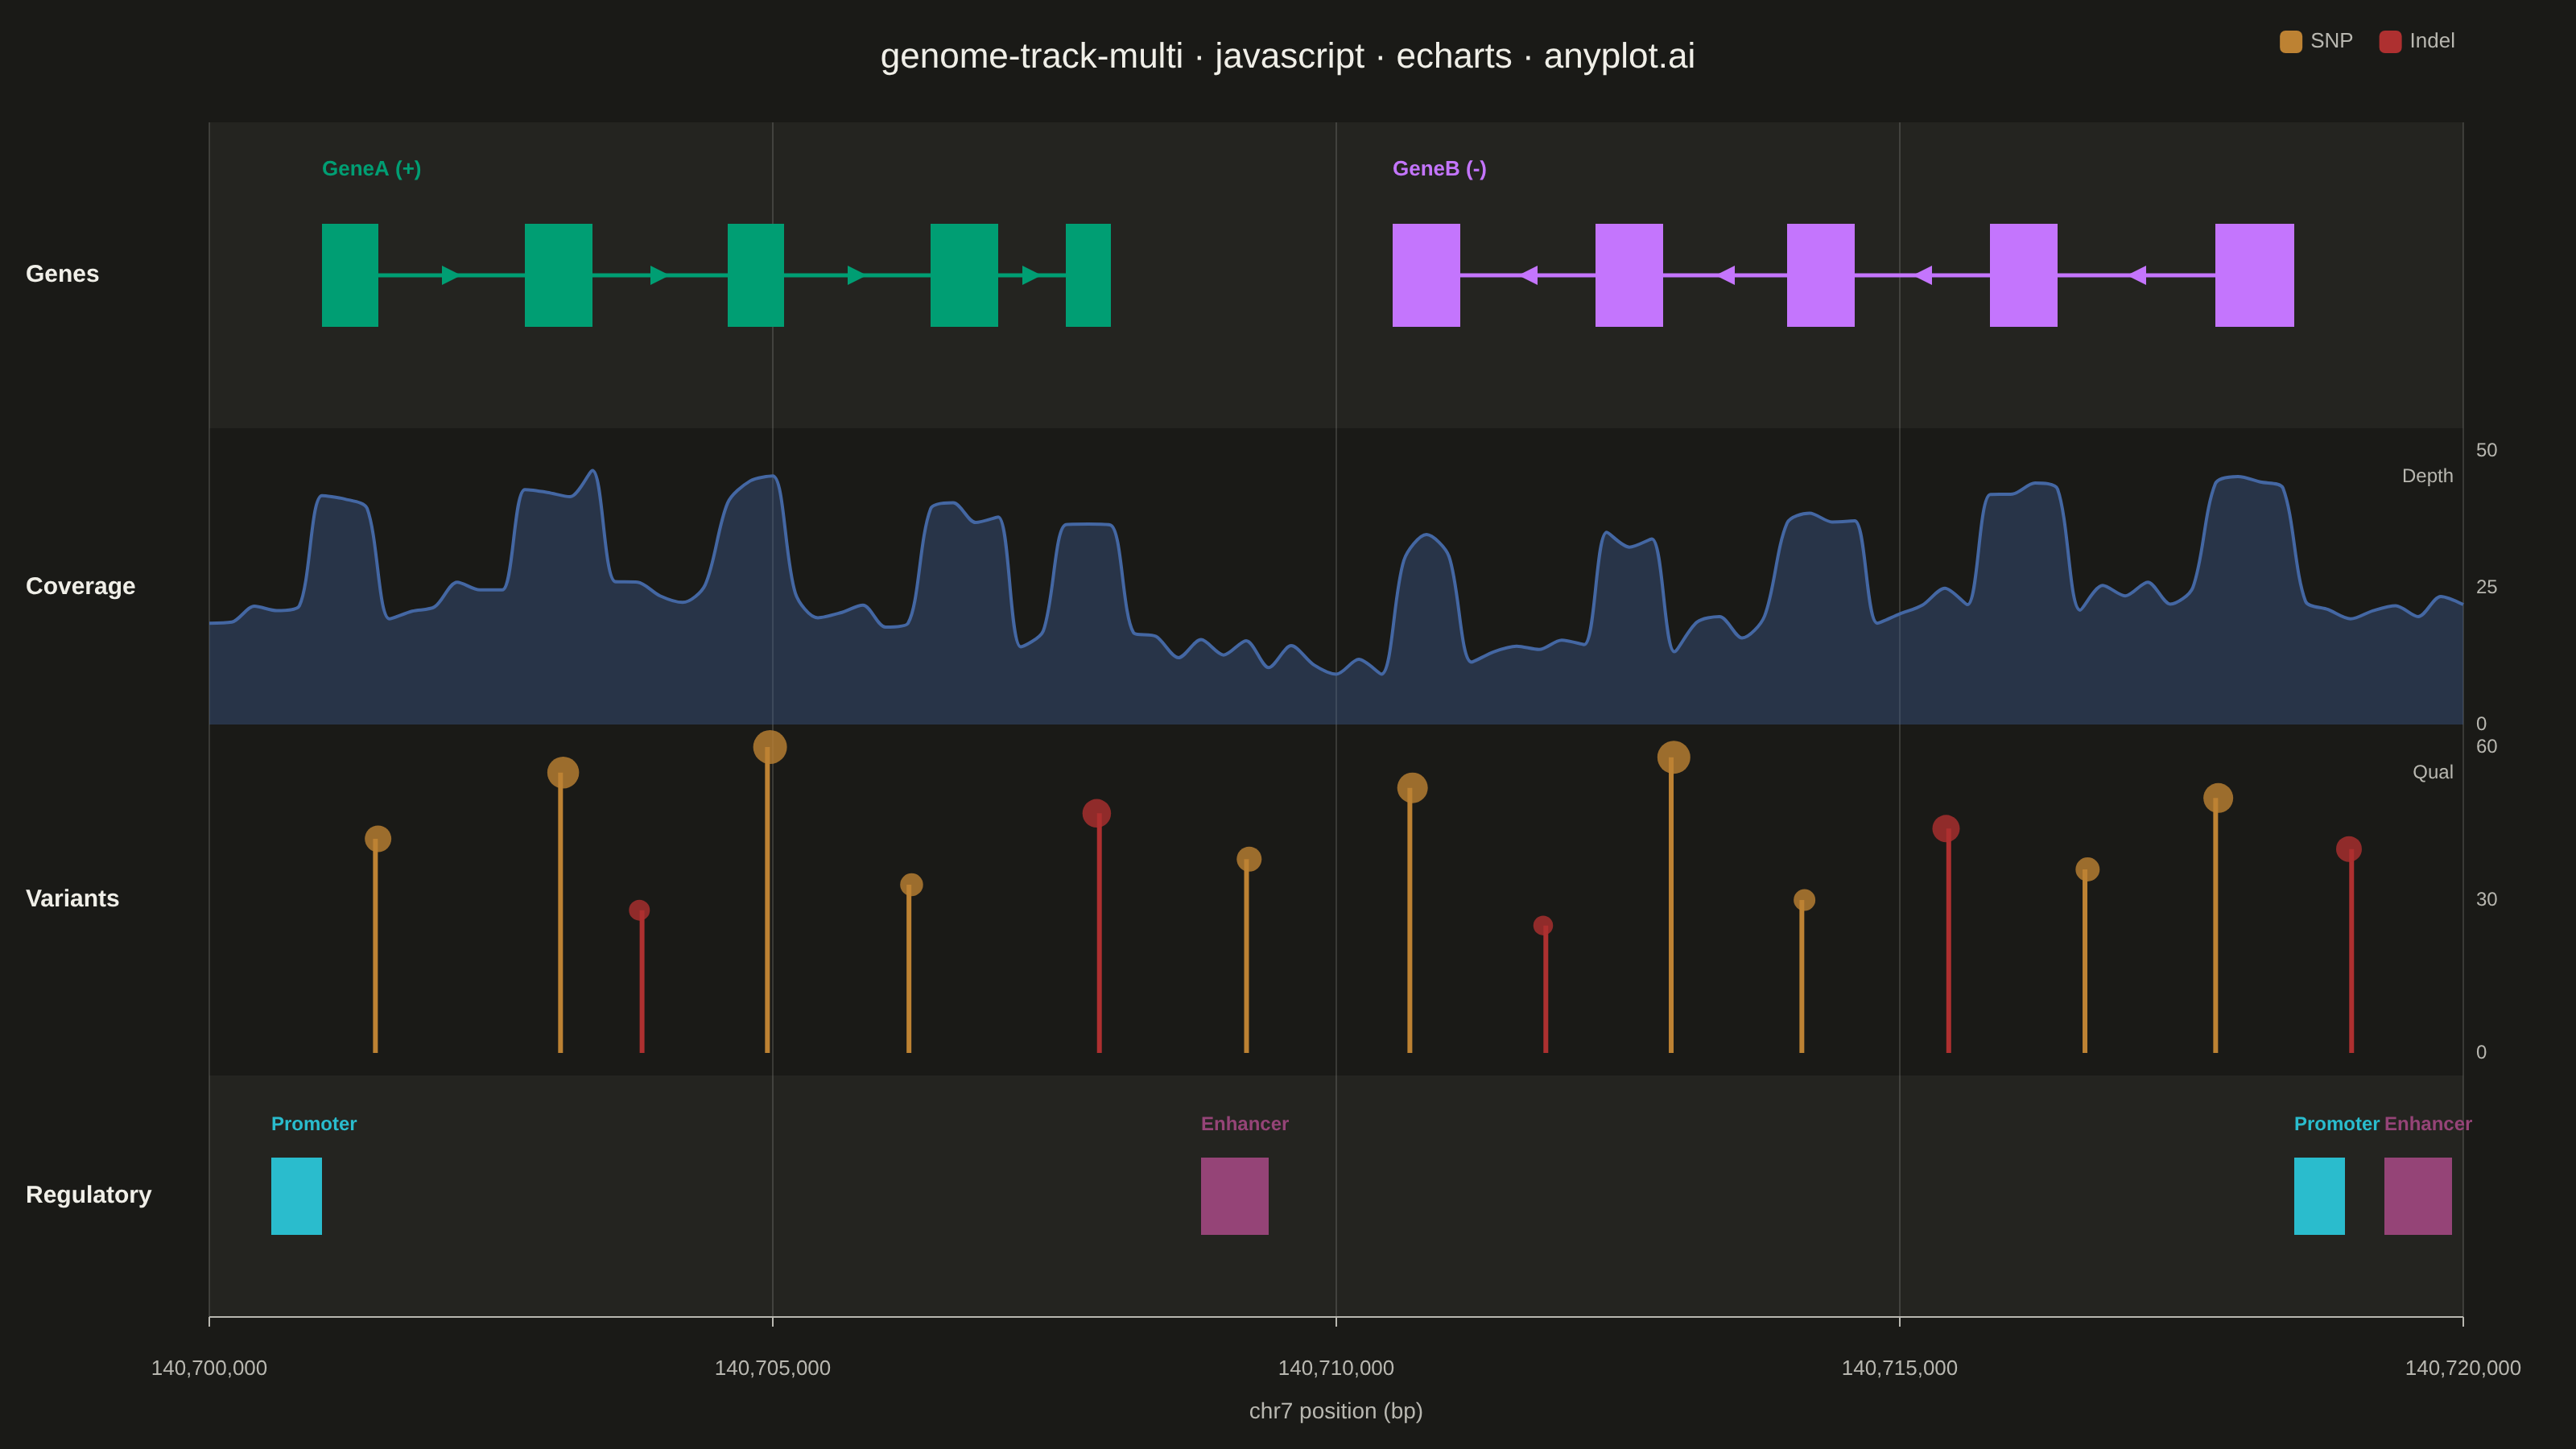
The same plot in 14 other libraries — JavaScript: Chart.js, D3.js, Highcharts, MUI X Charts; Python: Altair, Bokeh, lets-plot, Matplotlib, Plotly, plotnine, Pygal, Seaborn; R: ggplot2; Julia: Makie.jl. Compare all 15 side by side: Genome Track Viewer in Python, R, Julia and JavaScript.
A multi-track genome browser view that displays different types of genomic data aligned along a shared chromosomal coordinate axis. Multiple parallel horizontal tracks (gene annotations, read coverage, variants, regulatory elements) are stacked vertically, each showing a different data type at the same genomic locus. This visualization is essential for integrative genomics, enabling researchers to explore relationships between gene structure, expression, variation, and regulation in a single coordinated view.
// anyplot.ai
// genome-track-multi: Genome Track Viewer
// Library: echarts 6.1.0 | JavaScript 22.23.2
// Quality: 92/100 | Created: 2026-08-25

//# anyplot-orientation: landscape
const t = window.ANYPLOT_TOKENS;

// --- Deterministic PRNG (LCG, no Math.random in the browser) ---------------
let seed = 42;
function rand() {
  seed = (seed * 1103515245 + 12345) & 0x7fffffff;
  return seed / 0x7fffffff;
}

// --- Genomic region ----------------------------------------------------
const CHROM = "chr7";
const REGION_START = 140700000;
const REGION_END = 140720000;

// --- Gene models (exon/intron structure, strand +/-) ------------------------
const genes = [
  {
    name: "GeneA",
    strand: "+",
    color: t.palette[0],
    exons: [
      [140701000, 140701500],
      [140702800, 140703400],
      [140704600, 140705100],
      [140706400, 140707000],
      [140707600, 140708000],
    ],
  },
  {
    name: "GeneB",
    strand: "-",
    color: t.palette[1],
    exons: [
      [140710500, 140711100],
      [140712300, 140712900],
      [140714000, 140714600],
      [140715800, 140716400],
      [140717800, 140718500],
    ],
  },
];

// --- Coverage track (read depth sampled every 200 bp) -----------------------
function insideExon(pos) {
  return genes.some((gene) => gene.exons.some(([s, e]) => pos >= s && pos <= e));
}
const coveragePositions = [];
for (let x = REGION_START; x <= REGION_END; x += 200) coveragePositions.push(x);
const coverageValues = coveragePositions.map((x) => {
  const baseline = 18 + 6 * Math.sin((x - REGION_START) / 2200);
  const exonBump = insideExon(x) ? 20 : 0;
  const noise = (rand() - 0.5) * 6;
  return Math.max(2, Math.round((baseline + exonBump + noise) * 10) / 10);
});

// --- Variant calls (feature_type SNP / Indel, value = quality score) --------
const variants = [
  { pos: 140701200, quality: 42, type: "SNP" },
  { pos: 140702900, quality: 55, type: "SNP" },
  { pos: 140703600, quality: 28, type: "Indel" },
  { pos: 140704800, quality: 60, type: "SNP" },
  { pos: 140706100, quality: 33, type: "SNP" },
  { pos: 140707800, quality: 47, type: "Indel" },
  { pos: 140709200, quality: 38, type: "SNP" },
  { pos: 140710700, quality: 52, type: "SNP" },
  { pos: 140711900, quality: 25, type: "Indel" },
  { pos: 140713100, quality: 58, type: "SNP" },
  { pos: 140714300, quality: 30, type: "SNP" },
  { pos: 140715600, quality: 44, type: "Indel" },
  { pos: 140716900, quality: 36, type: "SNP" },
  { pos: 140718100, quality: 50, type: "SNP" },
  { pos: 140719300, quality: 40, type: "Indel" },
];
const variantColor = { SNP: t.palette[3], Indel: t.palette[4] };

// --- Regulatory elements (promoters / enhancers) ----------------------------
const regulatory = [
  { name: "Promoter", start: 140700550, end: 140701000, color: t.palette[5] },
  { name: "Enhancer", start: 140708800, end: 140709400, color: t.palette[6] },
  { name: "Promoter", start: 140718500, end: 140718950, color: t.palette[5] },
  { name: "Enhancer", start: 140719300, end: 140719900, color: t.palette[6] },
];

// --- Shared pixel layout — one x-mapping reused by every track -------------
const GRID_LEFT = 130;
const GRID_RIGHT = 70;
const GRID_WIDTH = window.ANYPLOT_SIZE.width - GRID_LEFT - GRID_RIGHT;
const xPix = (bp) => GRID_LEFT + ((bp - REGION_START) / (REGION_END - REGION_START)) * GRID_WIDTH;

const GENE_TOP = 76,
  GENE_H = 190,
  GENE_PAD = 15;
const yPixGene = (v) => GENE_TOP + GENE_H - GENE_PAD - (v / 10) * (GENE_H - 2 * GENE_PAD);

const COV_TOP = 280,
  COV_H = 170;
const VAR_TOP = 464,
  VAR_H = 190;

const REG_TOP = 668,
  REG_H = 150,
  REG_PAD = 15;
const yPixReg = (v) => REG_TOP + REG_H - REG_PAD - (v / 10) * (REG_H - 2 * REG_PAD);

const AXIS_Y = 818;

// --- Graphic overlay: track shading, gene models, regulatory rects, axis ---
const graphicEls = [];

// Alternating background bands behind the axis-free tracks
graphicEls.push(
  { type: "rect", z: -10, shape: { x: GRID_LEFT, y: GENE_TOP, width: GRID_WIDTH, height: GENE_H }, style: { fill: t.elevatedBg } },
  { type: "rect", z: -10, shape: { x: GRID_LEFT, y: REG_TOP, width: GRID_WIDTH, height: REG_H }, style: { fill: t.elevatedBg } },
);

// Track name labels (left column, shared by every track)
[
  ["Genes", GENE_TOP + GENE_H / 2],
  ["Coverage", COV_TOP + COV_H / 2],
  ["Variants", VAR_TOP + VAR_H / 2],
  ["Regulatory", REG_TOP + REG_H / 2],
].forEach(([label, y]) => {
  graphicEls.push({
    type: "text",
    x: 16,
    y,
    style: { text: label, fill: t.ink, fontSize: 15, fontWeight: "bold", textVerticalAlign: "middle" },
  });
});

// Gene models: intron backbone, exon blocks, strand chevrons, name labels
genes.forEach((gene) => {
  const gStart = gene.exons[0][0];
  const gEnd = gene.exons[gene.exons.length - 1][1];
  const yMid = yPixGene(5);

  graphicEls.push({
    type: "line",
    shape: { x1: xPix(gStart), y1: yMid, x2: xPix(gEnd), y2: yMid },
    style: { stroke: gene.color, lineWidth: 2.5 },
  });

  gene.exons.forEach(([s, e]) => {
    graphicEls.push({
      type: "rect",
      shape: { x: xPix(s), y: yPixGene(7), width: xPix(e) - xPix(s), height: yPixGene(3) - yPixGene(7) },
      style: { fill: gene.color },
    });
  });

  for (let i = 0; i < gene.exons.length - 1; i++) {
    const midX = xPix((gene.exons[i][1] + gene.exons[i + 1][0]) / 2);
    const dir = gene.strand === "+" ? 1 : -1;
    const half = 6;
    graphicEls.push({
      type: "polygon",
      shape: {
        points: [
          [midX - dir * half, yMid - half],
          [midX + dir * half, yMid],
          [midX - dir * half, yMid + half],
        ],
      },
      style: { fill: gene.color },
    });
  }

  graphicEls.push({
    type: "text",
    x: xPix(gStart),
    y: yPixGene(9.5),
    style: { text: `${gene.name} (${gene.strand})`, fill: gene.color, fontSize: 13, fontWeight: "bold" },
  });
});

// Regulatory rectangles + name labels
regulatory.forEach((r) => {
  graphicEls.push({
    type: "rect",
    shape: { x: xPix(r.start), y: yPixReg(7), width: xPix(r.end) - xPix(r.start), height: yPixReg(3) - yPixReg(7) },
    style: { fill: r.color },
  });
  graphicEls.push({
    type: "text",
    x: xPix(r.start),
    y: yPixReg(9.2),
    style: { text: r.name, fill: r.color, fontSize: 12, fontWeight: "bold" },
  });
});

// Shared genomic-position axis + vertical alignment guides across all tracks
const ticks = [];
for (let x = REGION_START; x <= REGION_END; x += 5000) ticks.push(x);

graphicEls.push({
  type: "line",
  shape: { x1: GRID_LEFT, y1: AXIS_Y, x2: GRID_LEFT + GRID_WIDTH, y2: AXIS_Y },
  style: { stroke: t.inkSoft, lineWidth: 1 },
});

ticks.forEach((x) => {
  const px = xPix(x);
  graphicEls.push(
    { type: "line", z: -10, shape: { x1: px, y1: GENE_TOP, x2: px, y2: AXIS_Y }, style: { stroke: t.grid, lineWidth: 1 } },
    { type: "line", shape: { x1: px, y1: AXIS_Y, x2: px, y2: AXIS_Y + 6 }, style: { stroke: t.inkSoft, lineWidth: 1 } },
    { type: "text", x: px, y: AXIS_Y + 26, style: { text: x.toLocaleString("en-US"), fill: t.inkSoft, fontSize: 13, textAlign: "center" } },
  );
});

graphicEls.push({
  type: "text",
  x: GRID_LEFT + GRID_WIDTH / 2,
  y: AXIS_Y + 52,
  style: { text: `${CHROM} position (bp)`, fill: t.inkSoft, fontSize: 14, textAlign: "center" },
});

// Value-axis unit labels, tucked inside the top-right corner of their track
graphicEls.push(
  { type: "text", x: GRID_LEFT + GRID_WIDTH - 6, y: COV_TOP + 10, style: { text: "Depth", fill: t.inkSoft, fontSize: 12, textAlign: "right" } },
  { type: "text", x: GRID_LEFT + GRID_WIDTH - 6, y: VAR_TOP + 10, style: { text: "Qual", fill: t.inkSoft, fontSize: 12, textAlign: "right" } },
);

// --- Chart option ------------------------------------------------------
const chart = echarts.init(document.getElementById("container"));
chart.setOption({
  animation: false,
  color: t.palette,
  backgroundColor: "transparent",
  title: {
    text: "genome-track-multi · javascript · echarts · anyplot.ai",
    left: "center",
    top: 20,
    textStyle: { color: t.ink, fontSize: 22, fontWeight: "normal" },
  },
  legend: {
    data: ["SNP", "Indel"],
    top: 14,
    right: GRID_RIGHT,
    itemWidth: 14,
    itemHeight: 14,
    itemGap: 16,
    textStyle: { color: t.inkSoft, fontSize: 13 },
  },
  grid: [
    { left: GRID_LEFT, right: GRID_RIGHT, top: COV_TOP, height: COV_H },
    { left: GRID_LEFT, right: GRID_RIGHT, top: VAR_TOP, height: VAR_H },
  ],
  xAxis: [
    { gridIndex: 0, type: "value", min: REGION_START, max: REGION_END, show: false },
    { gridIndex: 1, type: "value", min: REGION_START, max: REGION_END, show: false },
  ],
  yAxis: [
    {
      gridIndex: 0,
      type: "value",
      min: 0,
      max: 50,
      interval: 25,
      position: "right",
      axisLine: { show: false },
      axisTick: { show: false },
      axisLabel: { color: t.inkSoft, fontSize: 12 },
      splitLine: { show: false },
    },
    {
      gridIndex: 1,
      type: "value",
      min: 0,
      max: 60,
      interval: 30,
      position: "right",
      axisLine: { show: false },
      axisTick: { show: false },
      axisLabel: { color: t.inkSoft, fontSize: 12 },
      splitLine: { show: false },
    },
  ],
  series: [
    {
      name: "Coverage",
      type: "line",
      xAxisIndex: 0,
      yAxisIndex: 0,
      data: coveragePositions.map((x, i) => [x, coverageValues[i]]),
      showSymbol: false,
      smooth: 0.3,
      lineStyle: { color: t.palette[2], width: 2 },
      areaStyle: { color: t.palette[2], opacity: 0.35 },
    },
    {
      name: "SNP",
      type: "bar",
      xAxisIndex: 1,
      yAxisIndex: 1,
      barWidth: 3,
      itemStyle: { color: variantColor.SNP },
      data: variants
        .filter((v) => v.type === "SNP")
        .map((v) => ({ value: [v.pos, v.quality], itemStyle: { color: variantColor.SNP } })),
    },
    {
      name: "Indel",
      type: "bar",
      xAxisIndex: 1,
      yAxisIndex: 1,
      barWidth: 3,
      itemStyle: { color: variantColor.Indel },
      data: variants
        .filter((v) => v.type === "Indel")
        .map((v) => ({ value: [v.pos, v.quality], itemStyle: { color: variantColor.Indel } })),
    },
    {
      name: "SNP",
      type: "scatter",
      xAxisIndex: 1,
      yAxisIndex: 1,
      symbolSize: (val) => 6 + val[1] * 0.25,
      legendHoverLink: false,
      itemStyle: { color: variantColor.SNP },
      data: variants
        .filter((v) => v.type === "SNP")
        .map((v) => ({ value: [v.pos, v.quality], itemStyle: { color: variantColor.SNP } })),
    },
    {
      name: "Indel",
      type: "scatter",
      xAxisIndex: 1,
      yAxisIndex: 1,
      symbolSize: (val) => 6 + val[1] * 0.25,
      legendHoverLink: false,
      itemStyle: { color: variantColor.Indel },
      data: variants
        .filter((v) => v.type === "Indel")
        .map((v) => ({ value: [v.pos, v.quality], itemStyle: { color: variantColor.Indel } })),
    },
  ],
  graphic: { elements: graphicEls },
});
Runnable source as JSON, for any HTTP client: https://api.anyplot.ai/specs/genome-track-multi/echarts/code. Any spec id and library id listed in llms-full.txt fit the same URL shape; every URL below is complete and callable.
{
  "spec_id": "genome-track-multi",
  "language": "javascript",
  "library": "echarts",
  "page": "https://anyplot.ai/genome-track-multi/javascript/echarts",
  "hub": "https://anyplot.ai/genome-track-multi",
  "code_json": "https://api.anyplot.ai/specs/genome-track-multi/echarts/code",
  "spec_json": "https://api.anyplot.ai/specs/genome-track-multi",
  "render_light_png": "https://storage.googleapis.com/anyplot-images/plots/genome-track-multi/javascript/echarts/plot-light.png",
  "render_dark_png": "https://storage.googleapis.com/anyplot-images/plots/genome-track-multi/javascript/echarts/plot-dark.png",
  "interactive_light_html": "https://storage.googleapis.com/anyplot-images/plots/genome-track-multi/javascript/echarts/plot-light.html",
  "interactive_dark_html": "https://storage.googleapis.com/anyplot-images/plots/genome-track-multi/javascript/echarts/plot-dark.html",
  "quality_score": 92.0,
  "license": "MIT",
  "guide": "https://anyplot.ai/llms.txt"
}
Part of Genome Track Viewer on anyplot.ai.