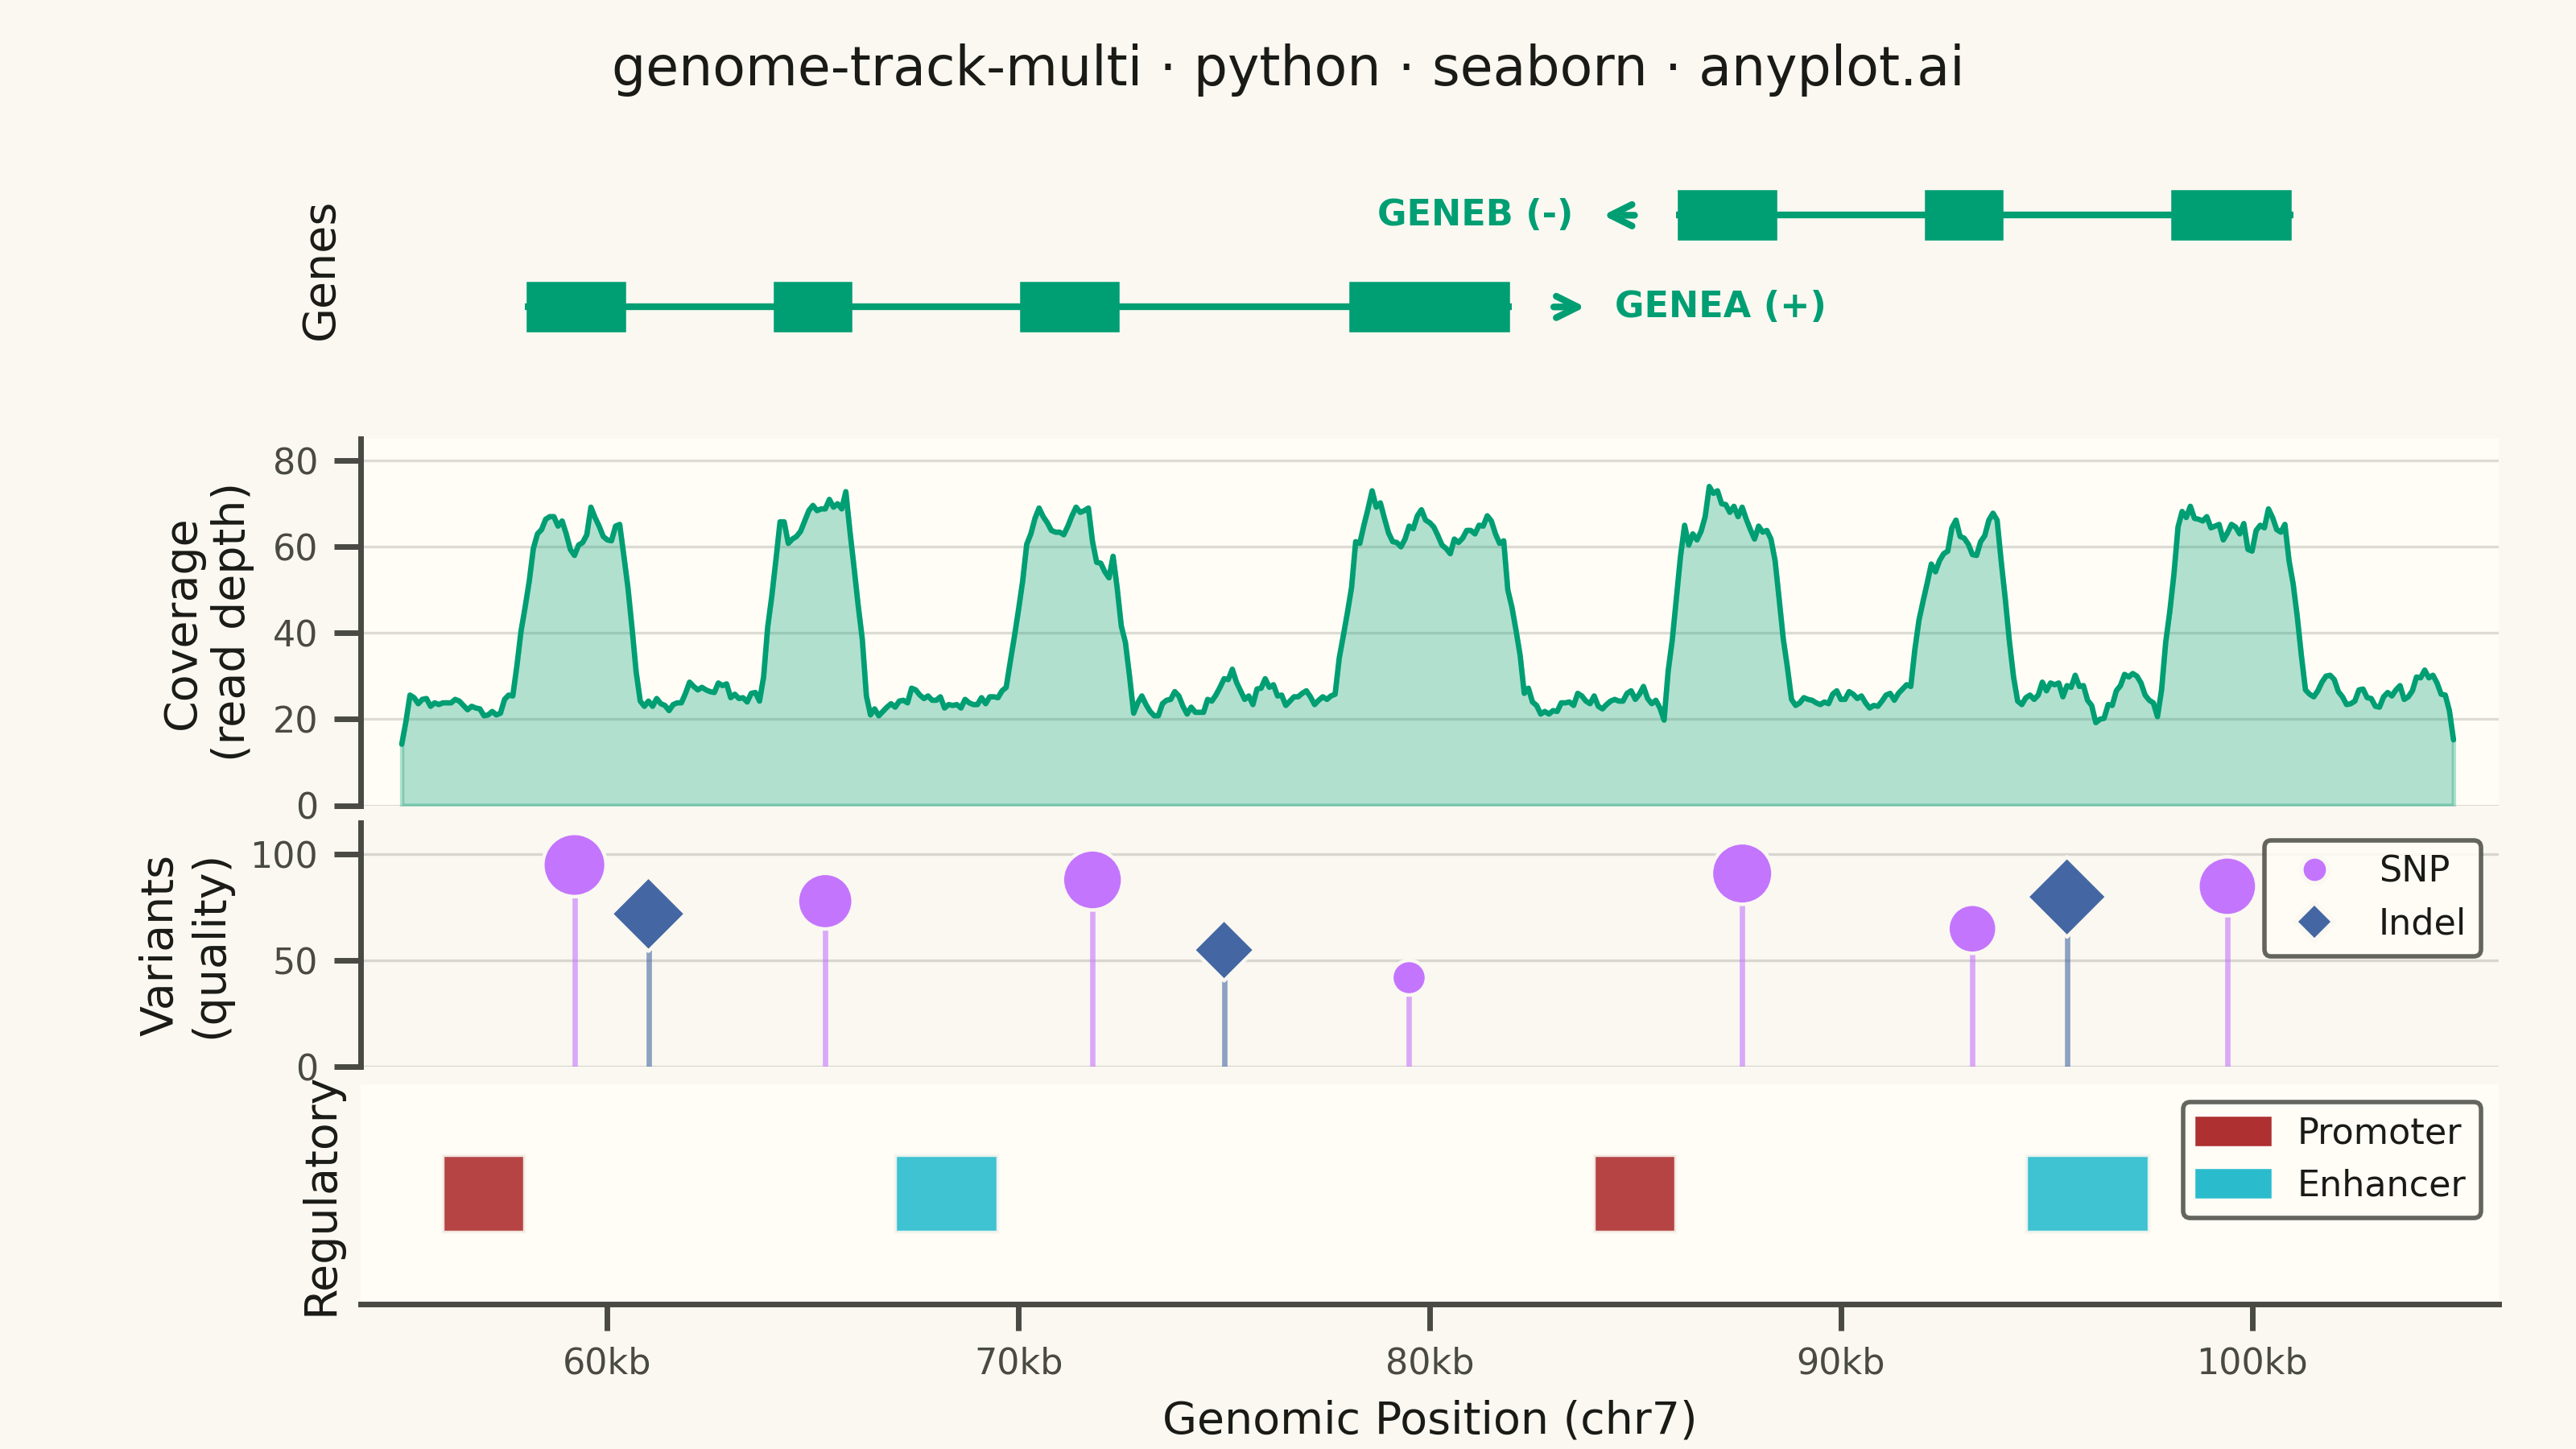
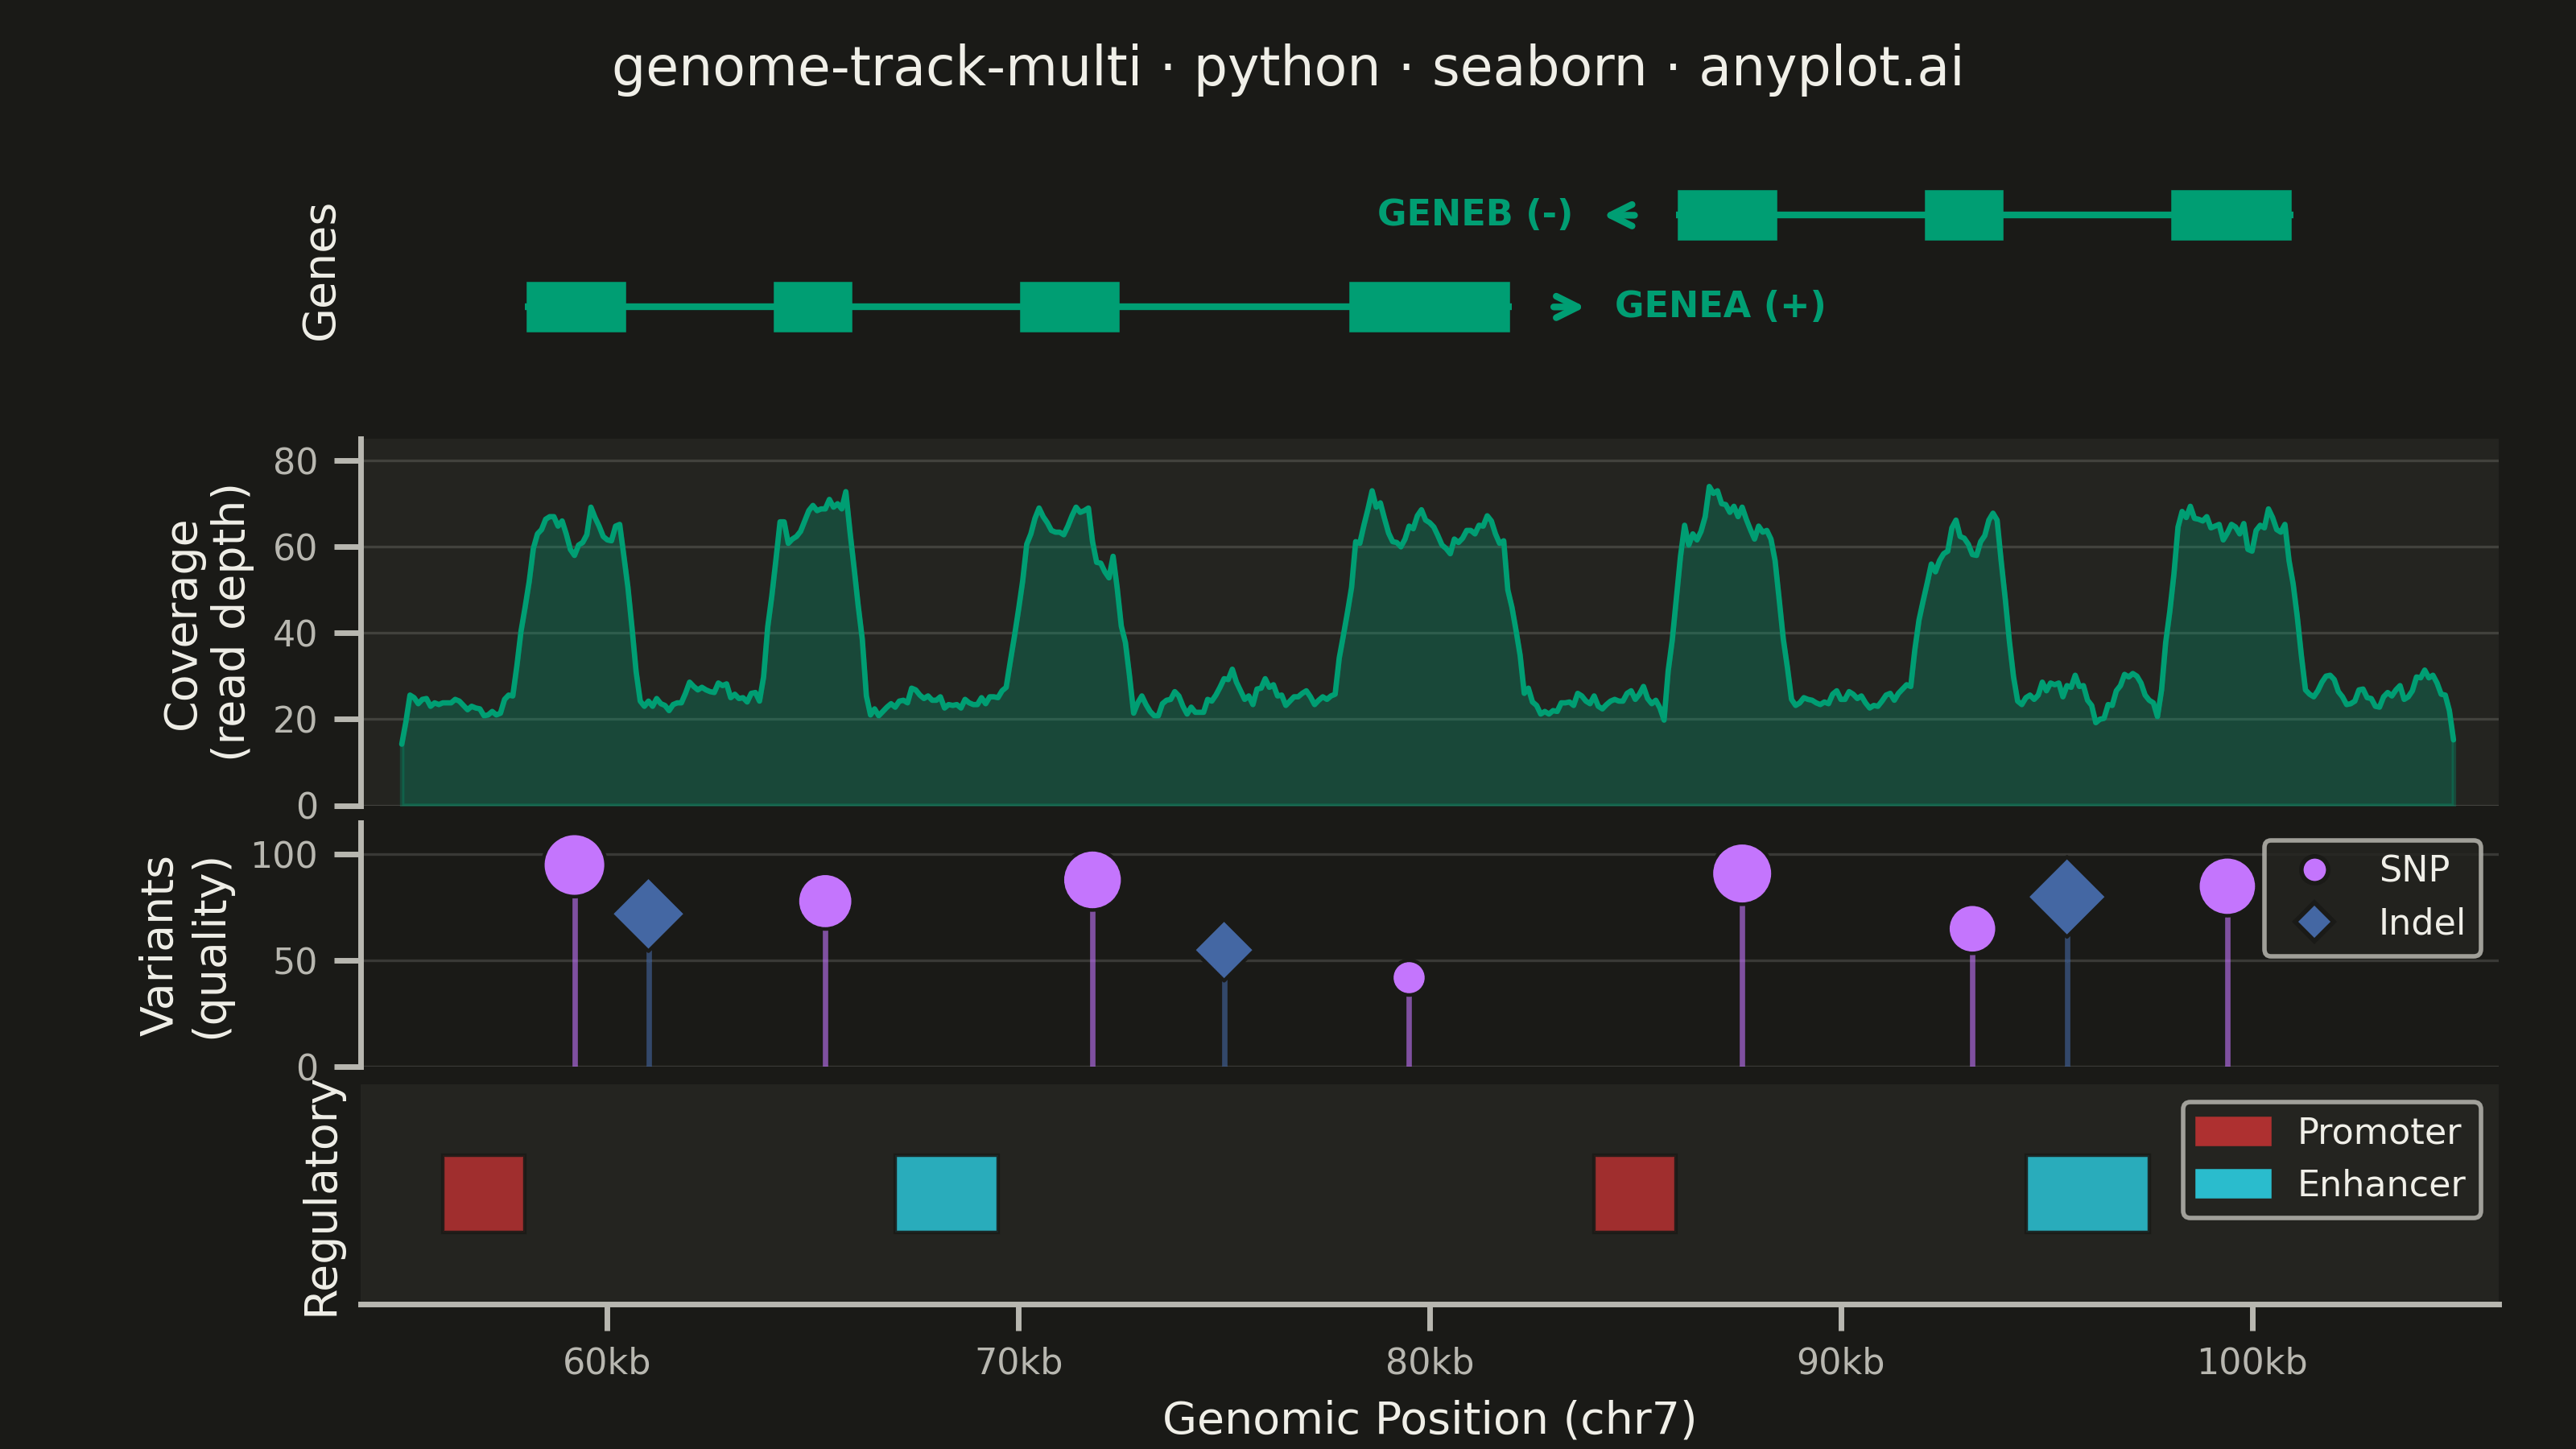
A multi-track genome browser view that displays different types of genomic data aligned along a shared chromosomal coordinate axis. Multiple parallel horizontal tracks (gene annotations, read coverage, variants, regulatory elements) are stacked vertically, each showing a different data type at the same genomic locus. This visualization is essential for integrative genomics, enabling researchers to explore relationships between gene structure, expression, variation, and regulation in a single coordinated view.
""" anyplot.ai
genome-track-multi: Genome Track Viewer
Library: seaborn 0.13.2 | Python 3.13.13
Quality: 90/100 | Updated: 2026-06-02
"""

import os

import matplotlib.lines as mlines
import matplotlib.patches as mpatches
import matplotlib.pyplot as plt
import numpy as np
import pandas as pd
import seaborn as sns


# Theme tokens (Imprint palette)
THEME = os.getenv("ANYPLOT_THEME", "light")
PAGE_BG = "#FAF8F1" if THEME == "light" else "#1A1A17"
ELEVATED_BG = "#FFFDF6" if THEME == "light" else "#242420"
INK = "#1A1A17" if THEME == "light" else "#F0EFE8"
INK_SOFT = "#4A4A44" if THEME == "light" else "#B8B7B0"

# Imprint categorical palette — canonical order
IMPRINT_PALETTE = ["#009E73", "#C475FD", "#4467A3", "#BD8233", "#AE3030", "#2ABCCD", "#954477", "#99B314"]
BRAND = IMPRINT_PALETTE[0]  # #009E73 — always first series

# Seaborn theme with Imprint chrome tokens
sns.set_theme(
    style="ticks",
    rc={
        "figure.facecolor": PAGE_BG,
        "axes.facecolor": PAGE_BG,
        "axes.edgecolor": INK_SOFT,
        "axes.labelcolor": INK,
        "text.color": INK,
        "xtick.color": INK_SOFT,
        "ytick.color": INK_SOFT,
        "grid.color": INK,
        "grid.alpha": 0.15,
        "legend.facecolor": ELEVATED_BG,
        "legend.edgecolor": INK_SOFT,
    },
)

np.random.seed(42)

# Genomic region: chr7, 50 kb window around a kinase gene cluster
chrom = "chr7"
region_start = 55_000
region_end = 105_000

# Gene track — two protein-coding genes on opposite strands
genes = [
    {
        "name": "GENEA",
        "strand": "+",
        "start": 58_000,
        "end": 82_000,
        "exons": [(58_000, 60_500), (64_000, 66_000), (70_000, 72_500), (78_000, 82_000)],
    },
    {
        "name": "GENEB",
        "strand": "-",
        "start": 86_000,
        "end": 101_000,
        "exons": [(86_000, 88_500), (92_000, 94_000), (98_000, 101_000)],
    },
]

# Coverage track — read depth with exon-correlated peaks (RNA-seq)
positions = np.arange(region_start, region_end, 100)
base_coverage = np.random.poisson(25, len(positions)).astype(float)
for gene in genes:
    for exon_start, exon_end in gene["exons"]:
        mask = (positions >= exon_start) & (positions <= exon_end)
        base_coverage[mask] += np.random.poisson(40, mask.sum())
coverage = np.convolve(base_coverage, np.ones(5) / 5, mode="same")
coverage_df = pd.DataFrame({"position": positions, "depth": coverage})

# Variant track — SNPs and indels with GATK quality scores
variant_df = pd.DataFrame(
    {
        "position": [59_200, 65_300, 71_800, 79_500, 87_600, 93_200, 99_400, 61_000, 75_000, 95_500],
        "type": ["SNP", "SNP", "SNP", "SNP", "SNP", "SNP", "SNP", "Indel", "Indel", "Indel"],
        "quality": [95, 78, 88, 42, 91, 65, 85, 72, 55, 80],
    }
)

# Regulatory track — promoters and enhancers from ChIP-seq peaks
regulatory = [
    {"type": "Promoter", "start": 56_000, "end": 58_000},
    {"type": "Enhancer", "start": 67_000, "end": 69_500},
    {"type": "Promoter", "start": 84_000, "end": 86_000},
    {"type": "Enhancer", "start": 94_500, "end": 97_500},
]

# Track colors from Imprint palette
gene_color = BRAND  # #009E73 — first series
snp_color = IMPRINT_PALETTE[1]  # #C475FD
indel_color = IMPRINT_PALETTE[2]  # #4467A3
promoter_color = IMPRINT_PALETTE[4]  # #AE3030
enhancer_color = IMPRINT_PALETTE[5]  # #2ABCCD

# Plot — landscape 3200×1800, 4 stacked tracks
fig, axes = plt.subplots(4, 1, figsize=(8, 4.5), dpi=400, height_ratios=[2.5, 3, 2, 1.8], facecolor=PAGE_BG)
fig.subplots_adjust(hspace=0.06, left=0.14, right=0.97, top=0.92, bottom=0.10)

title = "genome-track-multi · python · seaborn · anyplot.ai"
n = len(title)
title_fs = round(12 * 67 / n) if n > 67 else 12
fig.suptitle(title, fontsize=title_fs, fontweight="medium", color=INK, y=0.97)

# -- Track 1: Gene annotations --
ax_gene = axes[0]
ax_gene.set_facecolor(PAGE_BG)
ax_gene.set_ylim(-1.5, 2.5)
ax_gene.set_xlim(region_start - 1_000, region_end + 1_000)

for i, gene in enumerate(genes):
    y_center = 1.2 * i
    ax_gene.plot(
        [gene["start"], gene["end"]], [y_center, y_center], color=gene_color, linewidth=1.5, solid_capstyle="butt"
    )
    for exon_start, exon_end in gene["exons"]:
        rect = mpatches.Rectangle(
            (exon_start, y_center - 0.35),
            exon_end - exon_start,
            0.7,
            facecolor=gene_color,
            edgecolor=PAGE_BG,
            linewidth=0.8,
        )
        ax_gene.add_patch(rect)
    arrow_x = gene["end"] + 800 if gene["strand"] == "+" else gene["start"] - 800
    arrow_dx = 1_200 if gene["strand"] == "+" else -1_200
    ax_gene.annotate(
        "",
        xy=(arrow_x + arrow_dx, y_center),
        xytext=(arrow_x, y_center),
        arrowprops={"arrowstyle": "->", "color": gene_color, "lw": 1.5},
    )
    label_x = gene["end"] + 2_500 if gene["strand"] == "+" else gene["start"] - 2_500
    ha = "left" if gene["strand"] == "+" else "right"
    ax_gene.text(
        label_x,
        y_center,
        f"{gene['name']} ({gene['strand']})",
        fontsize=8,
        fontweight="bold",
        color=gene_color,
        va="center",
        ha=ha,
    )

ax_gene.set_ylabel("Genes", fontsize=10, fontweight="medium", color=INK)
ax_gene.set_yticks([])
ax_gene.set_xticks([])
sns.despine(ax=ax_gene, left=True, bottom=True)

# -- Track 2: Coverage (seaborn lineplot with filled area) --
ax_cov = axes[1]
ax_cov.set_facecolor(ELEVATED_BG)
sns.lineplot(data=coverage_df, x="position", y="depth", color=gene_color, linewidth=1.2, ax=ax_cov)
ax_cov.fill_between(coverage_df["position"], coverage_df["depth"], alpha=0.3, color=gene_color)
ax_cov.set_xlim(region_start - 1_000, region_end + 1_000)
ax_cov.set_ylabel("Coverage\n(read depth)", fontsize=10, fontweight="medium", color=INK)
ax_cov.set_ylim(0, coverage.max() * 1.15)
ax_cov.set_xlabel("")
ax_cov.set_xticks([])
ax_cov.tick_params(axis="y", labelsize=8, colors=INK_SOFT)
ax_cov.yaxis.grid(True, alpha=0.15, linewidth=0.6, color=INK)
sns.despine(ax=ax_cov, bottom=True)

# -- Track 3: Variants — seaborn scatterplot with hue, style, and size encoding --
ax_var = axes[2]
ax_var.set_facecolor(PAGE_BG)
for _, row in variant_df.iterrows():
    clr = snp_color if row["type"] == "SNP" else indel_color
    ax_var.plot([row["position"], row["position"]], [0, row["quality"]], color=clr, linewidth=1.2, alpha=0.6)
# size="quality" encodes confidence as marker area — a distinctive seaborn feature
sns.scatterplot(
    data=variant_df,
    x="position",
    y="quality",
    hue="type",
    style="type",
    size="quality",
    sizes=(60, 200),
    markers={"SNP": "o", "Indel": "D"},
    palette={"SNP": snp_color, "Indel": indel_color},
    edgecolor=PAGE_BG,
    linewidth=0.8,
    zorder=3,
    ax=ax_var,
    legend=False,
)
snp_handle = mlines.Line2D(
    [], [], color=snp_color, marker="o", markersize=6, linewidth=0, markeredgecolor=PAGE_BG, label="SNP"
)
indel_handle = mlines.Line2D(
    [], [], color=indel_color, marker="D", markersize=6, linewidth=0, markeredgecolor=PAGE_BG, label="Indel"
)
ax_var.legend(
    handles=[snp_handle, indel_handle],
    fontsize=8,
    loc="upper right",
    framealpha=0.85,
    facecolor=ELEVATED_BG,
    edgecolor=INK_SOFT,
)
ax_var.set_xlim(region_start - 1_000, region_end + 1_000)
ax_var.set_ylabel("Variants\n(quality)", fontsize=10, fontweight="medium", color=INK)
ax_var.set_ylim(0, 115)
ax_var.set_xlabel("")
ax_var.set_xticks([])
ax_var.tick_params(axis="y", labelsize=8, colors=INK_SOFT)
ax_var.yaxis.grid(True, alpha=0.15, linewidth=0.6, color=INK)
sns.despine(ax=ax_var, bottom=True)

# -- Track 4: Regulatory elements --
ax_reg = axes[3]
ax_reg.set_facecolor(ELEVATED_BG)
ax_reg.set_ylim(-0.5, 1.5)
for reg in regulatory:
    clr = promoter_color if reg["type"] == "Promoter" else enhancer_color
    rect = mpatches.Rectangle(
        (reg["start"], 0.15), reg["end"] - reg["start"], 0.7, facecolor=clr, edgecolor=PAGE_BG, linewidth=0.8, alpha=0.9
    )
    ax_reg.add_patch(rect)
prom_handle = mpatches.Patch(color=promoter_color, label="Promoter")
enh_handle = mpatches.Patch(color=enhancer_color, label="Enhancer")
ax_reg.legend(
    handles=[prom_handle, enh_handle],
    fontsize=8,
    loc="upper right",
    framealpha=0.85,
    facecolor=ELEVATED_BG,
    edgecolor=INK_SOFT,
)
ax_reg.set_xlim(region_start - 1_000, region_end + 1_000)
ax_reg.set_ylabel("Regulatory", fontsize=10, fontweight="medium", color=INK)
ax_reg.set_yticks([])
sns.despine(ax=ax_reg, left=True)

# Shared x-axis — shown on bottom track only
ax_reg.set_xlabel(f"Genomic Position ({chrom})", fontsize=10, color=INK)
ax_reg.tick_params(axis="x", labelsize=8, colors=INK_SOFT)
ax_reg.xaxis.set_major_formatter(plt.FuncFormatter(lambda x, _: f"{x / 1000:.0f}kb"))

# Save — bbox_inches must stay default (None) to preserve exact 3200×1800
plt.savefig(f"plot-{THEME}.png", dpi=400, facecolor=PAGE_BG)
Runnable source as JSON, for any HTTP client: https://api.anyplot.ai/specs/genome-track-multi/seaborn/code. Any spec id and library id listed in llms-full.txt fit the same URL shape; every URL below is complete and callable.
{
  "spec_id": "genome-track-multi",
  "language": "python",
  "library": "seaborn",
  "page": "https://anyplot.ai/genome-track-multi/python/seaborn",
  "hub": "https://anyplot.ai/genome-track-multi",
  "code_json": "https://api.anyplot.ai/specs/genome-track-multi/seaborn/code",
  "spec_json": "https://api.anyplot.ai/specs/genome-track-multi",
  "render_light_png": "https://storage.googleapis.com/anyplot-images/plots/genome-track-multi/python/seaborn/plot-light.png",
  "render_dark_png": "https://storage.googleapis.com/anyplot-images/plots/genome-track-multi/python/seaborn/plot-dark.png",
  "quality_score": 90.0,
  "license": "MIT",
  "guide": "https://anyplot.ai/llms.txt"
}
Part of Genome Track Viewer on anyplot.ai.