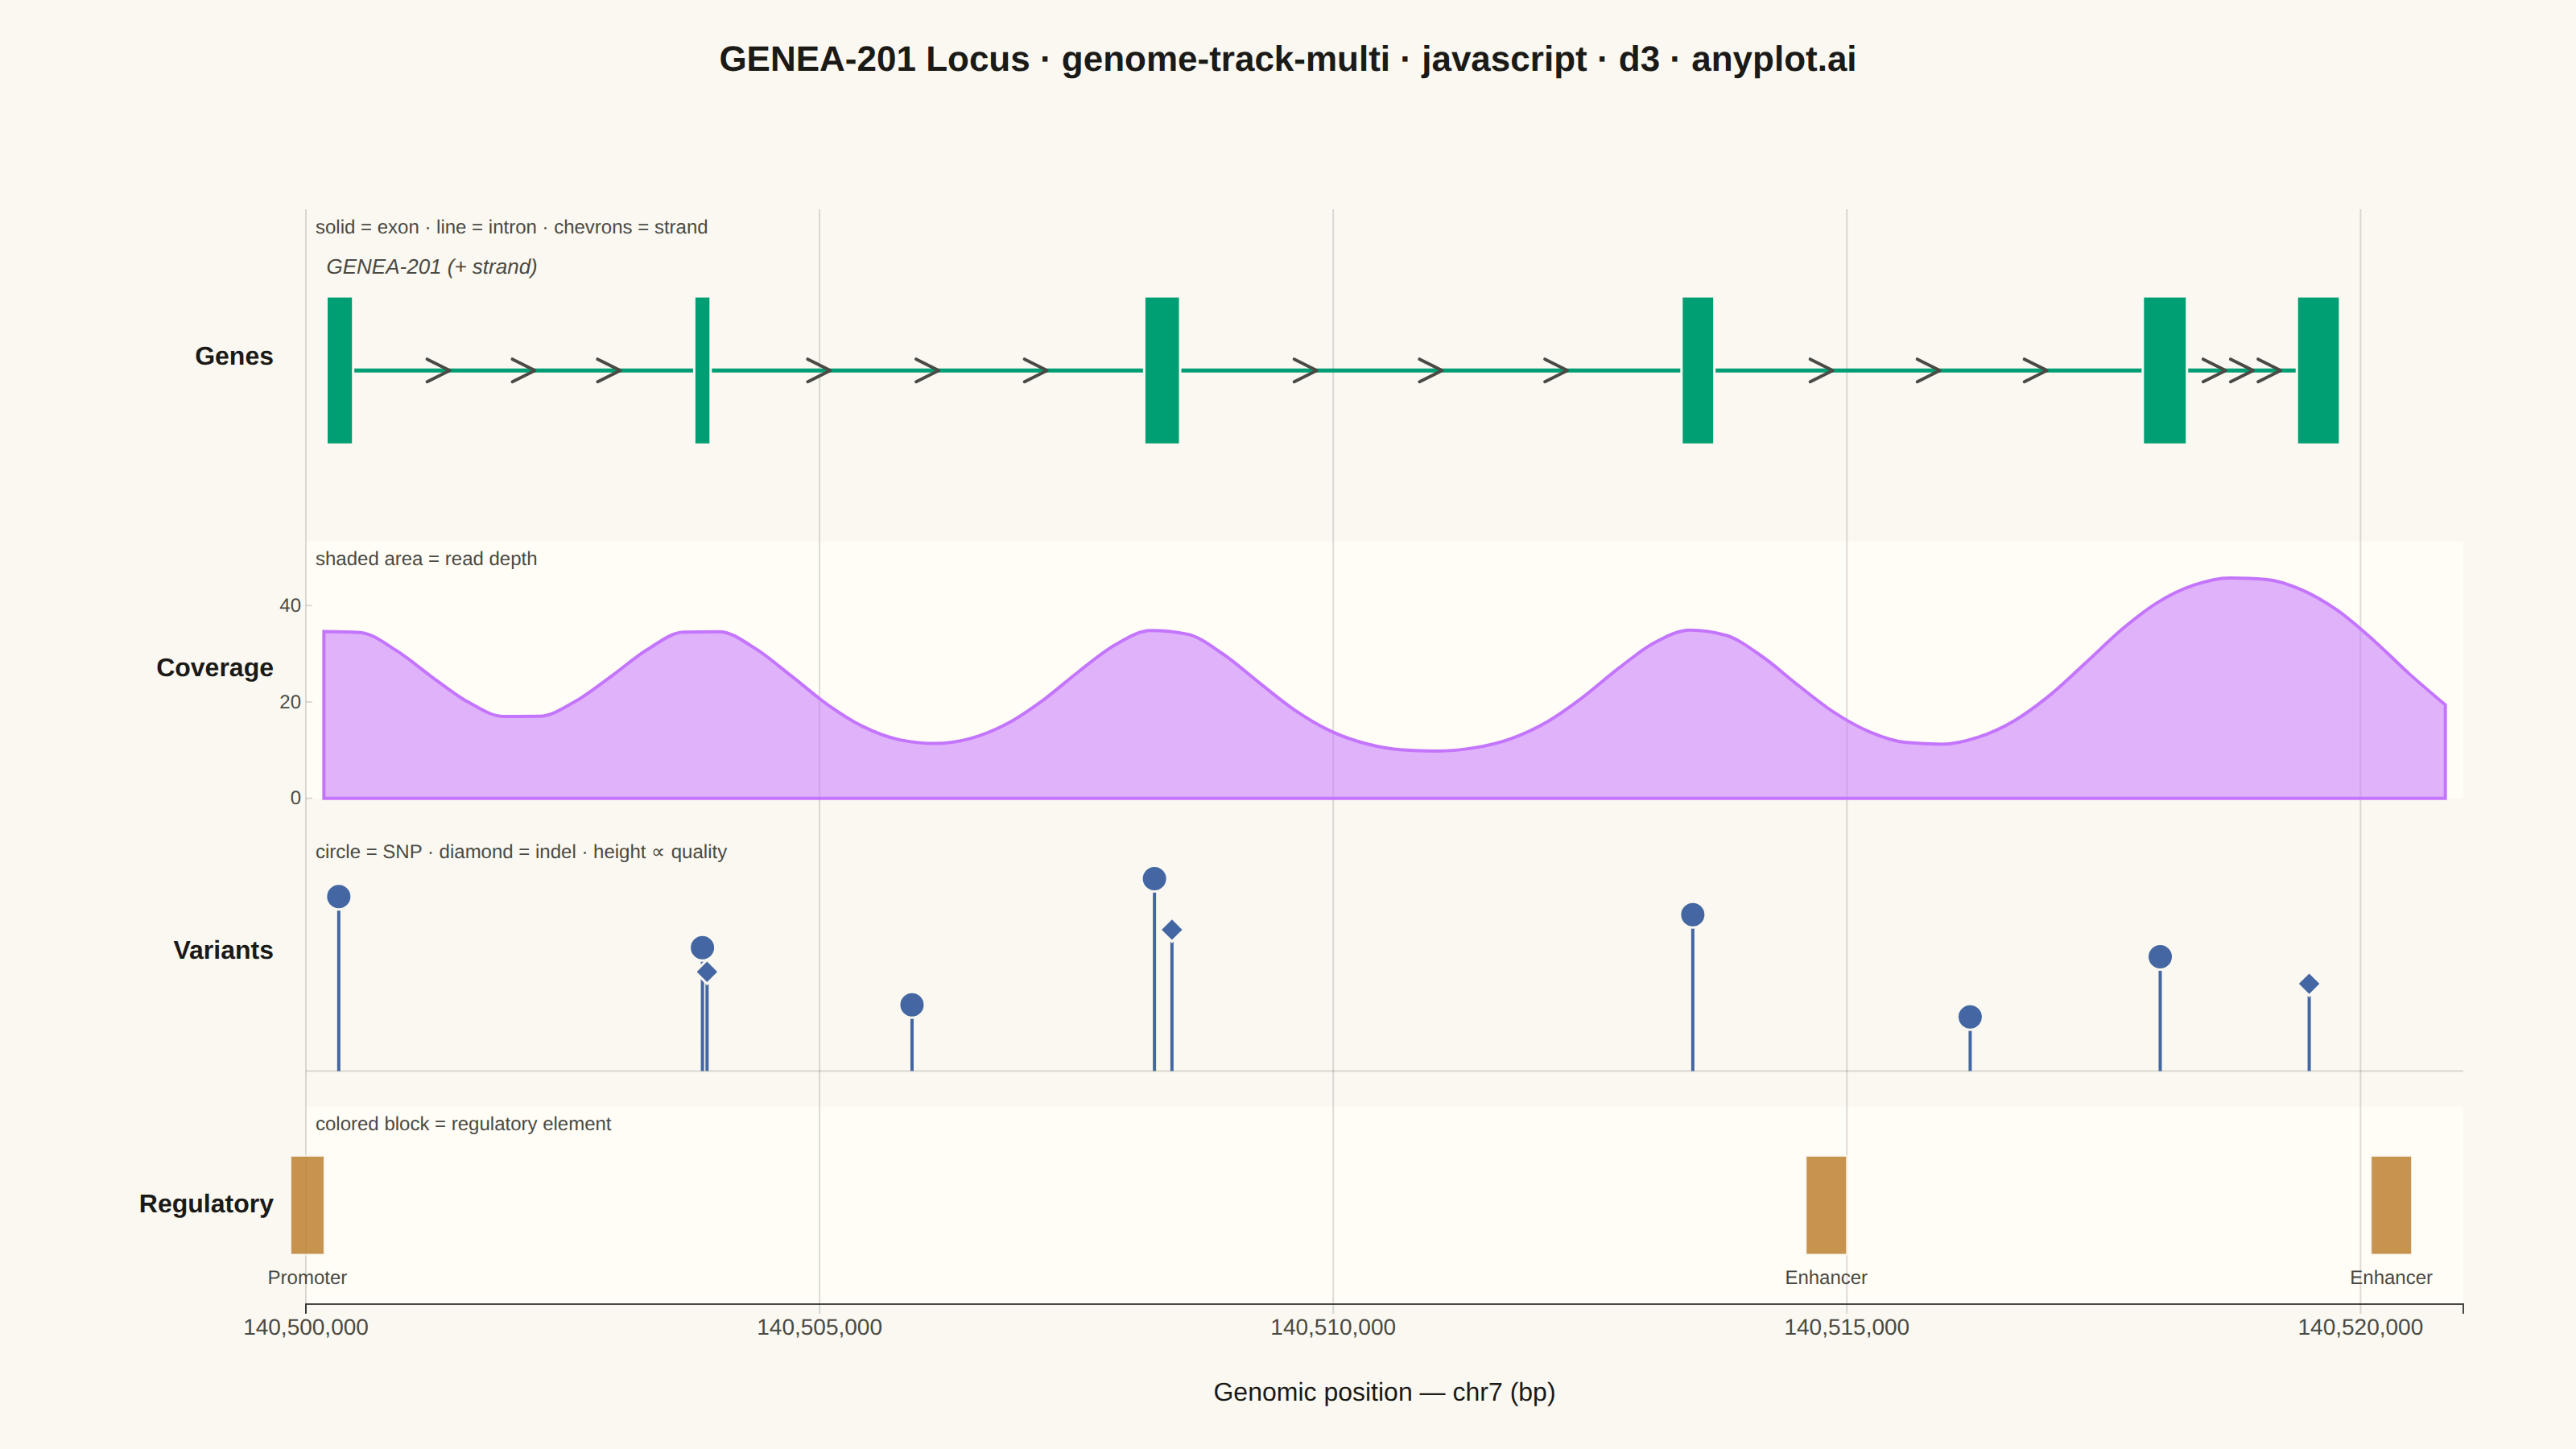
The same plot in 14 other libraries — JavaScript: Chart.js, Apache ECharts, Highcharts, MUI X Charts; Python: Altair, Bokeh, lets-plot, Matplotlib, Plotly, plotnine, Pygal, Seaborn; R: ggplot2; Julia: Makie.jl. Compare all 15 side by side: Genome Track Viewer in Python, R, Julia and JavaScript.
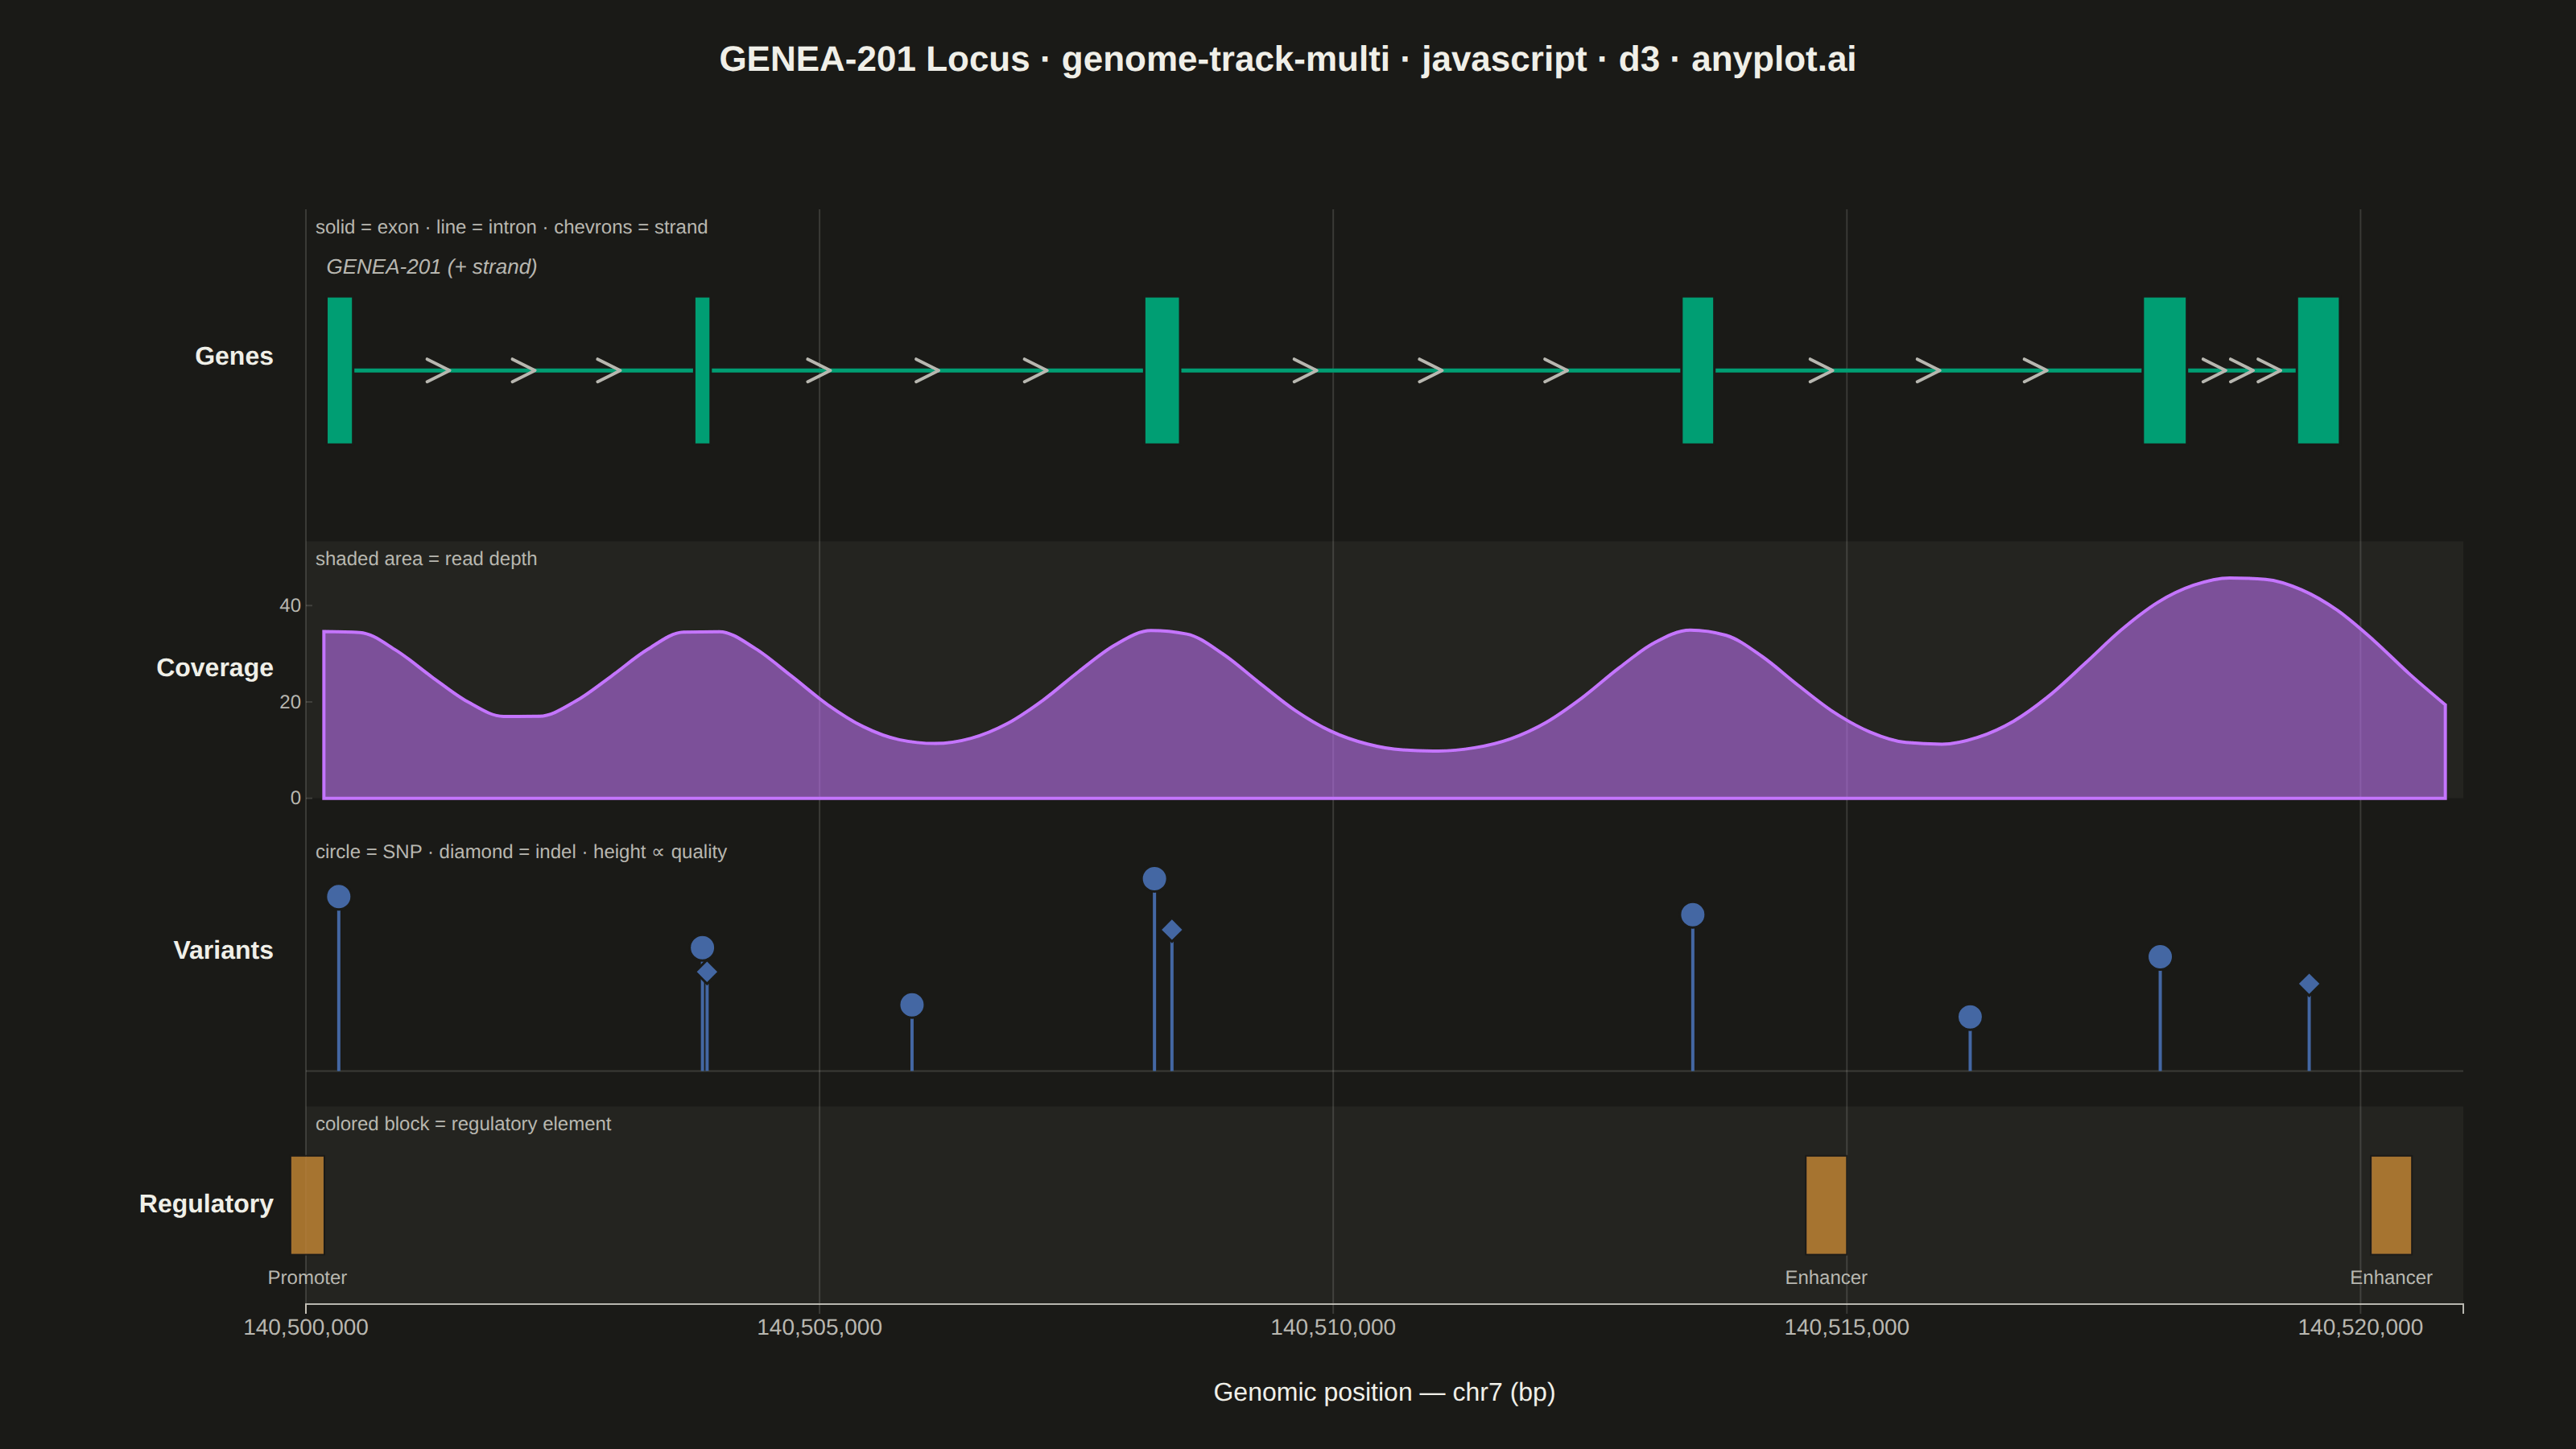
A multi-track genome browser view that displays different types of genomic data aligned along a shared chromosomal coordinate axis. Multiple parallel horizontal tracks (gene annotations, read coverage, variants, regulatory elements) are stacked vertically, each showing a different data type at the same genomic locus. This visualization is essential for integrative genomics, enabling researchers to explore relationships between gene structure, expression, variation, and regulation in a single coordinated view.
// anyplot.ai
// genome-track-multi: Genome Track Viewer
// Library: d3 7.9.0 | JavaScript 22.23.2
// Quality: 90/100 | Created: 2026-08-25

//# anyplot-orientation: landscape
const t = window.ANYPLOT_TOKENS;
const { width, height } = window.ANYPLOT_SIZE;

// --- Data: a single-locus genome browser view (in-memory, deterministic) ---

const CHROM = "chr7";
const REGION_START = 140500000;
const REGION_END = 140521000;

// Gene model: one transcript, 6 exons / 5 introns, plus strand.
const GENE_LABEL = "GENEA-201";
const exons = [
  [140500200, 140500460],
  [140503780, 140503940],
  [140508160, 140508510],
  [140513390, 140513710],
  [140517880, 140518310],
  [140519380, 140519800],
];
const introns = exons.slice(0, -1).map((exon, i) => [exon[1], exons[i + 1][0]]);

// Read-depth coverage: one bin per 350 bp, higher over exons than introns.
const BIN = 350;
const coverage = [];
for (let pos = REGION_START; pos < REGION_END; pos += BIN) {
  const mid = pos + BIN / 2;
  let depth = 9;
  for (const [exonStart, exonEnd] of exons) {
    const center = (exonStart + exonEnd) / 2;
    const spread = 900;
    depth += 26 * Math.exp(-((mid - center) ** 2) / (2 * spread ** 2));
  }
  coverage.push({ pos: mid, depth });
}

// Variant calls: SNPs and indels, clustered mostly in coding exons.
const variants = [
  { pos: 140500320, type: "SNP", quality: 58 },
  { pos: 140503860, type: "SNP", quality: 41 },
  { pos: 140503905, type: "indel", quality: 33 },
  { pos: 140505900, type: "SNP", quality: 22 },
  { pos: 140508260, type: "SNP", quality: 64 },
  { pos: 140508430, type: "indel", quality: 47 },
  { pos: 140513500, type: "SNP", quality: 52 },
  { pos: 140516200, type: "SNP", quality: 18 },
  { pos: 140518050, type: "SNP", quality: 38 },
  { pos: 140519500, type: "indel", quality: 29 },
];

// Regulatory elements: a promoter upstream of the gene, two enhancers.
const regulatory = [
  { start: 140499850, end: 140500180, kind: "Promoter" },
  { start: 140514600, end: 140515000, kind: "Enhancer" },
  { start: 140520100, end: 140520500, kind: "Enhancer" },
];

// --- Layout ------------------------------------------------------------------

const margin = { top: 130, right: 70, bottom: 90, left: 190 };
const iw = width - margin.left - margin.right;
const ih = height - margin.top - margin.bottom;

const x = d3.scaleLinear().domain([REGION_START, REGION_END]).range([0, iw]);

const tracks = [
  { key: "genes", label: "Genes", frac: 0.3, note: "solid = exon · line = intron · chevrons = strand" },
  { key: "coverage", label: "Coverage", frac: 0.26, note: "shaded area = read depth" },
  { key: "variants", label: "Variants", frac: 0.24, note: "circle = SNP · diamond = indel · height ∝ quality" },
  { key: "regulatory", label: "Regulatory", frac: 0.2, note: "colored block = regulatory element" },
];
const GAP = 22;
const usableHeight = ih - GAP * (tracks.length - 1);
let cursor = 0;
for (const track of tracks) {
  track.height = usableHeight * track.frac;
  track.y0 = cursor;
  cursor += track.height + GAP;
}
const [genesTrack, coverageTrack, variantsTrack, regulatoryTrack] = tracks;

// --- SVG mount -----------------------------------------------------------------

const svg = d3.select("#container").append("svg").attr("width", width).attr("height", height);
const g = svg.append("g").attr("transform", `translate(${margin.left},${margin.top})`);

// Alternating track-lane shading.
tracks.forEach((track, i) => {
  if (i % 2 === 1) {
    g.append("rect")
      .attr("x", 0)
      .attr("y", track.y0)
      .attr("width", iw)
      .attr("height", track.height)
      .attr("fill", t.elevatedBg);
  }
});

// Shared vertical guides so a position lines up across every track.
const xTicks = x.ticks(6);
g.selectAll(".vgrid")
  .data(xTicks)
  .join("line")
  .attr("class", "vgrid")
  .attr("x1", (d) => x(d))
  .attr("x2", (d) => x(d))
  .attr("y1", 0)
  .attr("y2", ih)
  .attr("stroke", t.grid)
  .attr("stroke-width", 1);

// Track labels + encoding notes (left margin / in-track caption).
tracks.forEach((track) => {
  g.append("text")
    .attr("x", -20)
    .attr("y", track.y0 + track.height / 2)
    .attr("text-anchor", "end")
    .attr("dominant-baseline", "middle")
    .attr("fill", t.ink)
    .style("font-size", "16px")
    .style("font-weight", "600")
    .text(track.label);

  g.append("text")
    .attr("x", 6)
    .attr("y", track.y0 + 15)
    .attr("fill", t.inkSoft)
    .style("font-size", "12px")
    .text(track.note);
});

// --- Genes track -----------------------------------------------------------

const geneY = genesTrack.y0 + genesTrack.height / 2 + 8;
const exonHeight = genesTrack.height * 0.5;

g.selectAll(".intron")
  .data(introns)
  .join("line")
  .attr("class", "intron")
  .attr("x1", (d) => x(d[0]))
  .attr("x2", (d) => x(d[1]))
  .attr("y1", geneY)
  .attr("y2", geneY)
  .attr("stroke", t.palette[0])
  .attr("stroke-width", 2.5);

const chevron = 7;
introns.forEach(([intronStart, intronEnd]) => {
  const steps = 3;
  for (let i = 1; i <= steps; i++) {
    const cx = x(intronStart + ((intronEnd - intronStart) * i) / (steps + 1));
    g.append("path")
      .attr(
        "d",
        `M ${cx - chevron},${geneY - chevron} L ${cx + chevron},${geneY} L ${cx - chevron},${geneY + chevron}`
      )
      .attr("fill", "none")
      .attr("stroke", t.inkSoft)
      .attr("stroke-width", 2)
      .attr("stroke-linecap", "round")
      .attr("stroke-linejoin", "round");
  }
});

g.selectAll(".exon")
  .data(exons)
  .join("rect")
  .attr("class", "exon")
  .attr("x", (d) => x(d[0]))
  .attr("y", geneY - exonHeight / 2)
  .attr("width", (d) => Math.max(2, x(d[1]) - x(d[0])))
  .attr("height", exonHeight)
  .attr("fill", t.palette[0])
  .attr("stroke", t.pageBg)
  .attr("stroke-width", 1.5);

g.append("text")
  .attr("x", x(exons[0][0]))
  .attr("y", geneY - exonHeight / 2 - 14)
  .attr("fill", t.inkSoft)
  .style("font-size", "13px")
  .style("font-style", "italic")
  .text(`${GENE_LABEL} (+ strand)`);

// --- Coverage track ----------------------------------------------------------

const coverageBaseline = coverageTrack.y0 + coverageTrack.height;
const maxDepth = d3.max(coverage, (d) => d.depth);
const yCoverage = d3
  .scaleLinear()
  .domain([0, maxDepth])
  .nice()
  .range([coverageBaseline, coverageTrack.y0 + 10]);

const areaGenerator = d3
  .area()
  .x((d) => x(d.pos))
  .y0(coverageBaseline)
  .y1((d) => yCoverage(d.depth))
  .curve(d3.curveMonotoneX);

g.append("path")
  .datum(coverage)
  .attr("d", areaGenerator)
  .attr("fill", t.palette[1])
  .attr("fill-opacity", 0.55)
  .attr("stroke", t.palette[1])
  .attr("stroke-width", 2);

const coverageAxis = g
  .append("g")
  .attr("transform", "translate(0,0)")
  .call(d3.axisLeft(yCoverage).ticks(3).tickSize(-4));
coverageAxis.selectAll("text").attr("fill", t.inkSoft).style("font-size", "12px");
coverageAxis.selectAll("line").attr("stroke", t.grid);
coverageAxis.select(".domain").remove();

// --- Variants track ------------------------------------------------------------

const variantBaseline = variantsTrack.y0 + variantsTrack.height;
const maxQuality = d3.max(variants, (d) => d.quality);
const yVariant = d3
  .scaleLinear()
  .domain([0, maxQuality])
  .nice()
  .range([variantBaseline, variantsTrack.y0 + 26]);

g.append("line")
  .attr("x1", 0)
  .attr("x2", iw)
  .attr("y1", variantBaseline)
  .attr("y2", variantBaseline)
  .attr("stroke", t.grid)
  .attr("stroke-width", 1);

g.selectAll(".variant-stem")
  .data(variants)
  .join("line")
  .attr("class", "variant-stem")
  .attr("x1", (d) => x(d.pos))
  .attr("x2", (d) => x(d.pos))
  .attr("y1", variantBaseline)
  .attr("y2", (d) => yVariant(d.quality))
  .attr("stroke", t.palette[2])
  .attr("stroke-width", 2);

g.selectAll(".variant-snp")
  .data(variants.filter((d) => d.type === "SNP"))
  .join("circle")
  .attr("class", "variant-snp")
  .attr("cx", (d) => x(d.pos))
  .attr("cy", (d) => yVariant(d.quality))
  .attr("r", 8)
  .attr("fill", t.palette[2])
  .attr("stroke", t.pageBg)
  .attr("stroke-width", 1.5);

g.selectAll(".variant-indel")
  .data(variants.filter((d) => d.type === "indel"))
  .join("path")
  .attr("class", "variant-indel")
  .attr("transform", (d) => `translate(${x(d.pos)},${yVariant(d.quality)}) rotate(45)`)
  .attr("d", d3.symbol().type(d3.symbolSquare).size(110))
  .attr("fill", t.palette[2])
  .attr("stroke", t.pageBg)
  .attr("stroke-width", 1.5);

// --- Regulatory track ----------------------------------------------------------

const regulatoryY0 = regulatoryTrack.y0 + regulatoryTrack.height * 0.25;
const regulatoryHeight = regulatoryTrack.height * 0.5;

g.selectAll(".regulatory")
  .data(regulatory)
  .join("rect")
  .attr("class", "regulatory")
  .attr("x", (d) => x(d.start))
  .attr("y", regulatoryY0)
  .attr("width", (d) => Math.max(2, x(d.end) - x(d.start)))
  .attr("height", regulatoryHeight)
  .attr("fill", t.palette[3])
  .attr("opacity", 0.85)
  .attr("stroke", t.pageBg)
  .attr("stroke-width", 1);

g.selectAll(".regulatory-label")
  .data(regulatory)
  .join("text")
  .attr("class", "regulatory-label")
  .attr("x", (d) => (x(d.start) + x(d.end)) / 2)
  .attr("y", regulatoryY0 + regulatoryHeight + 18)
  .attr("text-anchor", "middle")
  .attr("fill", t.inkSoft)
  .style("font-size", "12px")
  .text((d) => d.kind);

// --- Shared x-axis (genomic position) -------------------------------------------

const xAxis = g
  .append("g")
  .attr("transform", `translate(0,${ih})`)
  .call(d3.axisBottom(x).ticks(6).tickFormat(d3.format(",")));
xAxis.selectAll("text").attr("fill", t.inkSoft).style("font-size", "14px");
xAxis.selectAll("line").attr("stroke", t.grid);
xAxis.select(".domain").attr("stroke", t.inkSoft);

g.append("text")
  .attr("x", iw / 2)
  .attr("y", ih + 60)
  .attr("text-anchor", "middle")
  .attr("fill", t.ink)
  .style("font-size", "16px")
  .text(`Genomic position — ${CHROM} (bp)`);

// --- Title -----------------------------------------------------------------------

const title = "GENEA-201 Locus · genome-track-multi · javascript · d3 · anyplot.ai";
const titleFontSize = Math.round(22 * Math.min(1, 67 / title.length));
svg
  .append("text")
  .attr("x", width / 2)
  .attr("y", 44)
  .attr("text-anchor", "middle")
  .attr("fill", t.ink)
  .style("font-size", `${titleFontSize}px`)
  .style("font-weight", "600")
  .text(title);
Runnable source as JSON, for any HTTP client: https://api.anyplot.ai/specs/genome-track-multi/d3/code. Any spec id and library id listed in llms-full.txt fit the same URL shape; every URL below is complete and callable.
{
  "spec_id": "genome-track-multi",
  "language": "javascript",
  "library": "d3",
  "page": "https://anyplot.ai/genome-track-multi/javascript/d3",
  "hub": "https://anyplot.ai/genome-track-multi",
  "code_json": "https://api.anyplot.ai/specs/genome-track-multi/d3/code",
  "spec_json": "https://api.anyplot.ai/specs/genome-track-multi",
  "render_light_png": "https://storage.googleapis.com/anyplot-images/plots/genome-track-multi/javascript/d3/plot-light.png",
  "render_dark_png": "https://storage.googleapis.com/anyplot-images/plots/genome-track-multi/javascript/d3/plot-dark.png",
  "interactive_light_html": "https://storage.googleapis.com/anyplot-images/plots/genome-track-multi/javascript/d3/plot-light.html",
  "interactive_dark_html": "https://storage.googleapis.com/anyplot-images/plots/genome-track-multi/javascript/d3/plot-dark.html",
  "quality_score": 90.0,
  "license": "MIT",
  "guide": "https://anyplot.ai/llms.txt"
}
Part of Genome Track Viewer on anyplot.ai.