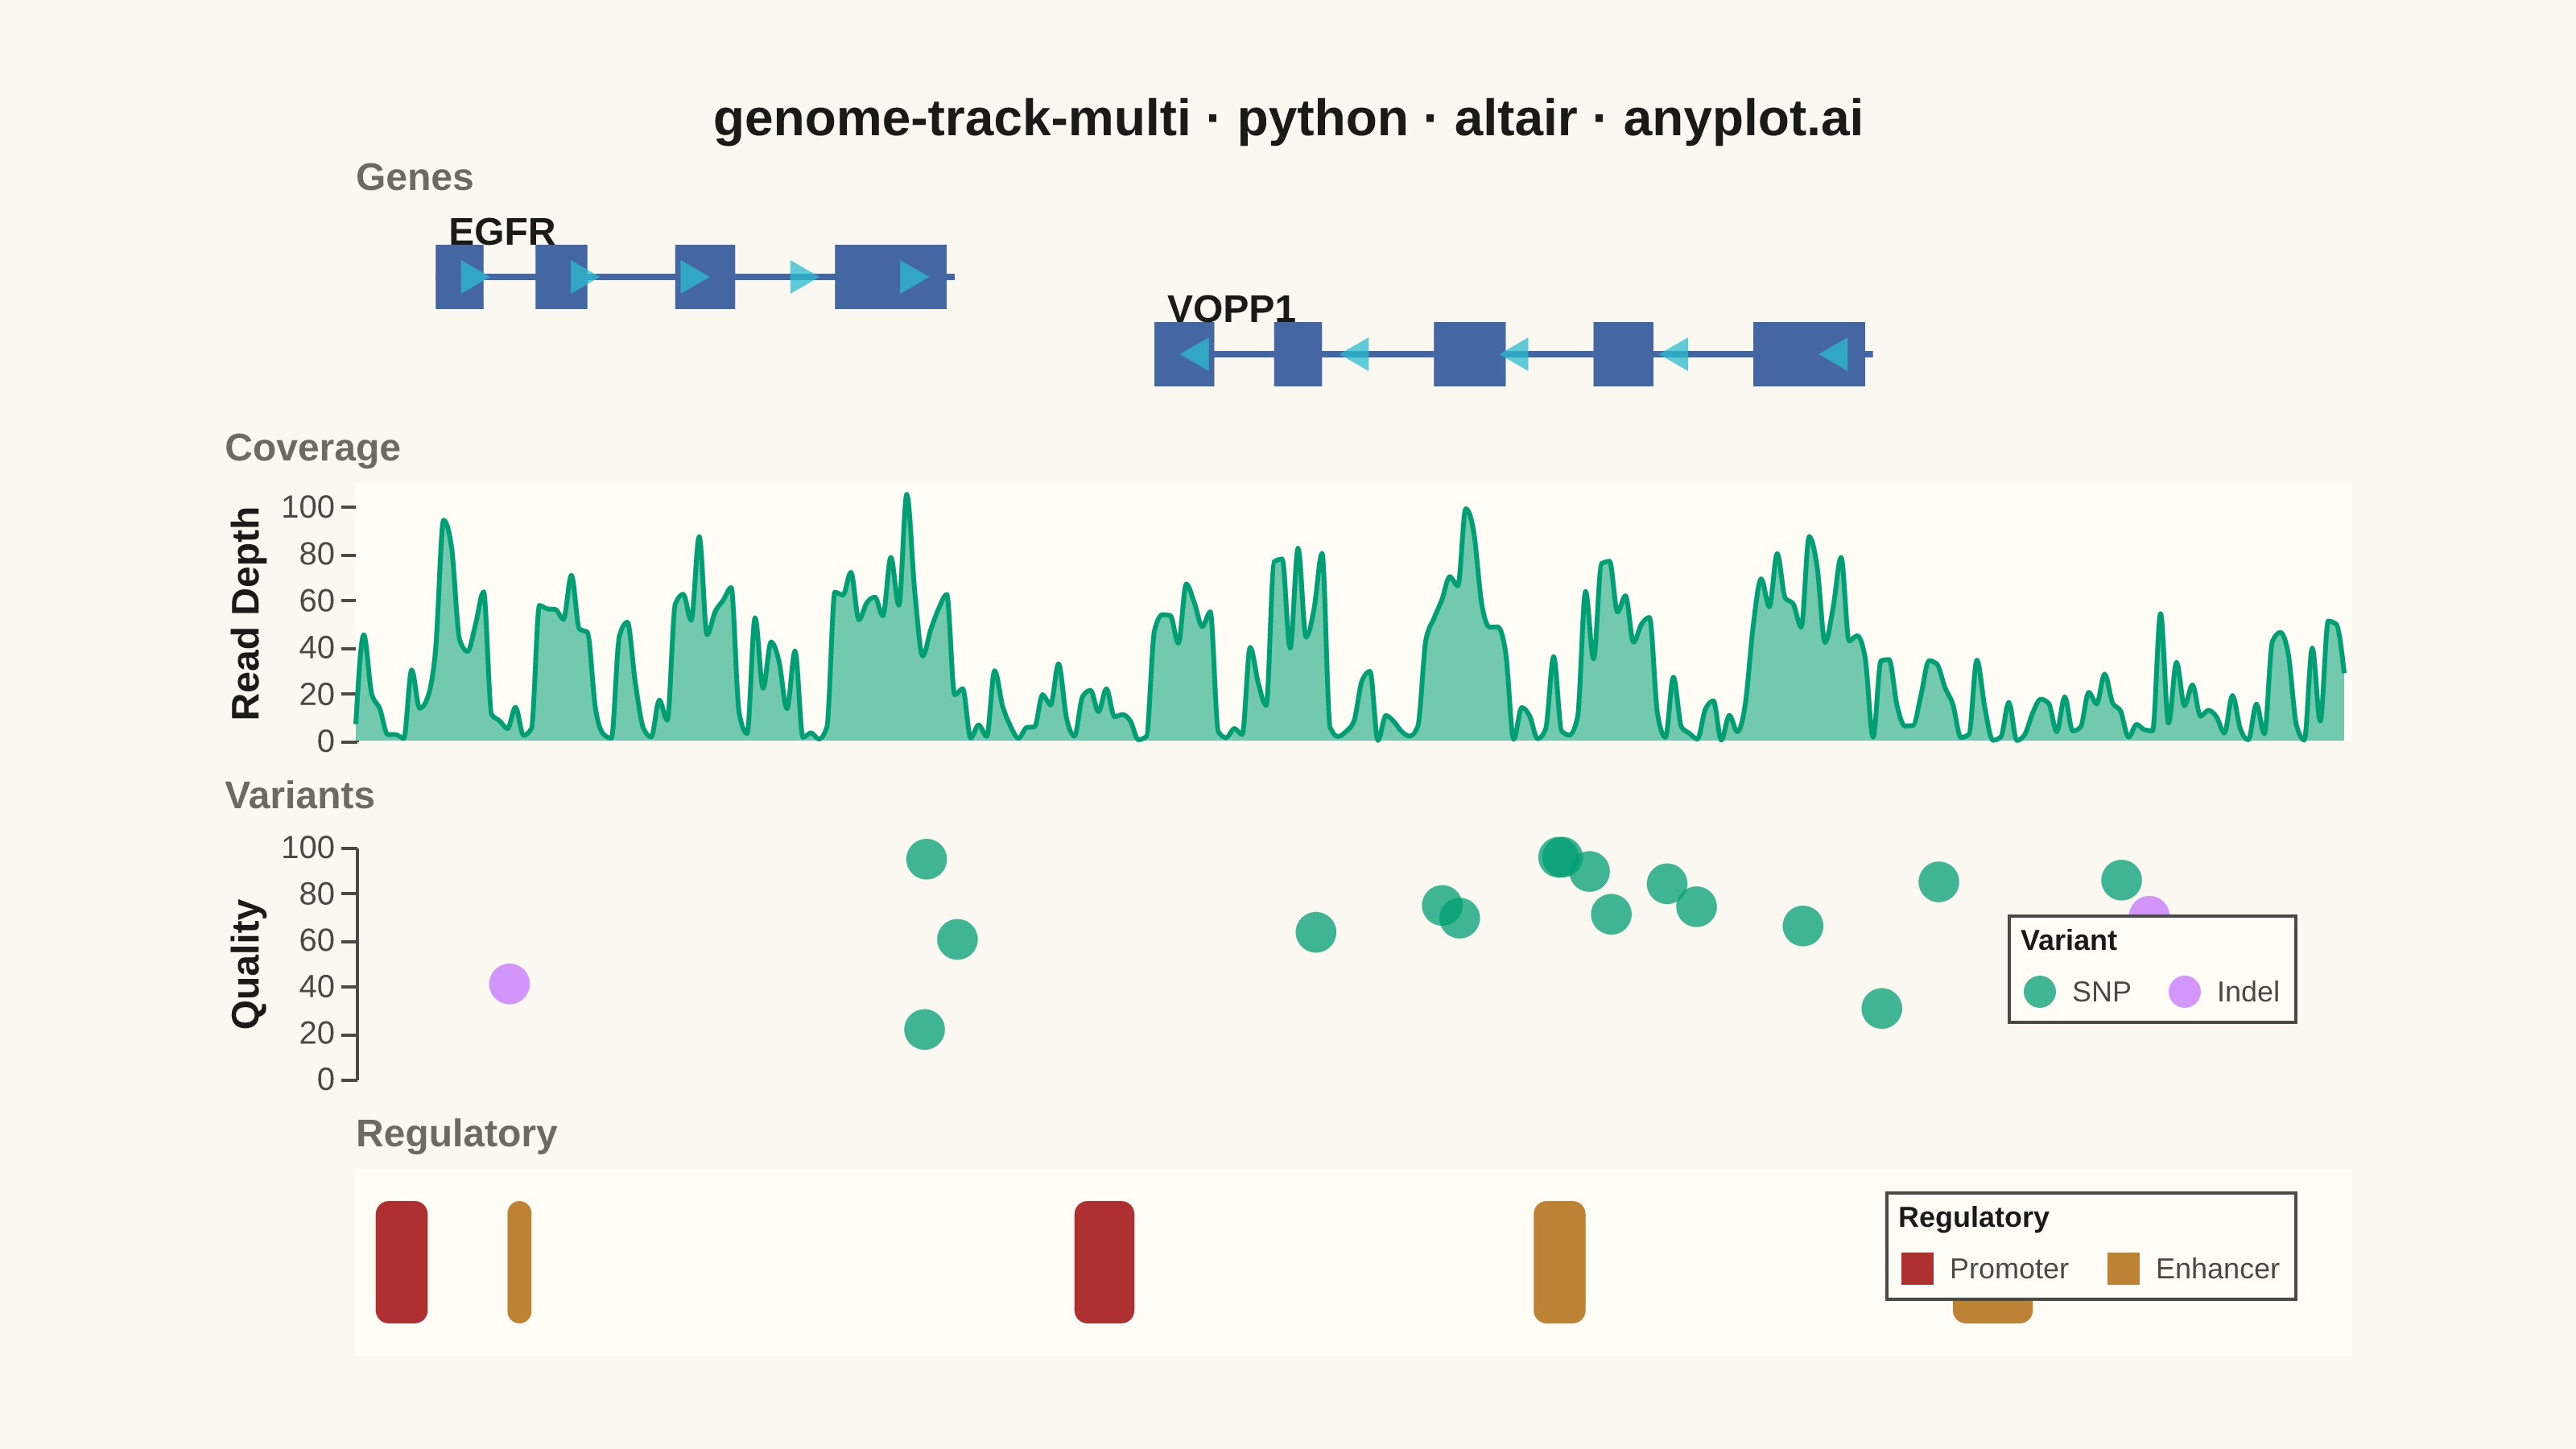
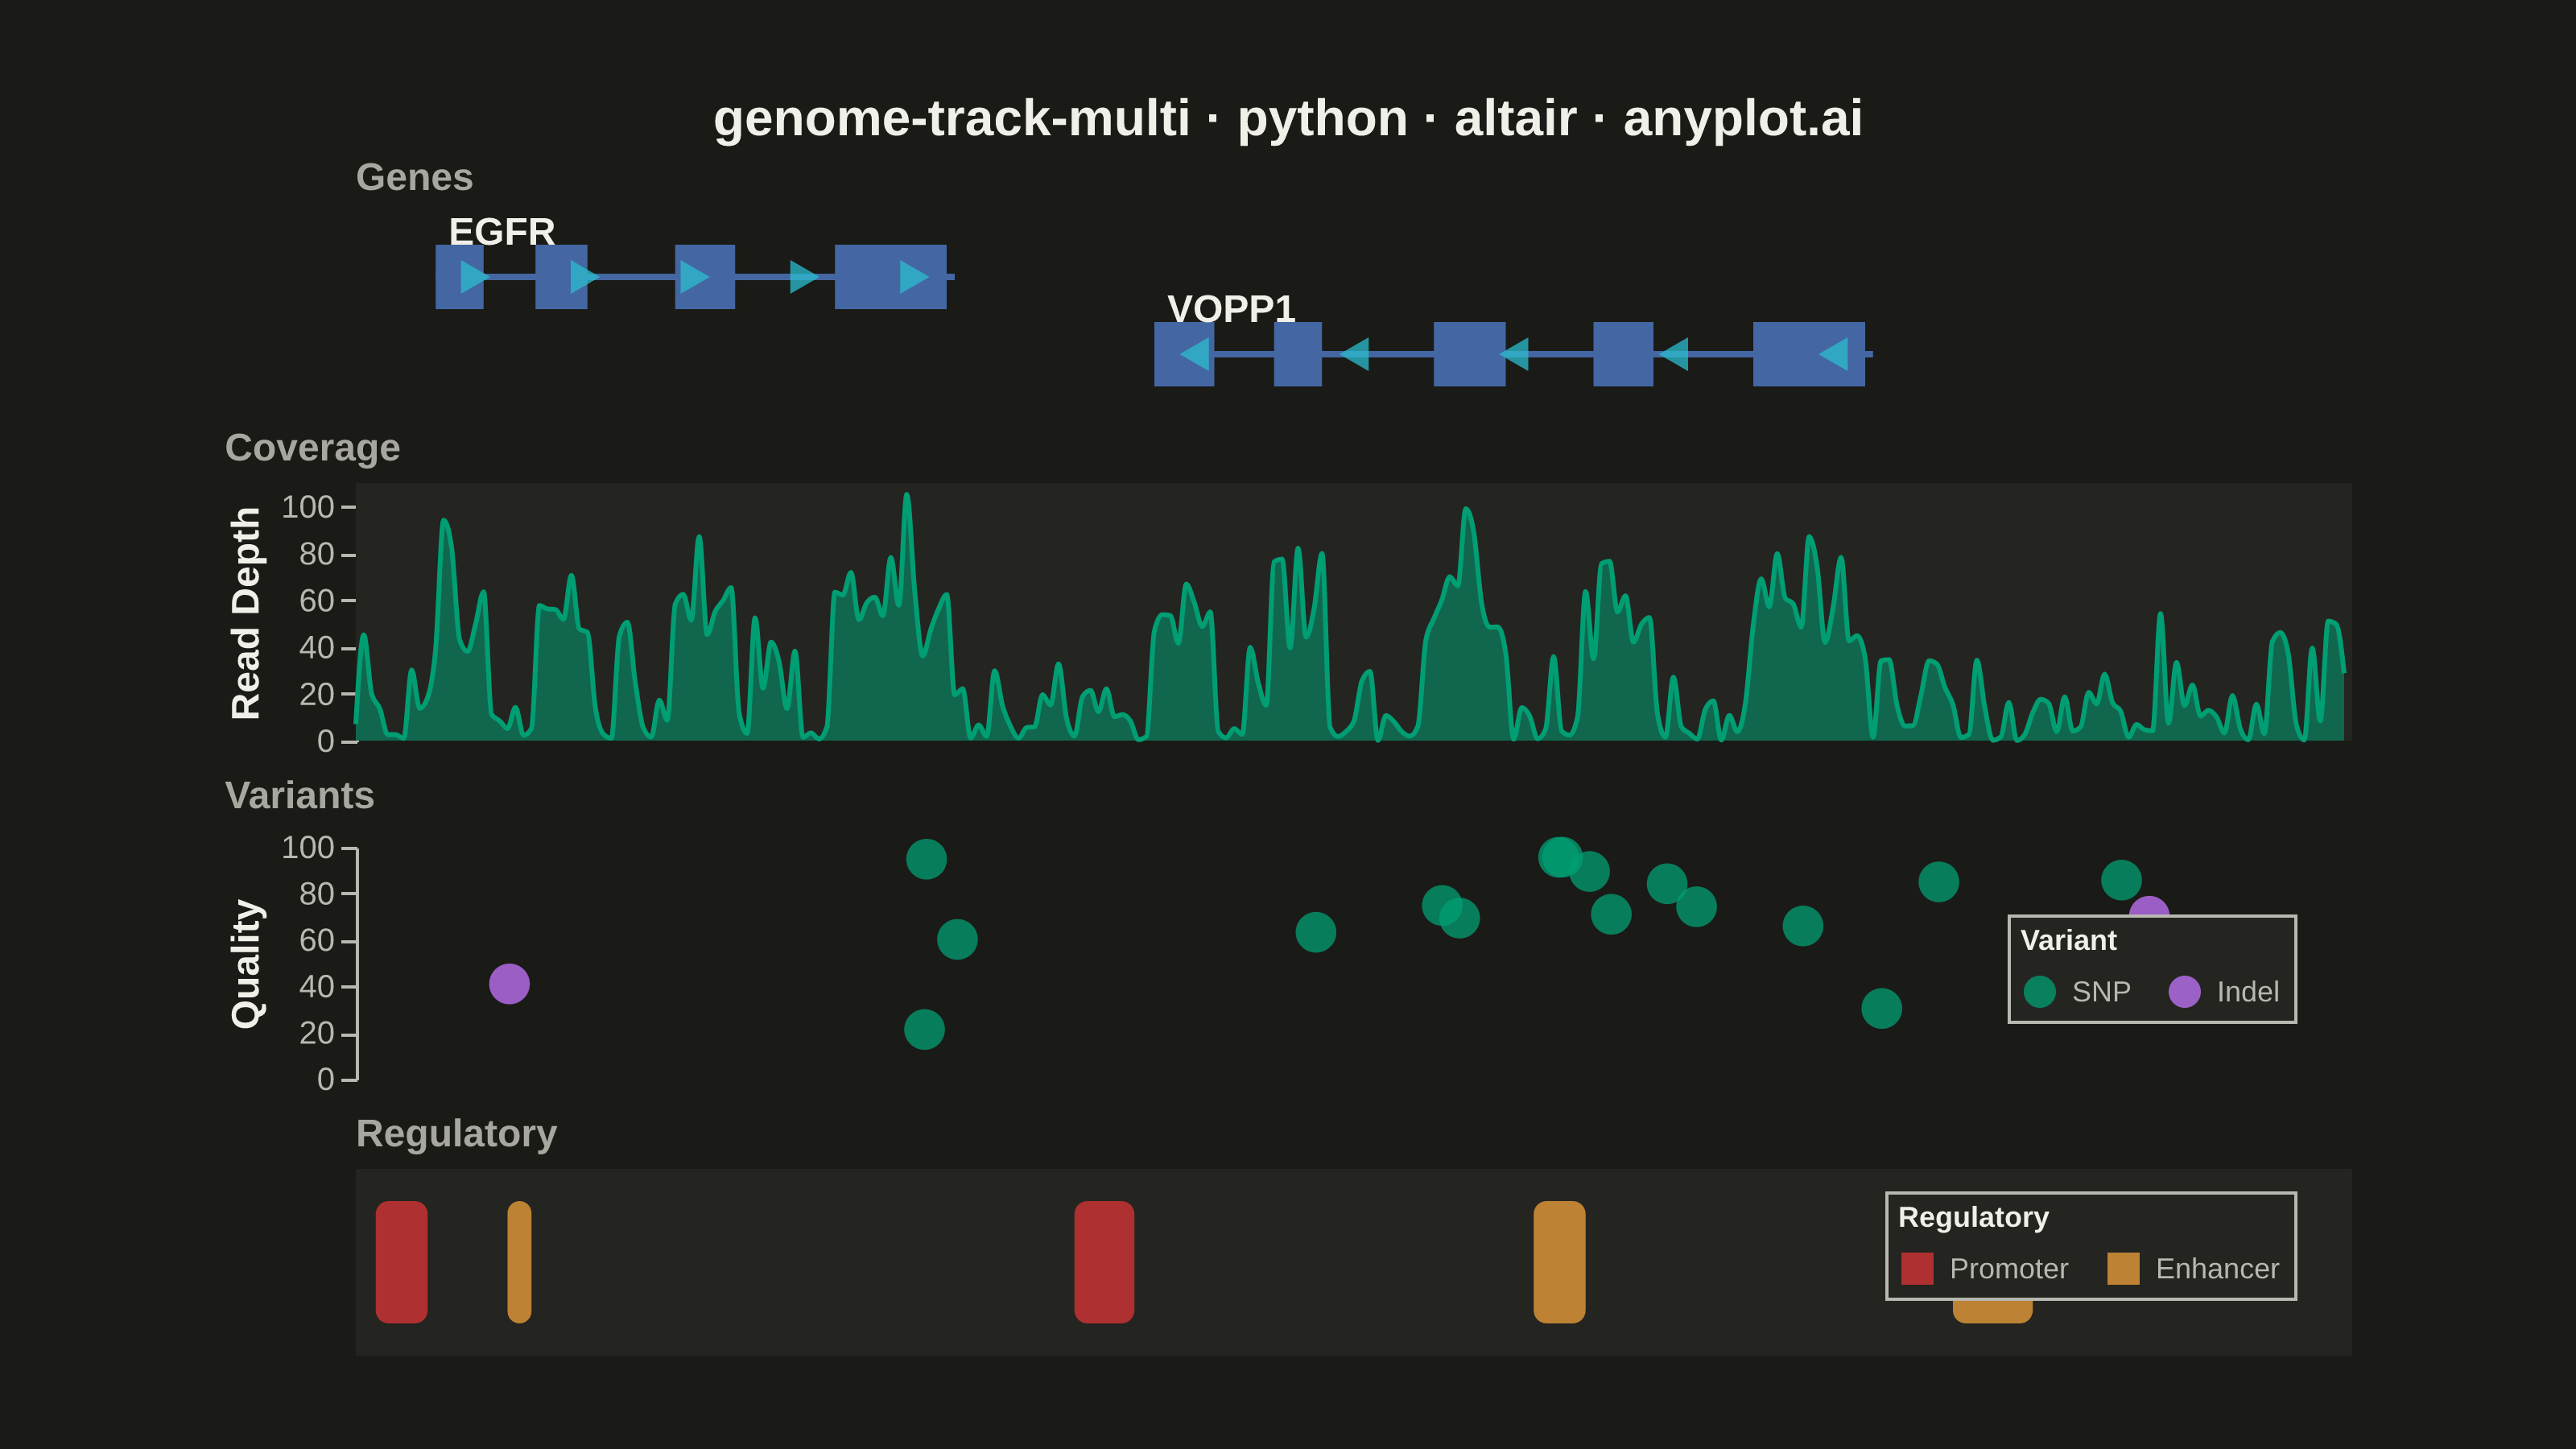
A multi-track genome browser view that displays different types of genomic data aligned along a shared chromosomal coordinate axis. Multiple parallel horizontal tracks (gene annotations, read coverage, variants, regulatory elements) are stacked vertically, each showing a different data type at the same genomic locus. This visualization is essential for integrative genomics, enabling researchers to explore relationships between gene structure, expression, variation, and regulation in a single coordinated view.
""" anyplot.ai
genome-track-multi: Genome Track Viewer
Library: altair 6.1.0 | Python 3.13.13
Quality: 90/100 | Updated: 2026-06-02
"""

import os
import sys


# Prevent self-shadowing: this file is named altair.py, same as the library.
# Python inserts the script's absolute directory into sys.path[0]; remove it
# so that `import altair` finds the installed package, not this file.
_this_dir = os.path.dirname(os.path.abspath(__file__))
sys.path = [p for p in sys.path if os.path.abspath(p) != _this_dir and p not in ("", ".")]

import altair as alt
import numpy as np
import pandas as pd
from PIL import Image


# Theme tokens
THEME = os.getenv("ANYPLOT_THEME", "light")
PAGE_BG = "#FAF8F1" if THEME == "light" else "#1A1A17"
PAGE_BG_RGB = (0xFA, 0xF8, 0xF1) if THEME == "light" else (0x1A, 0x1A, 0x17)
ELEVATED_BG = "#FFFDF6" if THEME == "light" else "#242420"
INK = "#1A1A17" if THEME == "light" else "#F0EFE8"
INK_SOFT = "#4A4A44" if THEME == "light" else "#B8B7B0"
INK_MUTED = "#6B6A63" if THEME == "light" else "#A8A79F"

# Imprint palette — hybrid-v3 sort order
IMPRINT_PALETTE = ["#009E73", "#C475FD", "#4467A3", "#BD8233", "#AE3030", "#2ABCCD", "#954477", "#99B314"]

# Data: chr7 ~50 kb window around EGFR/VOPP1
np.random.seed(42)
chrom = "chr7"
region_start = 55_140_000
region_end = 55_190_000

gene_bodies = pd.DataFrame(
    {
        "start": [55_142_000, 55_160_000],
        "end": [55_155_000, 55_178_000],
        "gene": ["EGFR", "VOPP1"],
        "strand": ["+", "-"],
        "y_pos": [1, 0],
    }
)

exons = pd.DataFrame(
    {
        "start": [
            55_142_000,
            55_144_500,
            55_148_000,
            55_152_000,
            55_160_000,
            55_163_000,
            55_167_000,
            55_171_000,
            55_175_000,
        ],
        "end": [
            55_143_200,
            55_145_800,
            55_149_500,
            55_154_800,
            55_161_500,
            55_164_200,
            55_168_800,
            55_172_500,
            55_177_800,
        ],
        "gene": ["EGFR", "EGFR", "EGFR", "EGFR", "VOPP1", "VOPP1", "VOPP1", "VOPP1", "VOPP1"],
        "y_pos": [1, 1, 1, 1, 0, 0, 0, 0, 0],
    }
)

coverage_positions = np.arange(region_start, region_end, 200)
base_coverage = np.random.exponential(15, len(coverage_positions))
for _, row in exons.iterrows():
    mask = (coverage_positions >= row["start"]) & (coverage_positions <= row["end"])
    base_coverage[mask] += np.random.uniform(30, 60, mask.sum())
coverage_df = pd.DataFrame({"position": coverage_positions, "depth": base_coverage})

n_variants = 18
variant_positions = np.sort(np.random.randint(region_start + 1000, region_end - 1000, n_variants))
variant_df = pd.DataFrame(
    {
        "position": variant_positions,
        "quality": np.random.uniform(20, 100, n_variants),
        "variant_type": np.random.choice(["SNP", "Indel"], n_variants, p=[0.8, 0.2]),
    }
)

regulatory_df = pd.DataFrame(
    {
        "start": [55_140_500, 55_143_800, 55_158_000, 55_169_500, 55_180_000],
        "end": [55_141_800, 55_144_400, 55_159_500, 55_170_800, 55_182_000],
        "element_type": ["Promoter", "Enhancer", "Promoter", "Enhancer", "Enhancer"],
        "y_pos": [0, 0, 0, 0, 0],
    }
)

x_domain = [region_start, region_end]
W = 620

# Background data for alternating track tints (Coverage = track 2, Regulatory = track 4)
_even_bg_df = pd.DataFrame({"xs": [region_start], "xe": [region_end]})

# Track 1: Genes — intron lines + exon rectangles + strand arrows + gene names
intron_lines = (
    alt.Chart(gene_bodies)
    .mark_rule(strokeWidth=2)
    .encode(
        x=alt.X("start:Q", scale=alt.Scale(domain=x_domain), axis=None),
        x2="end:Q",
        y=alt.Y("y_pos:Q", scale=alt.Scale(domain=[-0.5, 1.5]), axis=None),
        color=alt.value(IMPRINT_PALETTE[2]),
    )
)

exon_bars = (
    alt.Chart(exons)
    .mark_bar(height=20)
    .encode(
        x=alt.X("start:Q", scale=alt.Scale(domain=x_domain), axis=None),
        x2="end:Q",
        y=alt.Y("y_pos:Q", scale=alt.Scale(domain=[-0.5, 1.5]), axis=None),
        color=alt.value(IMPRINT_PALETTE[2]),
        tooltip=[alt.Tooltip("gene:N", title="Gene")],
    )
)

gene_labels = (
    alt.Chart(gene_bodies)
    .mark_text(fontSize=12, fontWeight="bold", align="left", dx=4, dy=-14)
    .encode(
        x=alt.X("start:Q", scale=alt.Scale(domain=x_domain), axis=None),
        y=alt.Y("y_pos:Q", scale=alt.Scale(domain=[-0.5, 1.5]), axis=None),
        text=alt.Text("gene:N"),
        color=alt.value(INK),
    )
)

strand_data = []
for _, row in gene_bodies.iterrows():
    for pos in np.linspace(row["start"] + 1000, row["end"] - 1000, 5):
        strand_data.append({"position": pos, "y_pos": row["y_pos"], "angle": 0 if row["strand"] == "+" else 180})
strand_df = pd.DataFrame(strand_data)

strand_marks = (
    alt.Chart(strand_df)
    .mark_point(shape="triangle-right", size=110, filled=True, opacity=0.75)
    .encode(
        x=alt.X("position:Q", scale=alt.Scale(domain=x_domain), axis=None),
        y=alt.Y("y_pos:Q", scale=alt.Scale(domain=[-0.5, 1.5]), axis=None),
        angle=alt.Angle("angle:Q", scale=None),
        color=alt.value(IMPRINT_PALETTE[5]),
    )
)

gene_track = (intron_lines + exon_bars + gene_labels + strand_marks).properties(
    width=W, height=58, title=alt.Title("Genes", anchor="start", fontSize=12, color=INK_MUTED)
)

# Track 2: Coverage — alternating background + filled area with the brand-green primary series
_cov_bg = (
    alt.Chart(_even_bg_df)
    .mark_rect(fill=ELEVATED_BG, opacity=1.0)
    .encode(
        x=alt.X("xs:Q", scale=alt.Scale(domain=x_domain), axis=None),
        x2=alt.X2("xe:Q"),
        y=alt.value(0),
        y2=alt.value(80),
    )
)
coverage_track = (
    _cov_bg
    + alt.Chart(coverage_df)
    .mark_area(interpolate="monotone", opacity=0.55, line={"color": IMPRINT_PALETTE[0], "strokeWidth": 1.5})
    .encode(
        x=alt.X("position:Q", scale=alt.Scale(domain=x_domain), axis=None),
        y=alt.Y("depth:Q", axis=alt.Axis(title="Read Depth", tickCount=4, grid=False)),
        color=alt.value(IMPRINT_PALETTE[0]),
        tooltip=[
            alt.Tooltip("position:Q", title="Position", format=","),
            alt.Tooltip("depth:Q", title="Depth", format=".1f"),
        ],
    )
).properties(width=W, height=80, title=alt.Title("Coverage", anchor="start", fontSize=12, color=INK_MUTED))

# Track 3: Variants — circles, quality on y-axis, legend bottom to save right-side space
variant_track = (
    alt.Chart(variant_df)
    .mark_circle(size=160, opacity=0.75)
    .encode(
        x=alt.X("position:Q", scale=alt.Scale(domain=x_domain), axis=None),
        y=alt.Y("quality:Q", axis=alt.Axis(title="Quality", tickCount=4, grid=False)),
        color=alt.Color(
            "variant_type:N",
            scale=alt.Scale(domain=["SNP", "Indel"], range=[IMPRINT_PALETTE[0], IMPRINT_PALETTE[1]]),
            legend=alt.Legend(
                title="Variant",
                orient="bottom-right",
                direction="horizontal",
                labelFontSize=9,
                titleFontSize=9,
                fillColor=ELEVATED_BG,
                strokeColor=INK_SOFT,
                labelColor=INK_SOFT,
                titleColor=INK,
                padding=4,
            ),
        ),
        tooltip=[
            alt.Tooltip("position:Q", title="Position", format=","),
            alt.Tooltip("quality:Q", title="Quality", format=".1f"),
            alt.Tooltip("variant_type:N", title="Type"),
        ],
    )
    .properties(width=W, height=72, title=alt.Title("Variants", anchor="start", fontSize=12, color=INK_MUTED))
)

# Track 4: Regulatory — alternating background + taller bars, legend bottom-right
_reg_bg = (
    alt.Chart(_even_bg_df)
    .mark_rect(fill=ELEVATED_BG, opacity=1.0)
    .encode(
        x=alt.X("xs:Q", scale=alt.Scale(domain=x_domain), axis=None),
        x2=alt.X2("xe:Q"),
        y=alt.value(0),
        y2=alt.value(58),
    )
)
regulatory_track = (
    _reg_bg
    + alt.Chart(regulatory_df)
    .mark_bar(height=38, cornerRadius=4)
    .encode(
        x=alt.X(
            "start:Q",
            scale=alt.Scale(domain=x_domain),
            axis=alt.Axis(
                title=f"Genomic Position ({chrom})", labelExpr="format(datum.value, ',.0f')", tickCount=6, grid=False
            ),
        ),
        x2="end:Q",
        y=alt.Y("y_pos:Q", scale=alt.Scale(domain=[-0.5, 0.5]), axis=None),
        color=alt.Color(
            "element_type:N",
            scale=alt.Scale(domain=["Promoter", "Enhancer"], range=[IMPRINT_PALETTE[4], IMPRINT_PALETTE[3]]),
            legend=alt.Legend(
                title="Regulatory",
                orient="bottom-right",
                direction="horizontal",
                labelFontSize=9,
                titleFontSize=9,
                fillColor=ELEVATED_BG,
                strokeColor=INK_SOFT,
                labelColor=INK_SOFT,
                titleColor=INK,
                padding=4,
            ),
        ),
        tooltip=[
            alt.Tooltip("element_type:N", title="Type"),
            alt.Tooltip("start:Q", title="Start", format=","),
            alt.Tooltip("end:Q", title="End", format=","),
        ],
    )
).properties(width=W, height=58, title=alt.Title("Regulatory", anchor="start", fontSize=12, color=INK_MUTED))

# Combine tracks
title_str = "genome-track-multi · python · altair · anyplot.ai"
# len(title_str) = 49 < 67, default fontSize=16 is fine

chart = (
    alt.vconcat(gene_track, coverage_track, variant_track, regulatory_track, spacing=6)
    .resolve_scale(color="independent")
    .properties(background=PAGE_BG, title=alt.Title(title_str, fontSize=16, anchor="middle", color=INK))
    .configure_view(strokeWidth=0, fill=PAGE_BG)
    .configure_axis(
        labelFontSize=10,
        titleFontSize=12,
        labelColor=INK_SOFT,
        titleColor=INK,
        domainColor=INK_SOFT,
        tickColor=INK_SOFT,
        gridColor=INK,
        gridOpacity=0.12,
    )
    .configure_title(color=INK)
    .configure_concat(spacing=6)
)

# Save PNG and apply pad-only-to-target (landscape 3200×1800)
chart.save(f"plot-{THEME}.png", scale_factor=4.0)

TW, TH = 3200, 1800
_img = Image.open(f"plot-{THEME}.png").convert("RGB")
_w, _h = _img.size
if _w > TW or _h > TH:
    raise SystemExit(
        f"altair vl-convert produced {_w}×{_h}, exceeds target {TW}×{TH}. "
        "Shrink chart .properties(width=, height=) values and re-render."
    )
if _w < TW or _h < TH:
    _canvas = Image.new("RGB", (TW, TH), PAGE_BG_RGB)
    _canvas.paste(_img, ((TW - _w) // 2, (TH - _h) // 2))
    _canvas.save(f"plot-{THEME}.png")

chart.save(f"plot-{THEME}.html")
Runnable source as JSON, for any HTTP client: https://api.anyplot.ai/specs/genome-track-multi/altair/code. Any spec id and library id listed in llms-full.txt fit the same URL shape; every URL below is complete and callable.
{
  "spec_id": "genome-track-multi",
  "language": "python",
  "library": "altair",
  "page": "https://anyplot.ai/genome-track-multi/python/altair",
  "hub": "https://anyplot.ai/genome-track-multi",
  "code_json": "https://api.anyplot.ai/specs/genome-track-multi/altair/code",
  "spec_json": "https://api.anyplot.ai/specs/genome-track-multi",
  "render_light_png": "https://storage.googleapis.com/anyplot-images/plots/genome-track-multi/python/altair/plot-light.png",
  "render_dark_png": "https://storage.googleapis.com/anyplot-images/plots/genome-track-multi/python/altair/plot-dark.png",
  "interactive_light_html": "https://storage.googleapis.com/anyplot-images/plots/genome-track-multi/python/altair/plot-light.html",
  "interactive_dark_html": "https://storage.googleapis.com/anyplot-images/plots/genome-track-multi/python/altair/plot-dark.html",
  "quality_score": 90.0,
  "license": "MIT",
  "guide": "https://anyplot.ai/llms.txt"
}
Part of Genome Track Viewer on anyplot.ai.