The same plot in 14 other libraries — JavaScript: Chart.js, D3.js, Apache ECharts, Highcharts; Python: Altair, Bokeh, lets-plot, Matplotlib, Plotly, plotnine, Pygal, Seaborn; R: ggplot2; Julia: Makie.jl. Compare all 15 side by side: Genome Track Viewer in Python, R, Julia and JavaScript.
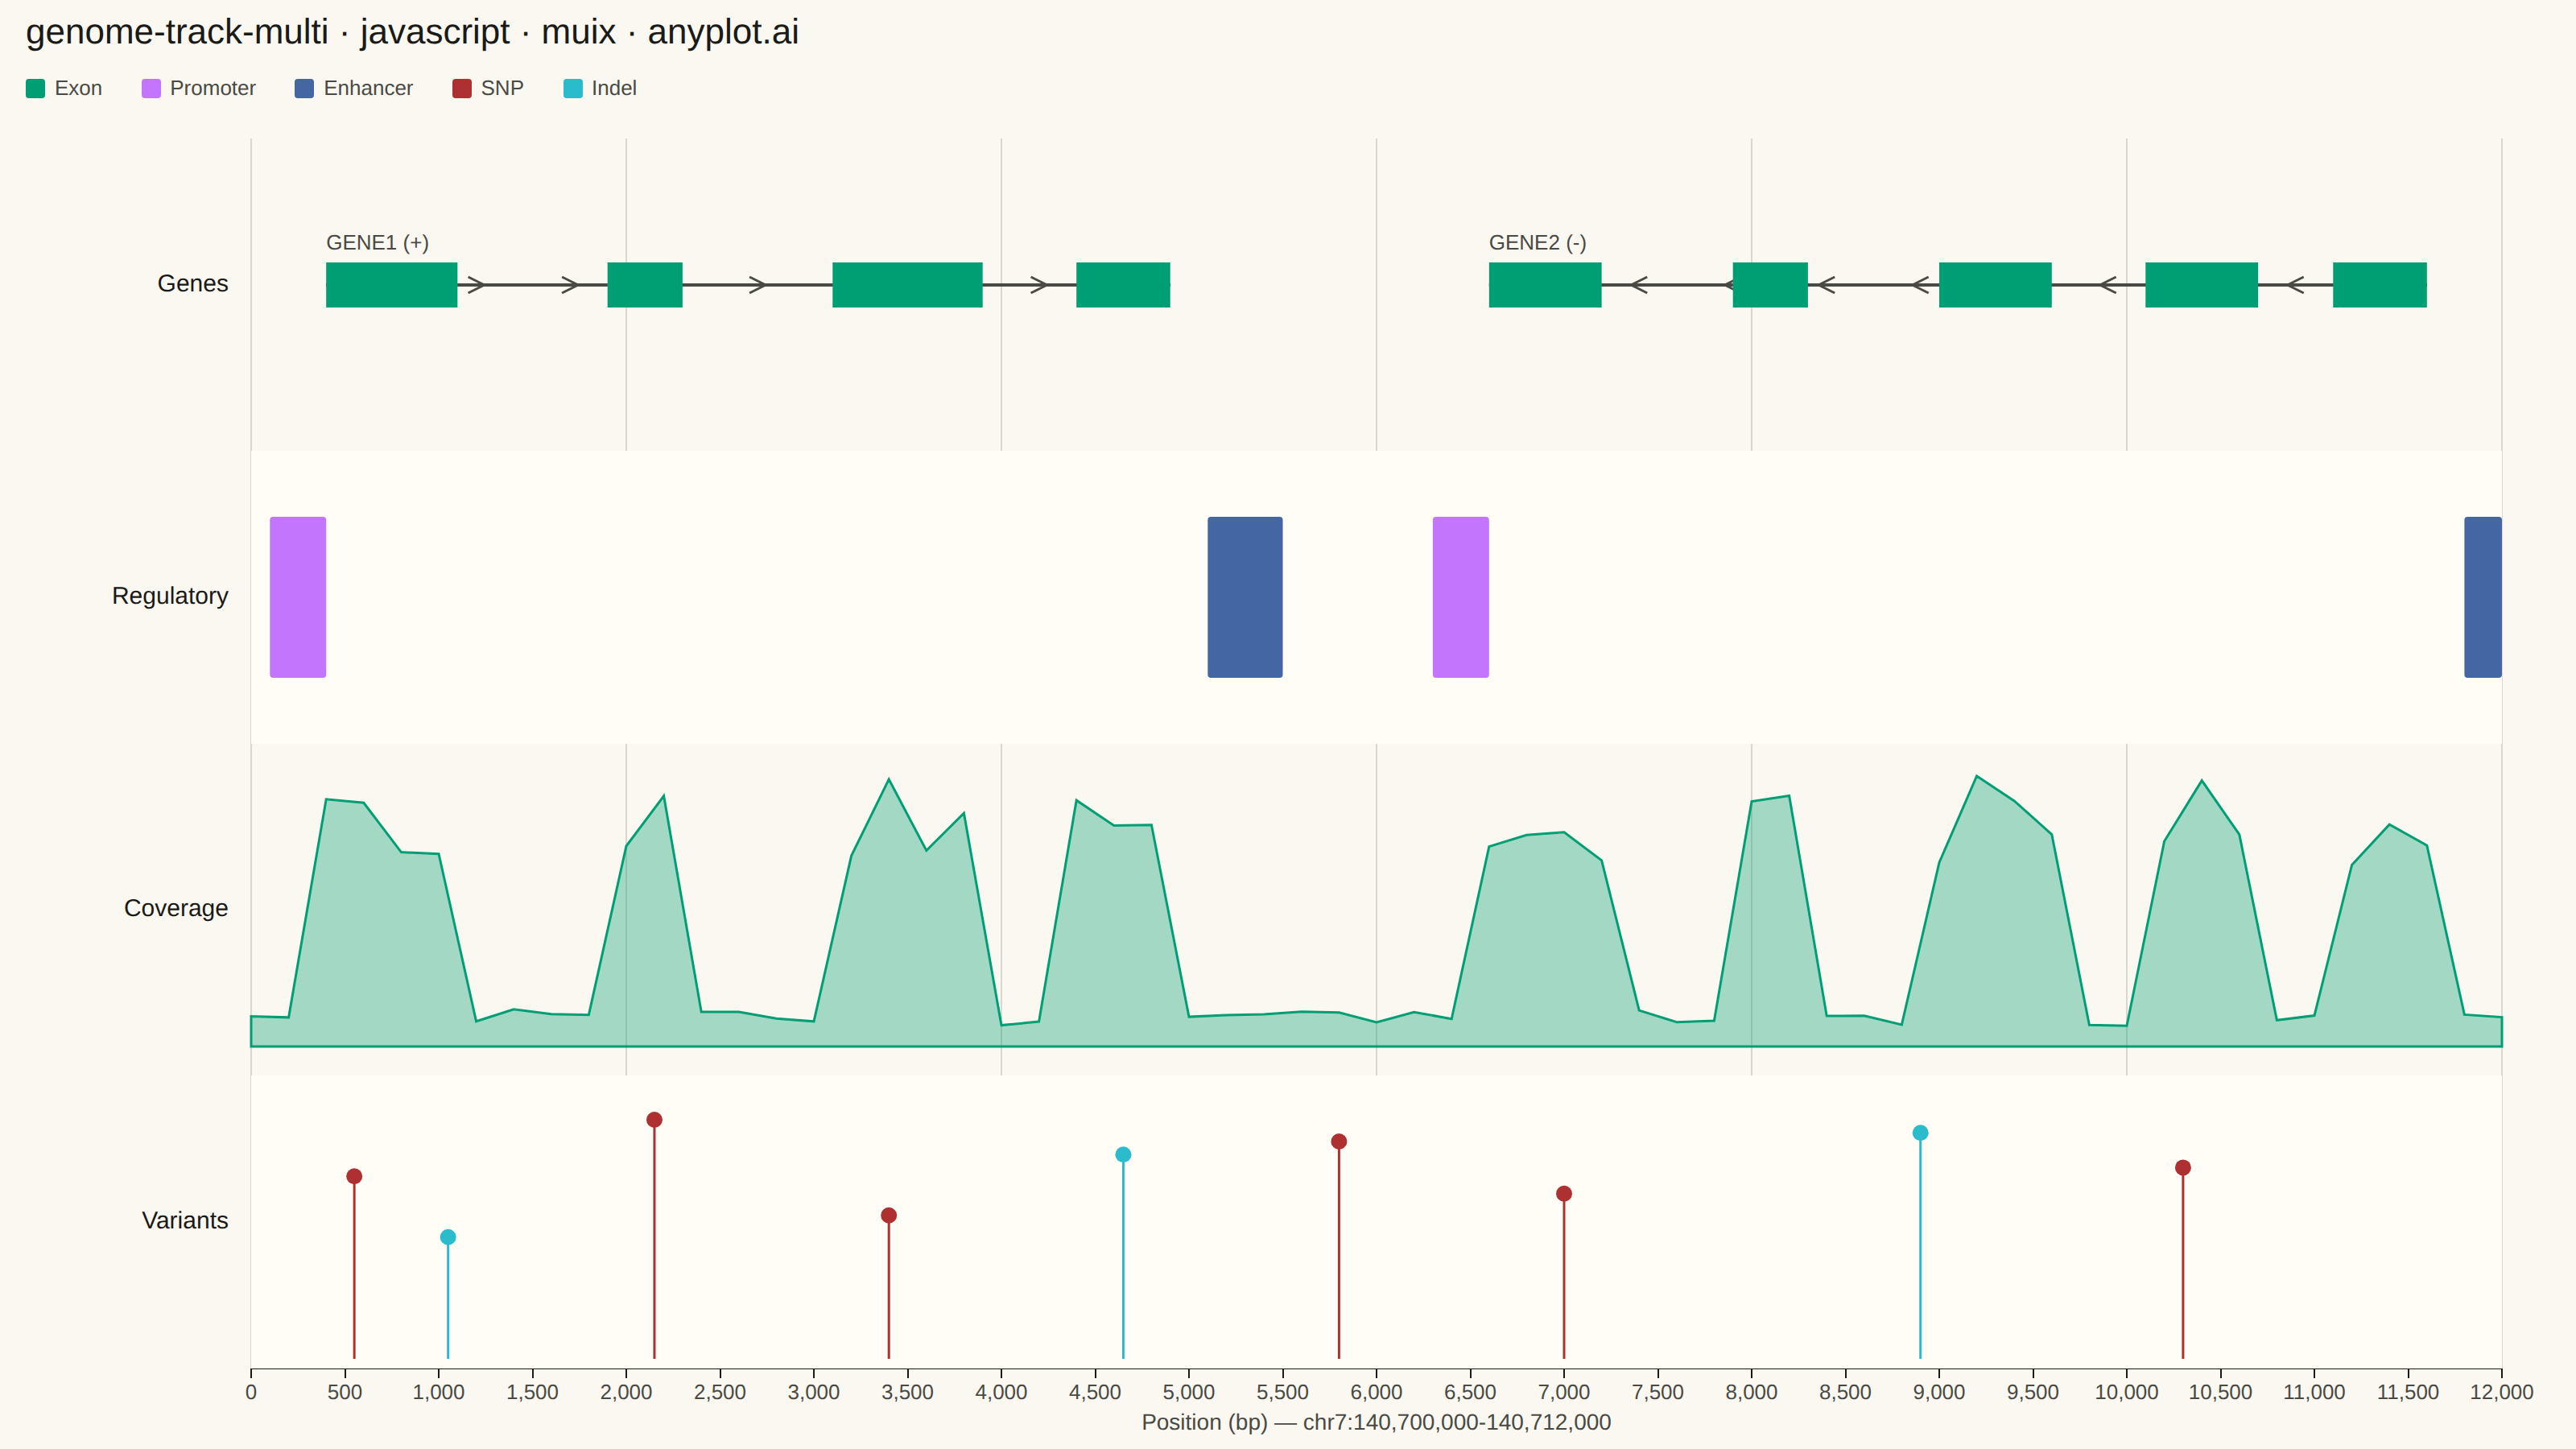
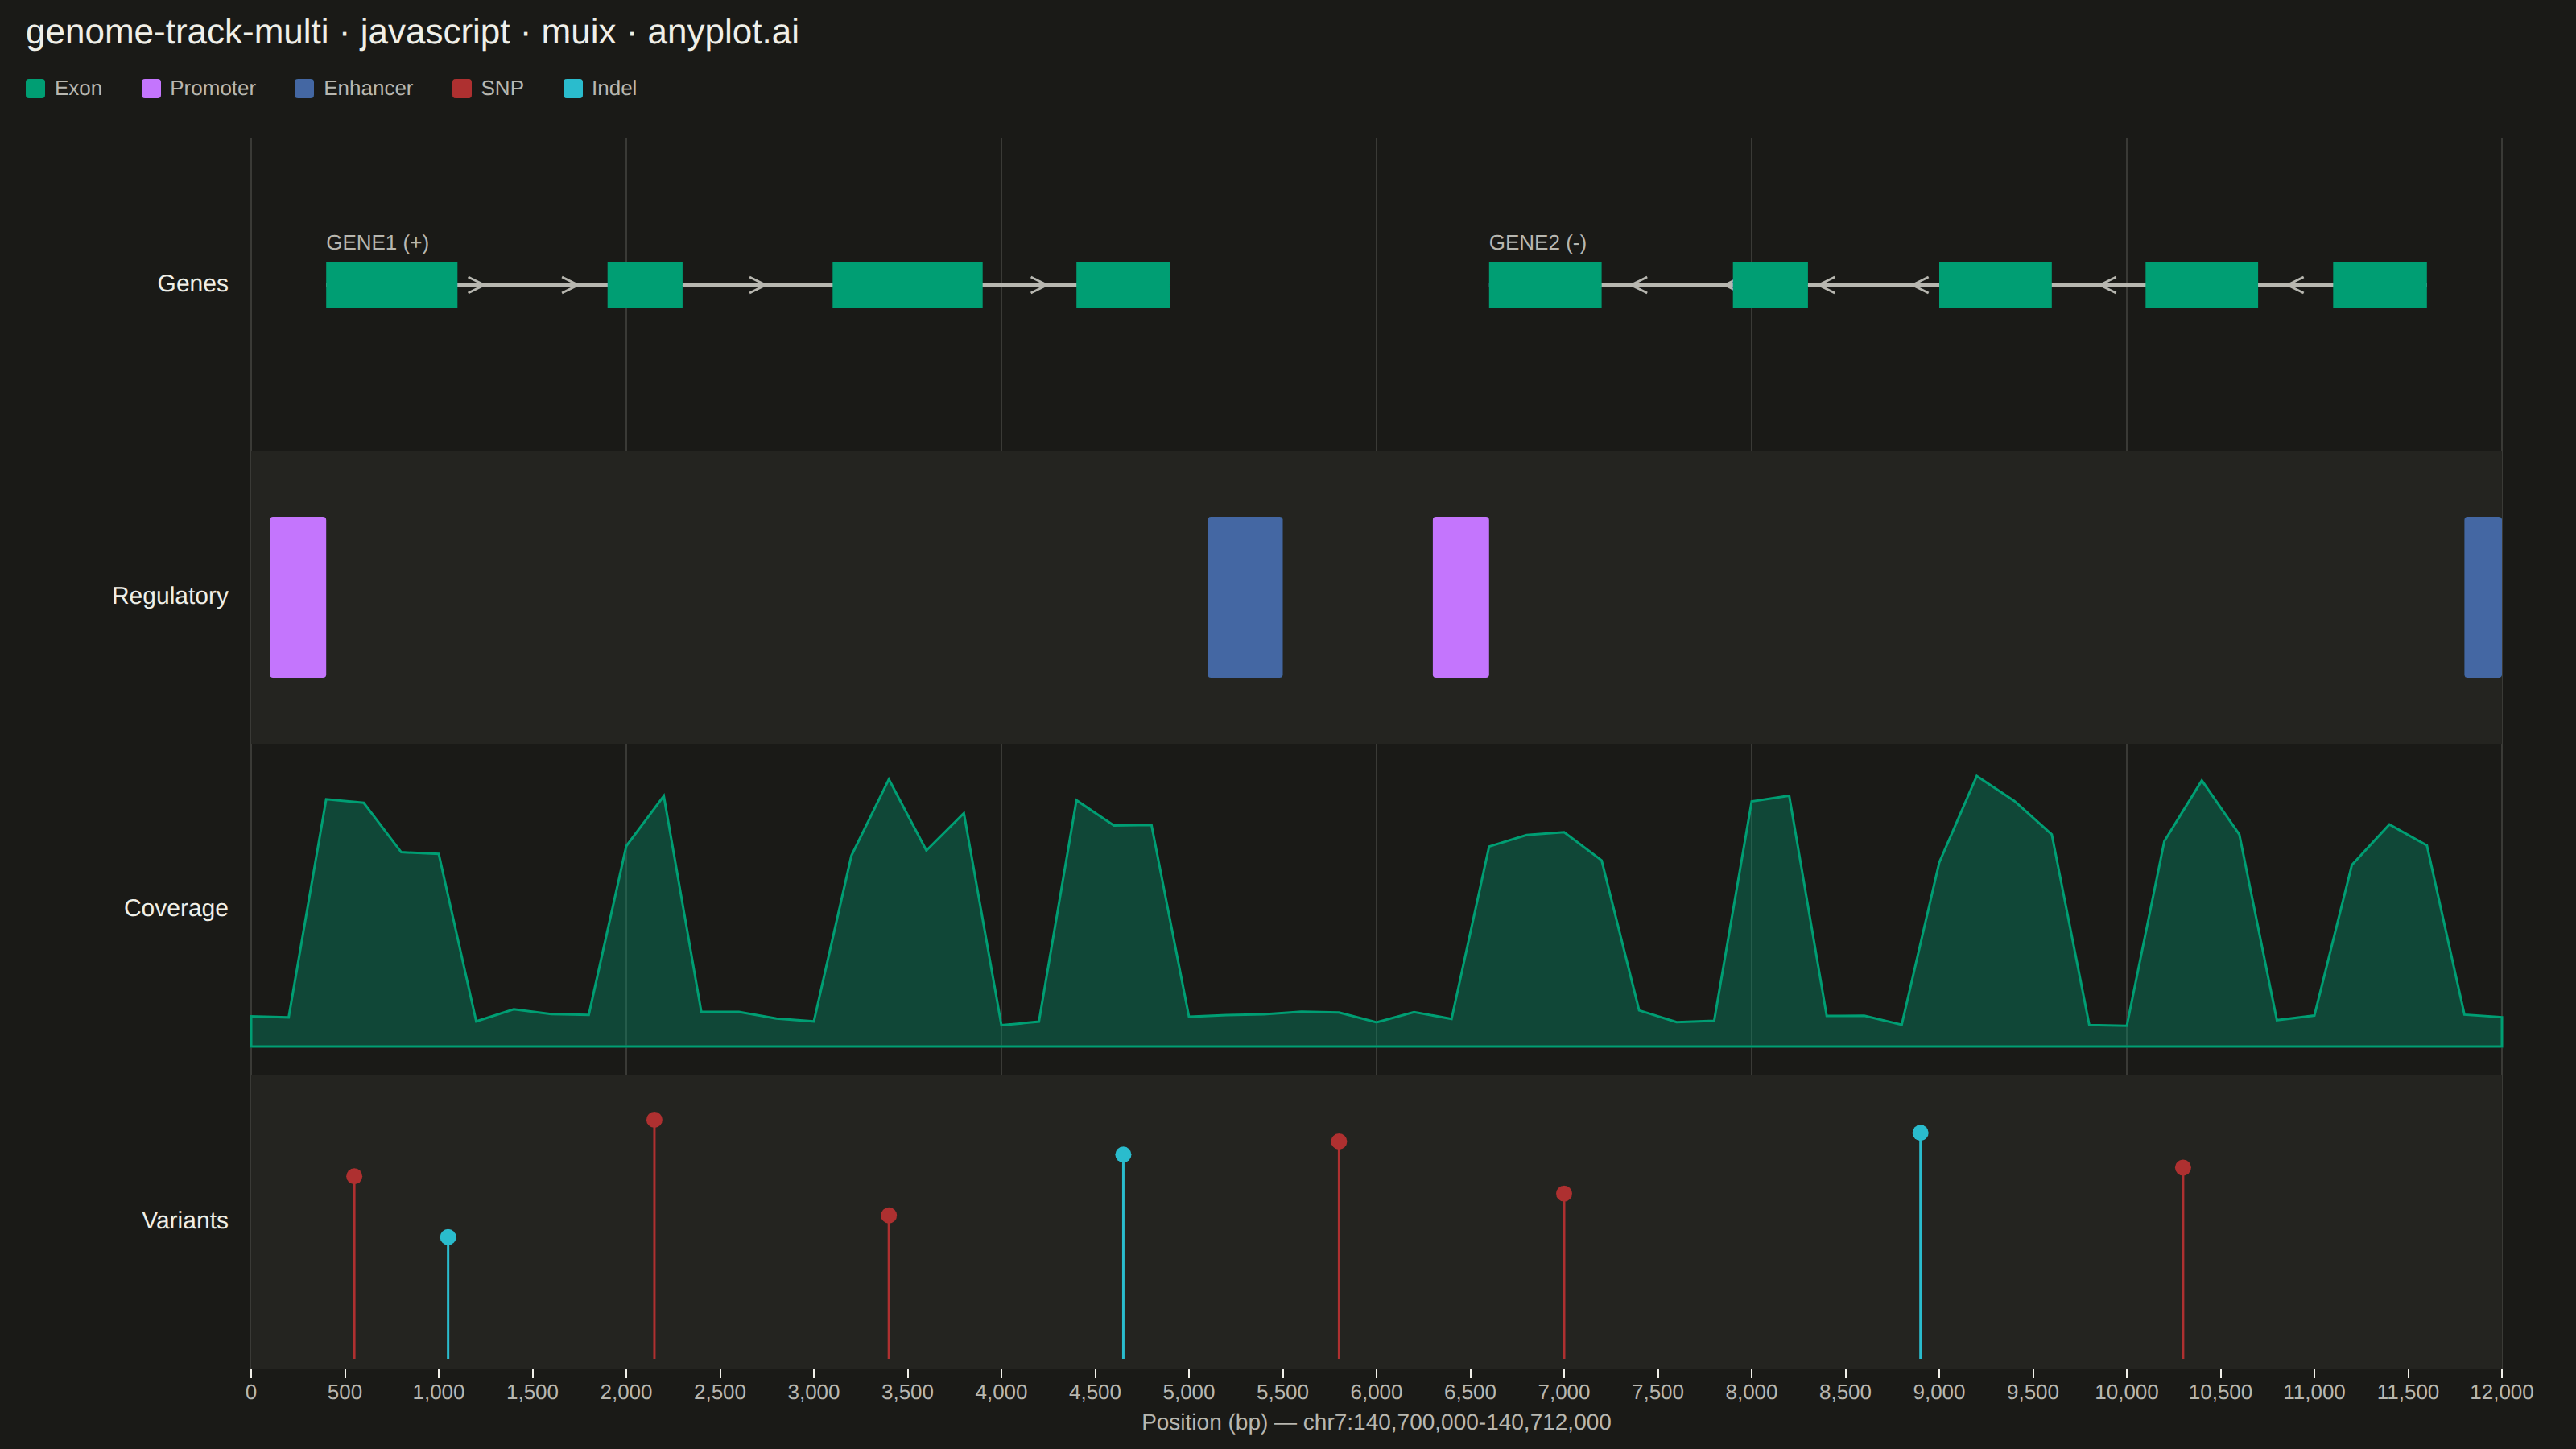
A multi-track genome browser view that displays different types of genomic data aligned along a shared chromosomal coordinate axis. Multiple parallel horizontal tracks (gene annotations, read coverage, variants, regulatory elements) are stacked vertically, each showing a different data type at the same genomic locus. This visualization is essential for integrative genomics, enabling researchers to explore relationships between gene structure, expression, variation, and regulation in a single coordinated view.
// anyplot.ai
// genome-track-multi: Genome Track Viewer
// Library: muix 7.29.1 | JavaScript 22.23.2
// Quality: 95/100 | Created: 2026-08-25
import { ChartContainer } from "@mui/x-charts/ChartContainer";
import { ChartsXAxis } from "@mui/x-charts/ChartsXAxis";
import { useXScale, useDrawingArea } from "@mui/x-charts/hooks";
import Box from "@mui/material/Box";
import Typography from "@mui/material/Typography";

const t = window.ANYPLOT_TOKENS;

// --- Data (in-memory, deterministic) — a 12 kb window at chr7:140,700,000+ --
// Positions are stored as bp offsets from REGION_START so axis ticks stay short.
const REGION_LABEL = "chr7:140,700,000-140,712,000";
const REGION_END = 12000;

const GENES = [
  {
    symbol: "GENE1",
    strand: "+",
    exons: [
      [400, 1100],
      [1900, 2300],
      [3100, 3900],
      [4400, 4900],
    ],
  },
  {
    symbol: "GENE2",
    strand: "-",
    exons: [
      [6600, 7200],
      [7900, 8300],
      [9000, 9600],
      [10100, 10700],
      [11100, 11600],
    ],
  },
];

const REGULATORY = [
  { type: "promoter", start: 100, end: 400 },
  { type: "enhancer", start: 5100, end: 5500 },
  { type: "promoter", start: 6300, end: 6600 },
  { type: "enhancer", start: 11800, end: 12000 },
];

const VARIANTS = [
  { pos: 550, type: "SNP", quality: 42 },
  { pos: 1050, type: "indel", quality: 28 },
  { pos: 2150, type: "SNP", quality: 55 },
  { pos: 3400, type: "SNP", quality: 33 },
  { pos: 4650, type: "indel", quality: 47 },
  { pos: 5800, type: "SNP", quality: 50 },
  { pos: 7000, type: "SNP", quality: 38 },
  { pos: 8900, type: "indel", quality: 52 },
  { pos: 10300, type: "SNP", quality: 44 },
];
const MAX_QUALITY = 60;

// Read-coverage samples every 200 bp, boosted inside exons (RNA-seq-style signal).
const ALL_EXONS = GENES.flatMap((gene) => gene.exons);
function insideExon(offset) {
  return ALL_EXONS.some(([start, end]) => offset >= start && offset <= end);
}

let lcgSeed = 42;
function nextRandom() {
  lcgSeed = (lcgSeed * 1103515245 + 12345) & 0x7fffffff;
  return lcgSeed / 0x7fffffff;
}

const COVERAGE = [];
for (let offset = 0; offset <= REGION_END; offset += 200) {
  const baseline = 6 + nextRandom() * 5;
  const exonBoost = insideExon(offset) ? 45 + nextRandom() * 25 : 0;
  COVERAGE.push({ offset, depth: baseline + exonBoost });
}
const MAX_DEPTH = Math.max(...COVERAGE.map((sample) => sample.depth));

const GRID_STEP = 2000;
const REGULATORY_COLOR = { promoter: t.palette[1], enhancer: t.palette[2] };
const VARIANT_COLOR = { SNP: t.palette[4], indel: t.palette[5] };
const TRACKS = ["Genes", "Regulatory", "Coverage", "Variants"];
const LEGEND_ITEMS = [
  { label: "Exon", color: t.palette[0] },
  { label: "Promoter", color: t.palette[1] },
  { label: "Enhancer", color: t.palette[2] },
  { label: "SNP", color: t.palette[4] },
  { label: "Indel", color: t.palette[5] },
];

const TITLE = "genome-track-multi · javascript · muix · anyplot.ai";
const TITLE_HEIGHT = 40;
const LEGEND_HEIGHT = 30;

// --- Per-track SVG renderers (positioned from the shared genomic x-scale) ---
function GenesTrack({ xScale, top, height }) {
  const centerY = top + height / 2;
  const exonHeight = Math.min(28, height * 0.4);
  const exonTop = centerY - exonHeight / 2;

  return (
    <g>
      {GENES.map((gene) => {
        const geneStart = gene.exons[0][0];
        const geneEnd = gene.exons[gene.exons.length - 1][1];
        const arrowOffsets = [];
        for (let offset = geneStart + 300; offset < geneEnd; offset += 500) {
          arrowOffsets.push(offset);
        }

        return (
          <g key={gene.symbol}>
            <line x1={xScale(geneStart)} x2={xScale(geneEnd)} y1={centerY} y2={centerY} stroke={t.inkSoft} strokeWidth={2} />
            {arrowOffsets.map((offset) => {
              const x = xScale(offset);
              const dx = gene.strand === "+" ? 5 : -5;
              return (
                <path
                  key={`${gene.symbol}-arrow-${offset}`}
                  d={`M ${x - dx} ${centerY - 5} L ${x + dx} ${centerY} L ${x - dx} ${centerY + 5}`}
                  stroke={t.inkSoft}
                  strokeWidth={1.5}
                  fill="none"
                />
              );
            })}
            {gene.exons.map(([start, end]) => (
              <rect
                key={`${gene.symbol}-${start}`}
                x={xScale(start)}
                y={exonTop}
                width={Math.max(1, xScale(end) - xScale(start))}
                height={exonHeight}
                fill={t.palette[0]}
              />
            ))}
            <text x={xScale(geneStart)} y={exonTop - 8} fontSize={13} fill={t.inkSoft}>
              {`${gene.symbol} (${gene.strand})`}
            </text>
          </g>
        );
      })}
    </g>
  );
}

function RegulatoryTrack({ xScale, top, height }) {
  const rectHeight = height * 0.55;
  const rectTop = top + (height - rectHeight) / 2;

  return (
    <g>
      {REGULATORY.map((element) => (
        <rect
          key={`${element.type}-${element.start}`}
          x={xScale(element.start)}
          y={rectTop}
          width={Math.max(2, xScale(element.end) - xScale(element.start))}
          height={rectHeight}
          fill={REGULATORY_COLOR[element.type]}
          rx={2}
        />
      ))}
    </g>
  );
}

function CoverageTrack({ xScale, top, height }) {
  const baseline = top + height - 6;
  const usableHeight = height - 14;
  const points = COVERAGE.map((sample) => {
    const x = xScale(sample.offset);
    const y = baseline - (sample.depth / MAX_DEPTH) * usableHeight;
    return `${x},${y}`;
  });
  const firstX = xScale(COVERAGE[0].offset);
  const lastX = xScale(COVERAGE[COVERAGE.length - 1].offset);
  const areaPath = `M ${firstX},${baseline} L ${points.join(" L ")} L ${lastX},${baseline} Z`;

  return <path d={areaPath} fill={t.palette[0]} fillOpacity={0.35} stroke={t.palette[0]} strokeWidth={1.5} />;
}

function VariantsTrack({ xScale, top, height }) {
  const baseline = top + height - 6;
  const usableHeight = height - 20;

  return (
    <g>
      {VARIANTS.map((variant) => {
        const x = xScale(variant.pos);
        const stemTop = baseline - (variant.quality / MAX_QUALITY) * usableHeight;
        const color = VARIANT_COLOR[variant.type];
        return (
          <g key={`variant-${variant.pos}`}>
            <line x1={x} x2={x} y1={baseline} y2={stemTop} stroke={color} strokeWidth={1.5} />
            <circle cx={x} cy={stemTop} r={5} fill={color} />
          </g>
        );
      })}
    </g>
  );
}

// Reads the container's real x-scale so every track lines up on one genomic
// axis, and lays out track bands from the drawing area — not an approximation.
function GenomeTracks() {
  const xScale = useXScale();
  const drawing = useDrawingArea();
  const gap = 12;
  const bandHeight = (drawing.height - gap * (TRACKS.length - 1)) / TRACKS.length;
  const bandTop = (index) => drawing.top + index * (bandHeight + gap);
  const gridOffsets = Array.from({ length: Math.floor(REGION_END / GRID_STEP) + 1 }, (_, i) => i * GRID_STEP);

  return (
    <g>
      {gridOffsets.map((offset) => (
        <line
          key={`grid-${offset}`}
          x1={xScale(offset)}
          x2={xScale(offset)}
          y1={drawing.top}
          y2={drawing.top + drawing.height}
          stroke={t.grid}
          strokeWidth={1}
        />
      ))}
      {TRACKS.map((_, index) =>
        index % 2 === 1 ? (
          <rect key={`band-${index}`} x={drawing.left} y={bandTop(index)} width={drawing.width} height={bandHeight} fill={t.elevatedBg} />
        ) : null,
      )}
      {TRACKS.map((label, index) => (
        <text key={`label-${index}`} x={drawing.left - 14} y={bandTop(index) + bandHeight / 2} textAnchor="end" dominantBaseline="middle" fontSize={15} fontWeight={500} fill={t.ink}>
          {label}
        </text>
      ))}
      <GenesTrack xScale={xScale} top={bandTop(0)} height={bandHeight} />
      <RegulatoryTrack xScale={xScale} top={bandTop(1)} height={bandHeight} />
      <CoverageTrack xScale={xScale} top={bandTop(2)} height={bandHeight} />
      <VariantsTrack xScale={xScale} top={bandTop(3)} height={bandHeight} />
    </g>
  );
}

// --- Chart (default-exported component — the harness mounts it) -------------
export default function Chart() {
  const width = window.ANYPLOT_SIZE.width;
  const height = window.ANYPLOT_SIZE.height;
  const chartHeight = height - TITLE_HEIGHT - LEGEND_HEIGHT;

  return (
    <Box sx={{ width, height, display: "flex", flexDirection: "column", boxSizing: "border-box", px: 2 }}>
      <Typography sx={{ fontSize: 22, fontWeight: 500, color: t.ink, lineHeight: `${TITLE_HEIGHT}px` }}>{TITLE}</Typography>
      <Box sx={{ display: "flex", alignItems: "center", gap: 3, height: LEGEND_HEIGHT }}>
        {LEGEND_ITEMS.map((item) => (
          <Box key={item.label} sx={{ display: "flex", alignItems: "center", gap: 0.75 }}>
            <Box sx={{ width: 12, height: 12, borderRadius: "2px", bgcolor: item.color }} />
            <Typography sx={{ fontSize: 13, color: t.inkSoft }}>{item.label}</Typography>
          </Box>
        ))}
      </Box>
      <ChartContainer
        width={width - 32}
        height={chartHeight}
        series={[]}
        skipAnimation
        margin={{ left: 140, right: 30, top: 16, bottom: 50 }}
        xAxis={[
          {
            id: "genomicPosition",
            scaleType: "linear",
            min: 0,
            max: REGION_END,
            valueFormatter: (value) => value.toLocaleString("en-US"),
            tickLabelStyle: { fontSize: 13, fill: t.inkSoft },
            label: `Position (bp) — ${REGION_LABEL}`,
            labelStyle: { fontSize: 14, fill: t.inkSoft },
          },
        ]}
      >
        <ChartsXAxis />
        <GenomeTracks />
      </ChartContainer>
    </Box>
  );
}
Runnable source as JSON, for any HTTP client: https://api.anyplot.ai/specs/genome-track-multi/muix/code. Any spec id and library id listed in llms-full.txt fit the same URL shape; every URL below is complete and callable.
{
  "spec_id": "genome-track-multi",
  "language": "javascript",
  "library": "muix",
  "page": "https://anyplot.ai/genome-track-multi/javascript/muix",
  "hub": "https://anyplot.ai/genome-track-multi",
  "code_json": "https://api.anyplot.ai/specs/genome-track-multi/muix/code",
  "spec_json": "https://api.anyplot.ai/specs/genome-track-multi",
  "render_light_png": "https://storage.googleapis.com/anyplot-images/plots/genome-track-multi/javascript/muix/plot-light.png",
  "render_dark_png": "https://storage.googleapis.com/anyplot-images/plots/genome-track-multi/javascript/muix/plot-dark.png",
  "interactive_light_html": "https://storage.googleapis.com/anyplot-images/plots/genome-track-multi/javascript/muix/plot-light.html",
  "interactive_dark_html": "https://storage.googleapis.com/anyplot-images/plots/genome-track-multi/javascript/muix/plot-dark.html",
  "quality_score": 95.0,
  "license": "MIT",
  "guide": "https://anyplot.ai/llms.txt"
}
Part of Genome Track Viewer on anyplot.ai.