Source code in 15 libraries — Python: Altair, Bokeh, lets-plot, Matplotlib, Plotly, plotnine, Pygal, Seaborn; R: ggplot2; Julia: Makie.jl; JavaScript: Chart.js, D3.js, Apache ECharts, Highcharts, MUI X Charts.
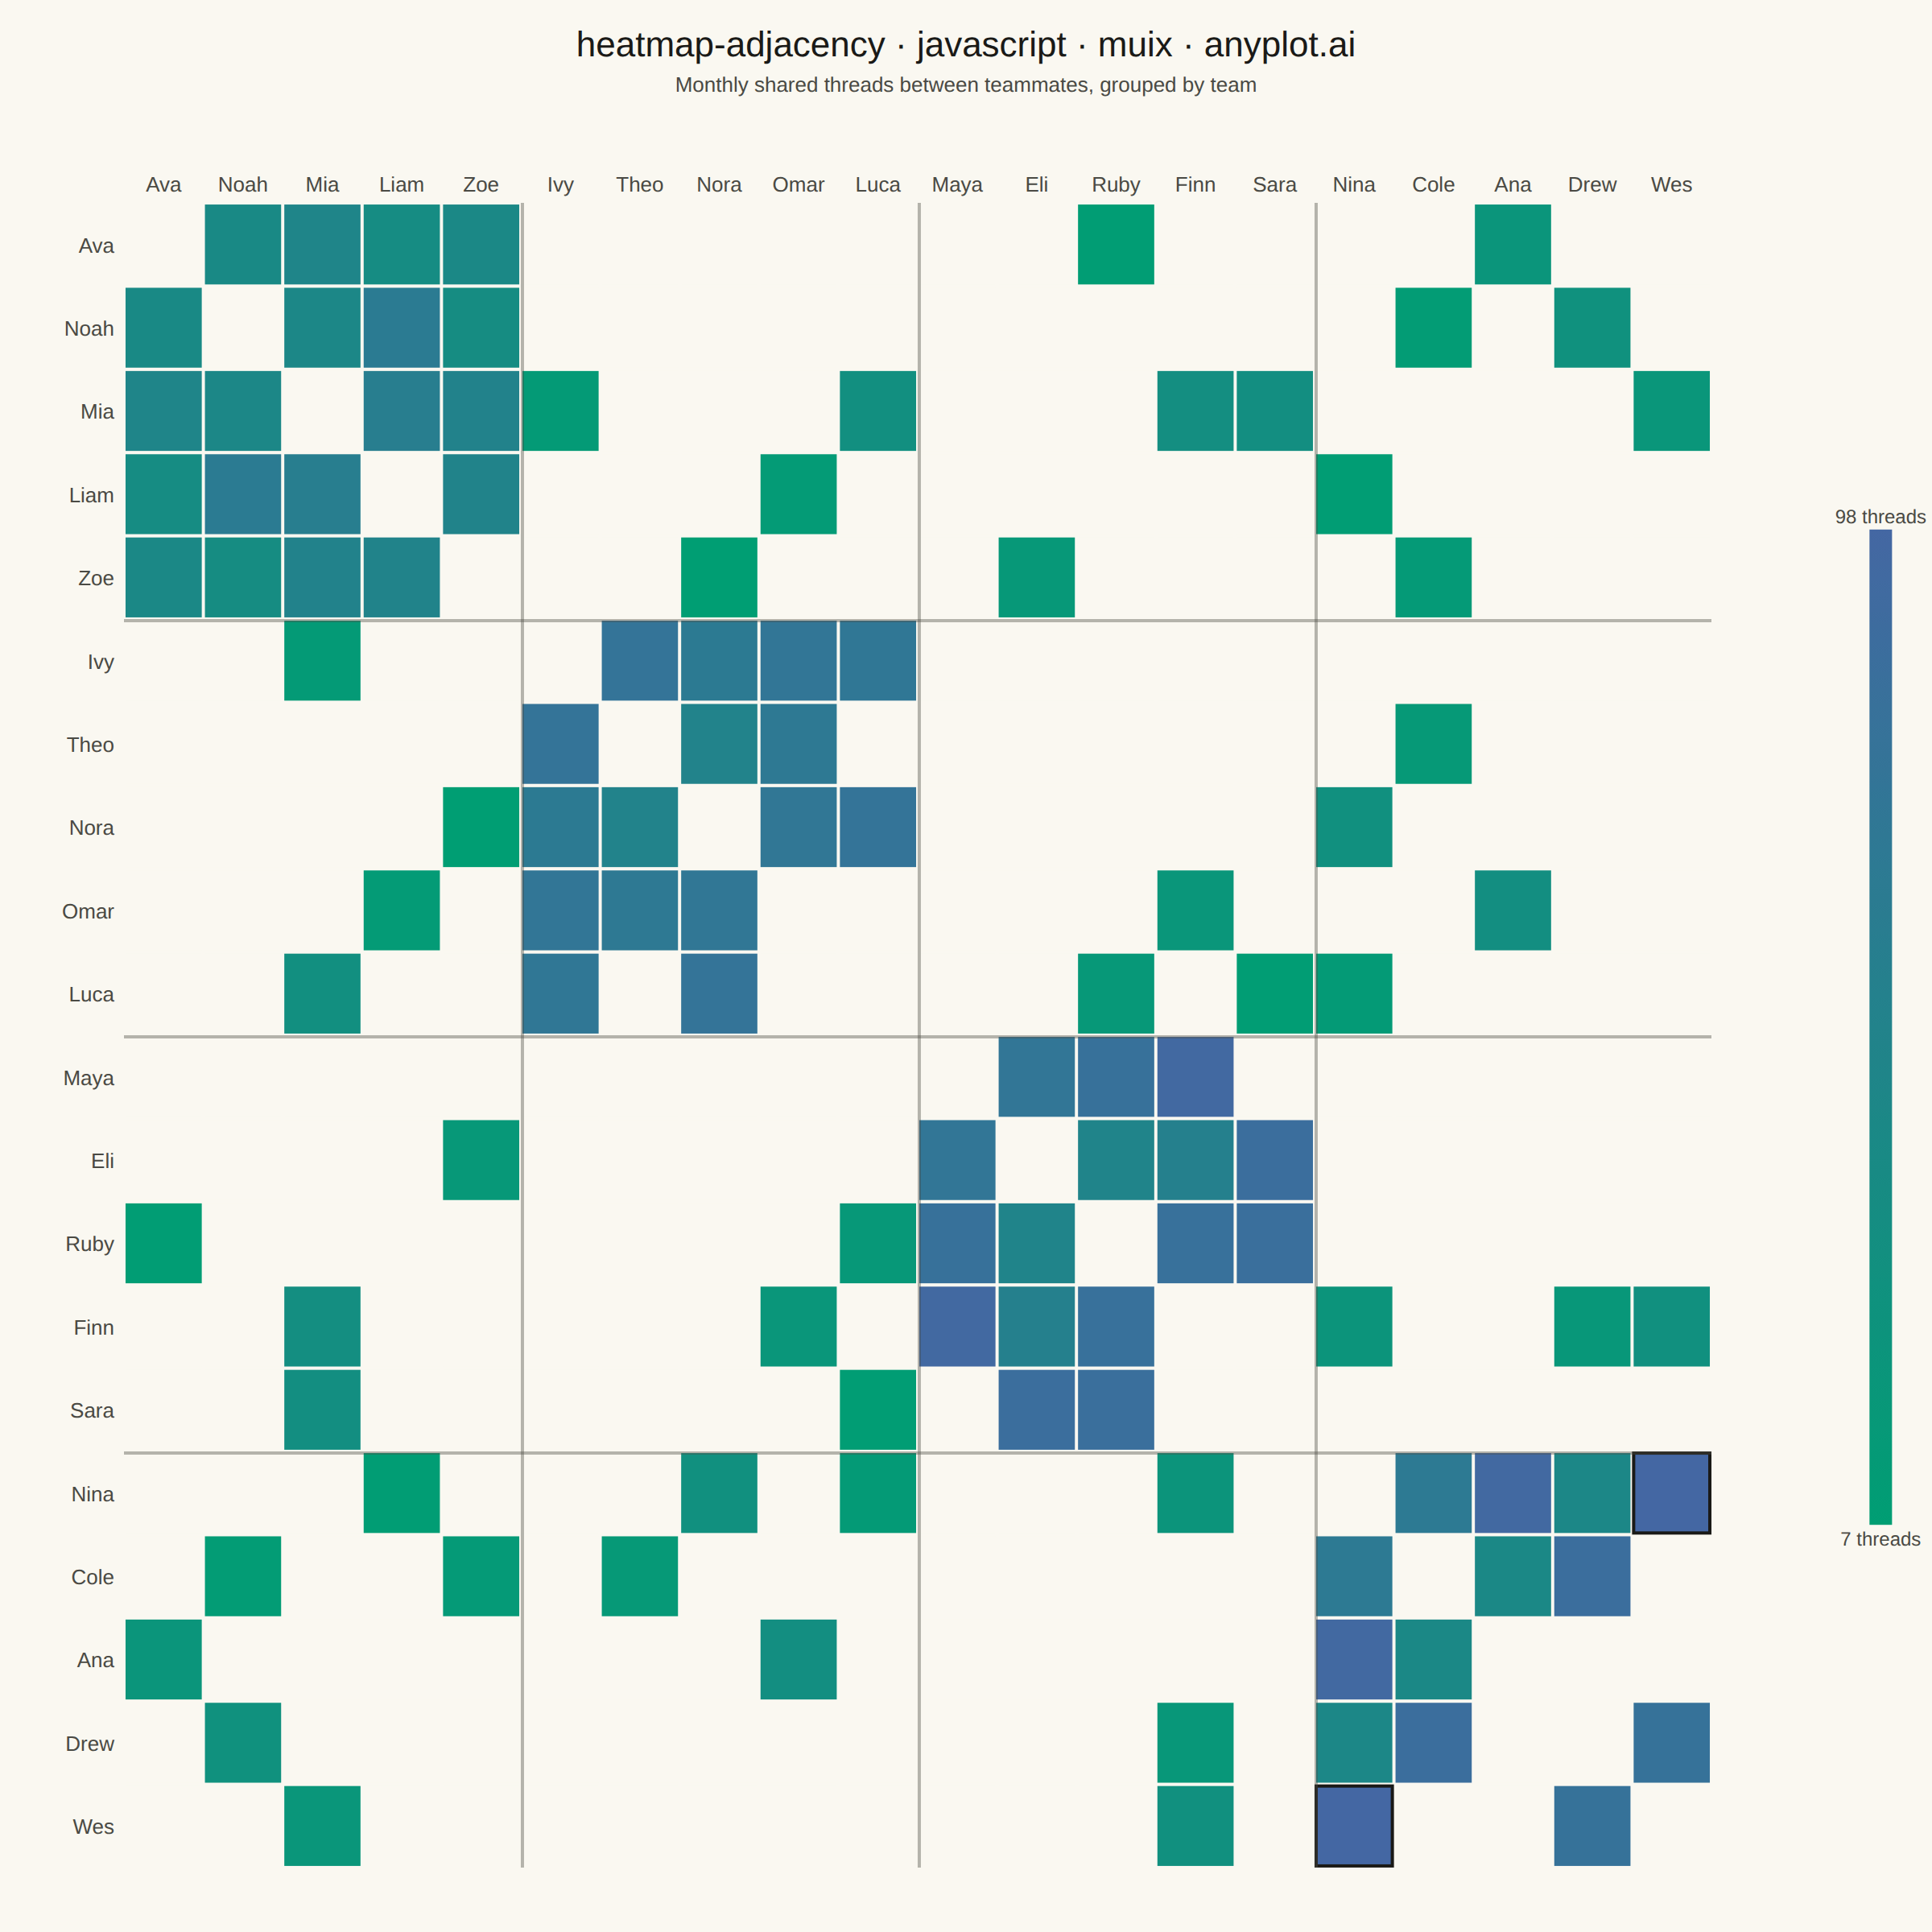
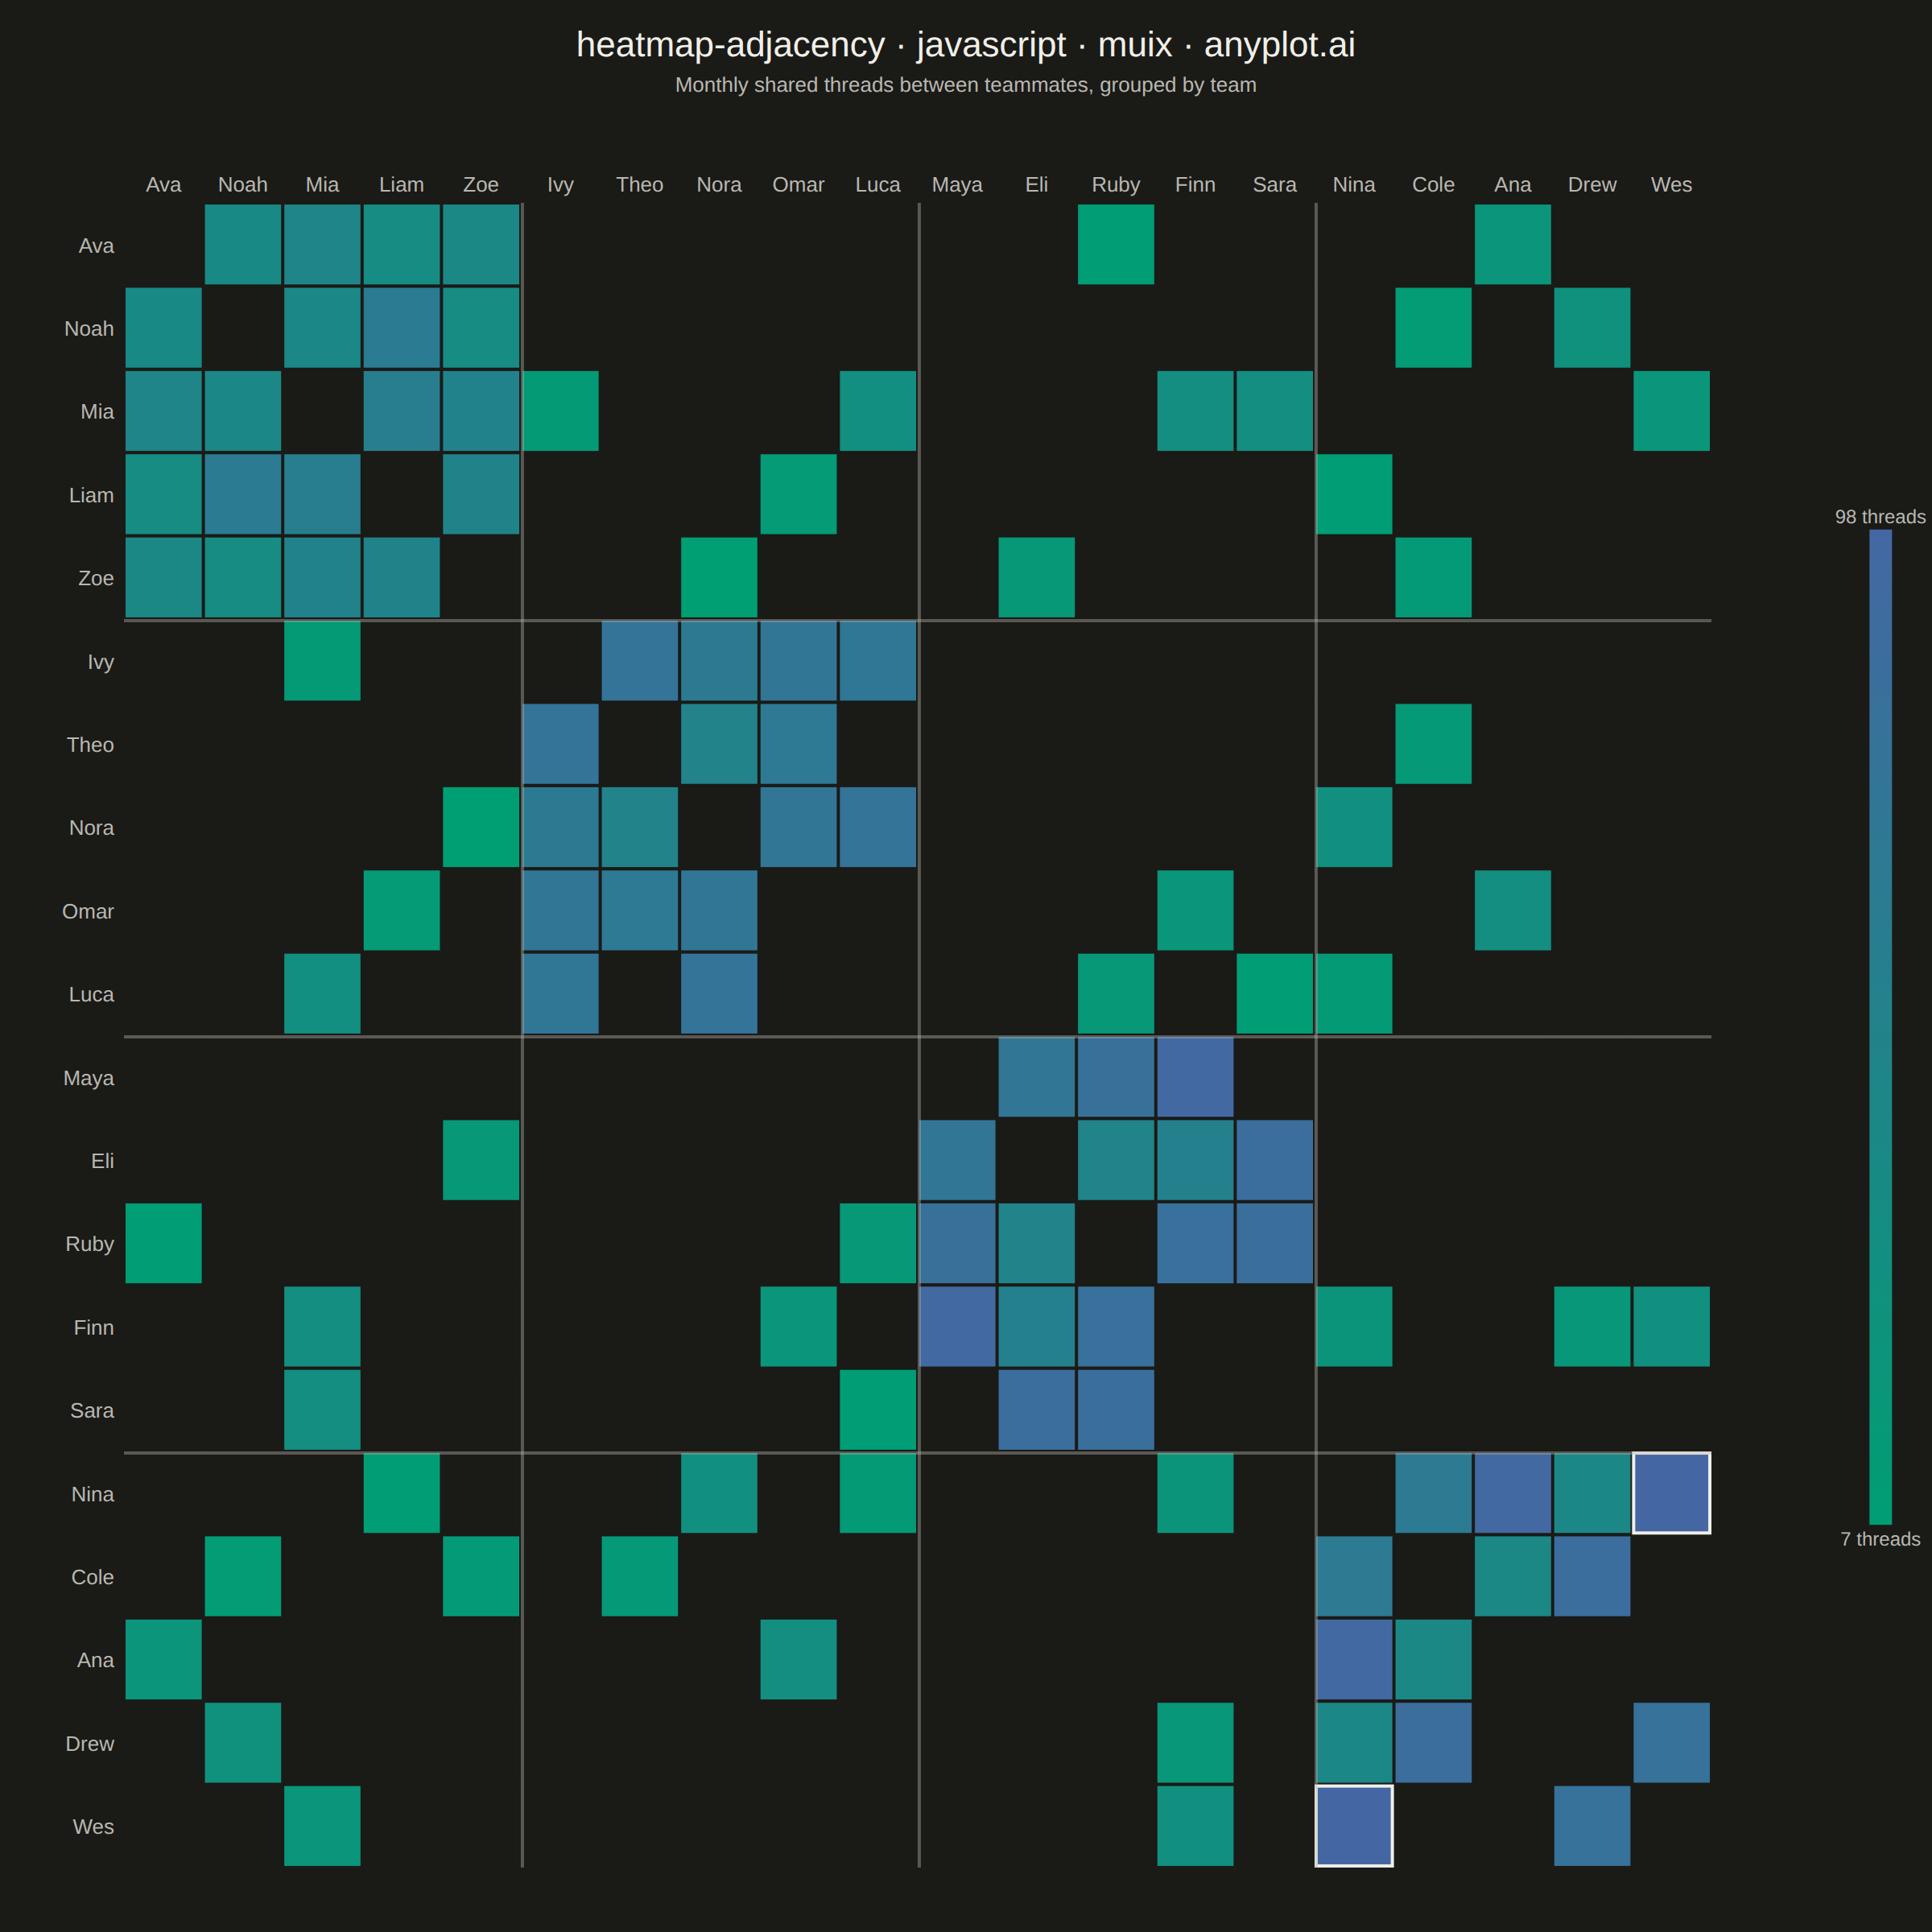
A matrix-based representation of a network or graph where rows and columns represent nodes and cell color indicates the presence or weight of edges between them. This visualization complements node-link diagrams by excelling at revealing clusters, structural patterns, and density in large or dense networks where node-link layouts become cluttered. Reordering nodes by cluster, degree, or community membership exposes block-diagonal structure and makes group boundaries immediately visible.
Preview render from the MUI X Charts implementation.