The same plot in 14 other libraries — Python: Altair, Bokeh, lets-plot, Matplotlib, Plotly, plotnine, Seaborn; R: ggplot2; Julia: Makie.jl; JavaScript: Chart.js, D3.js, Apache ECharts, Highcharts, MUI X Charts. Compare all 15 side by side: Network Adjacency Matrix Heatmap in Python, R, Julia and JavaScript.
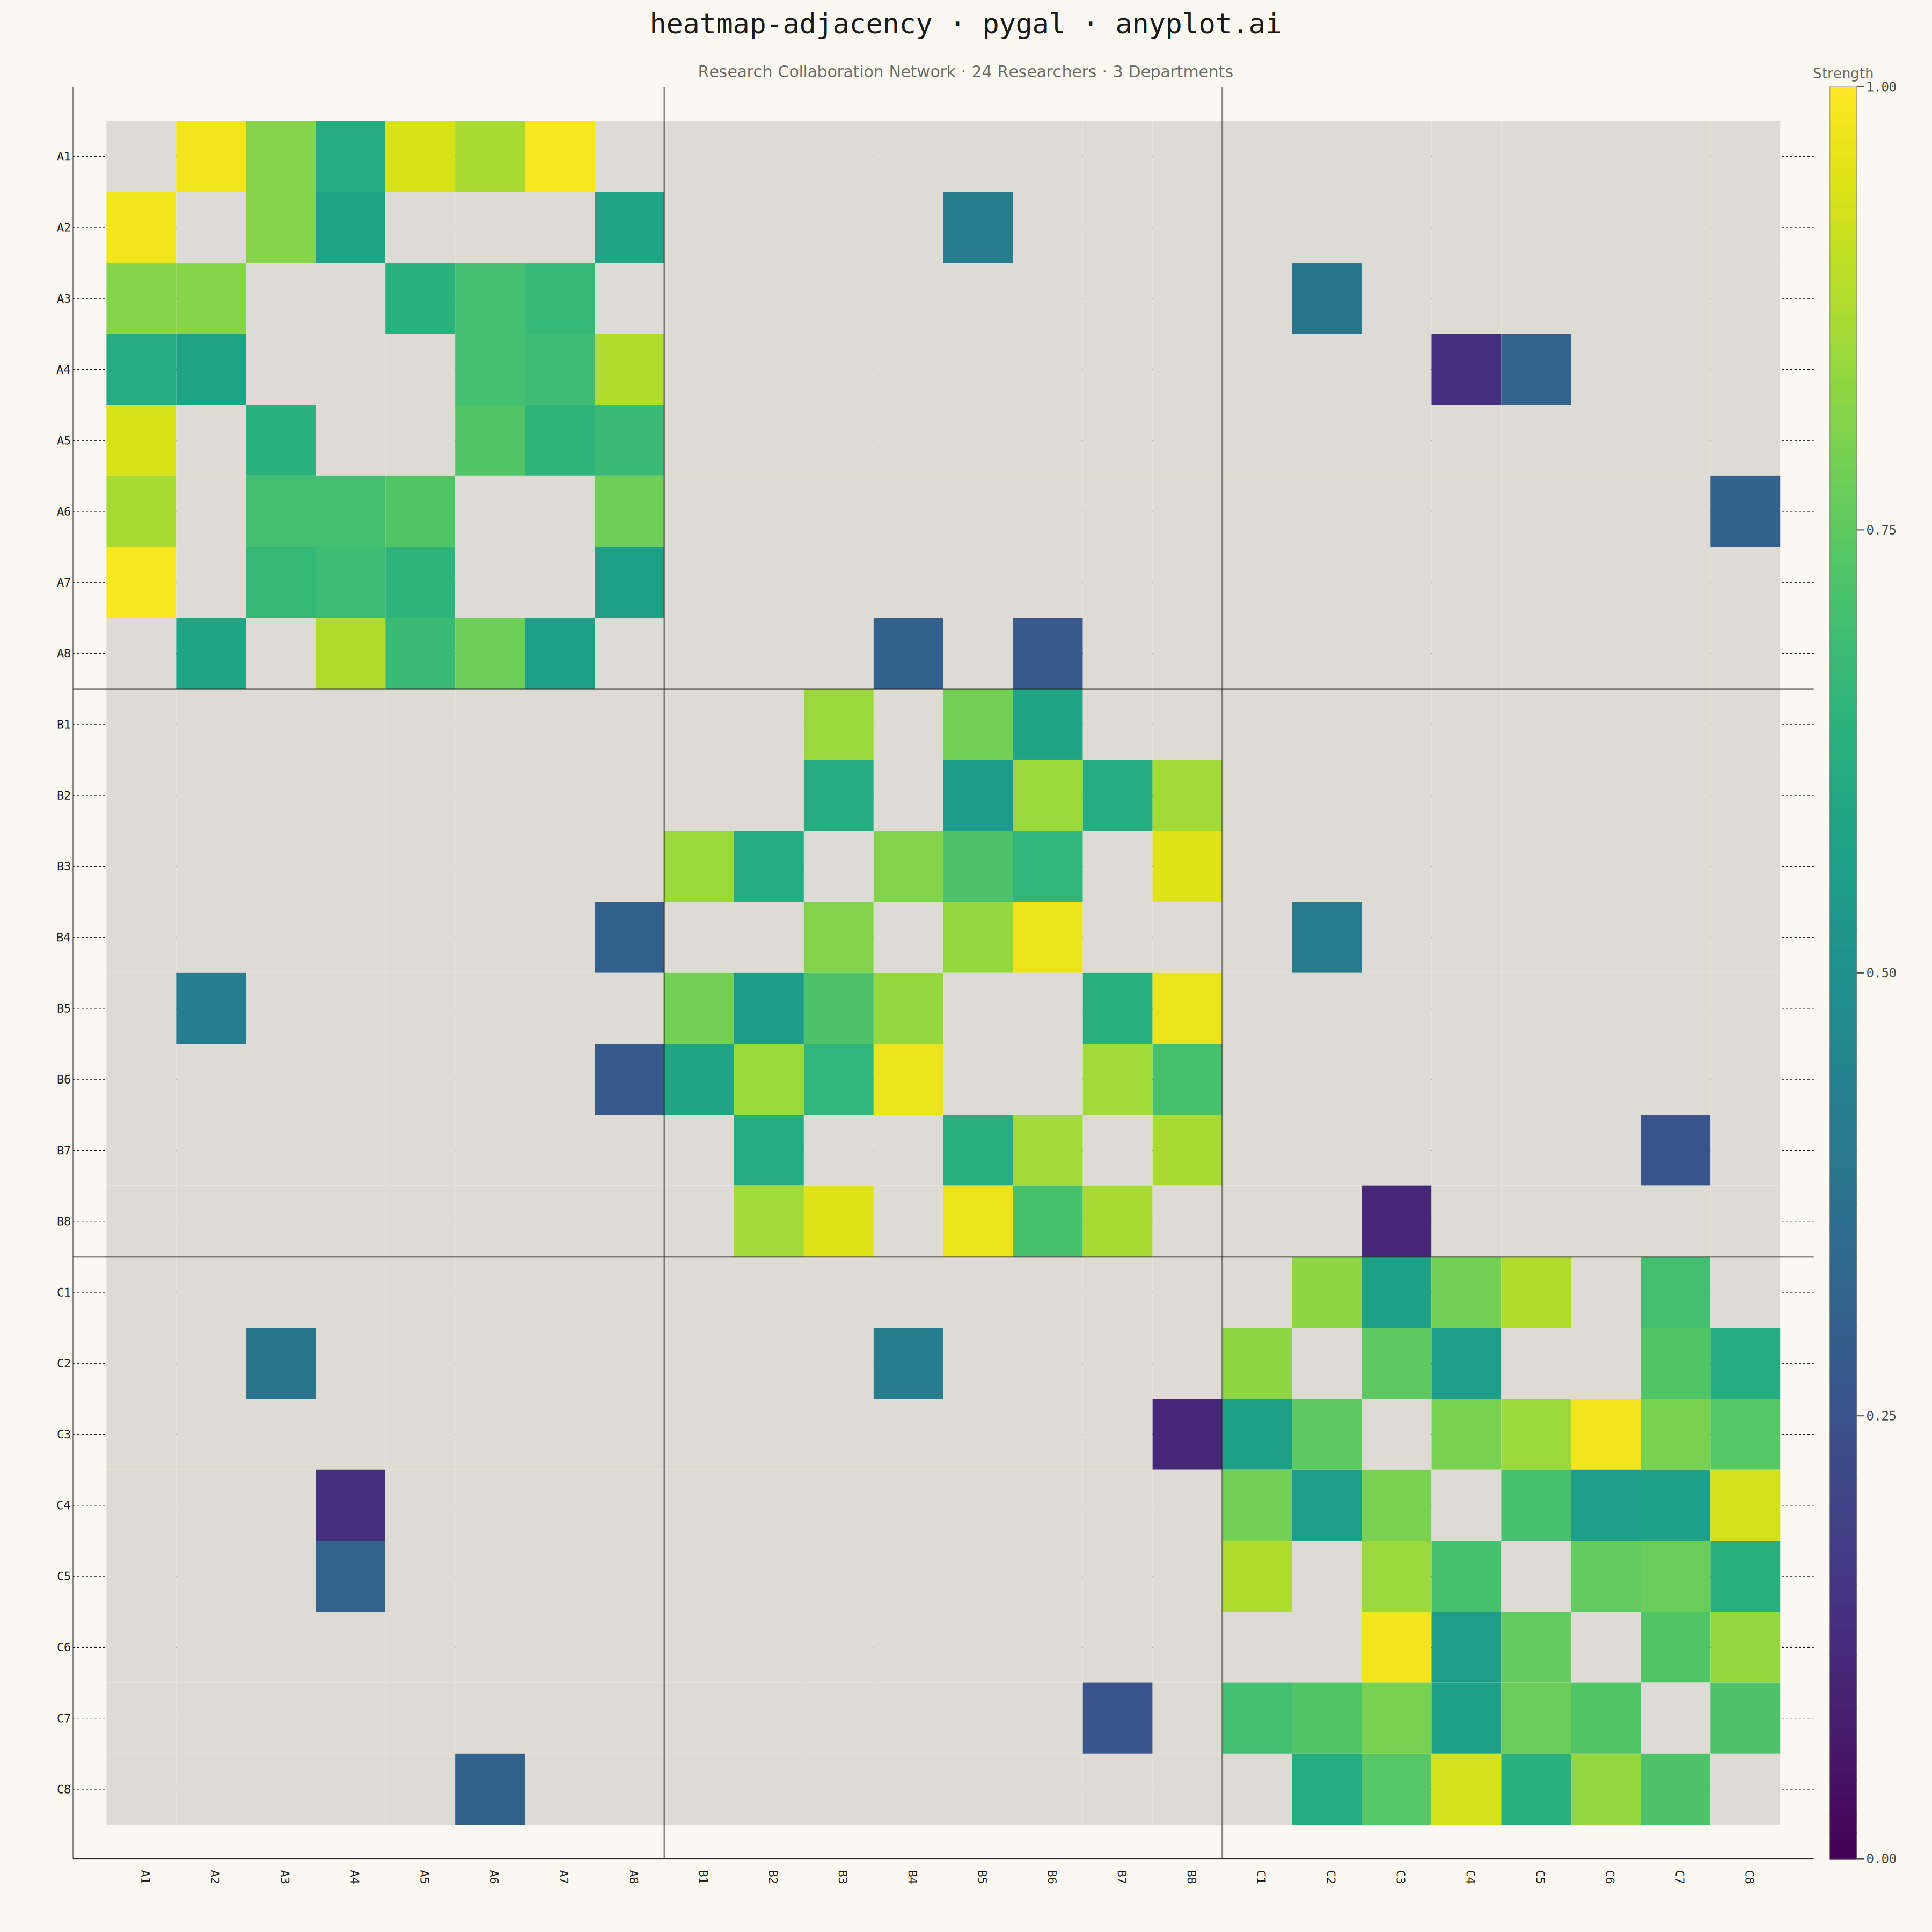
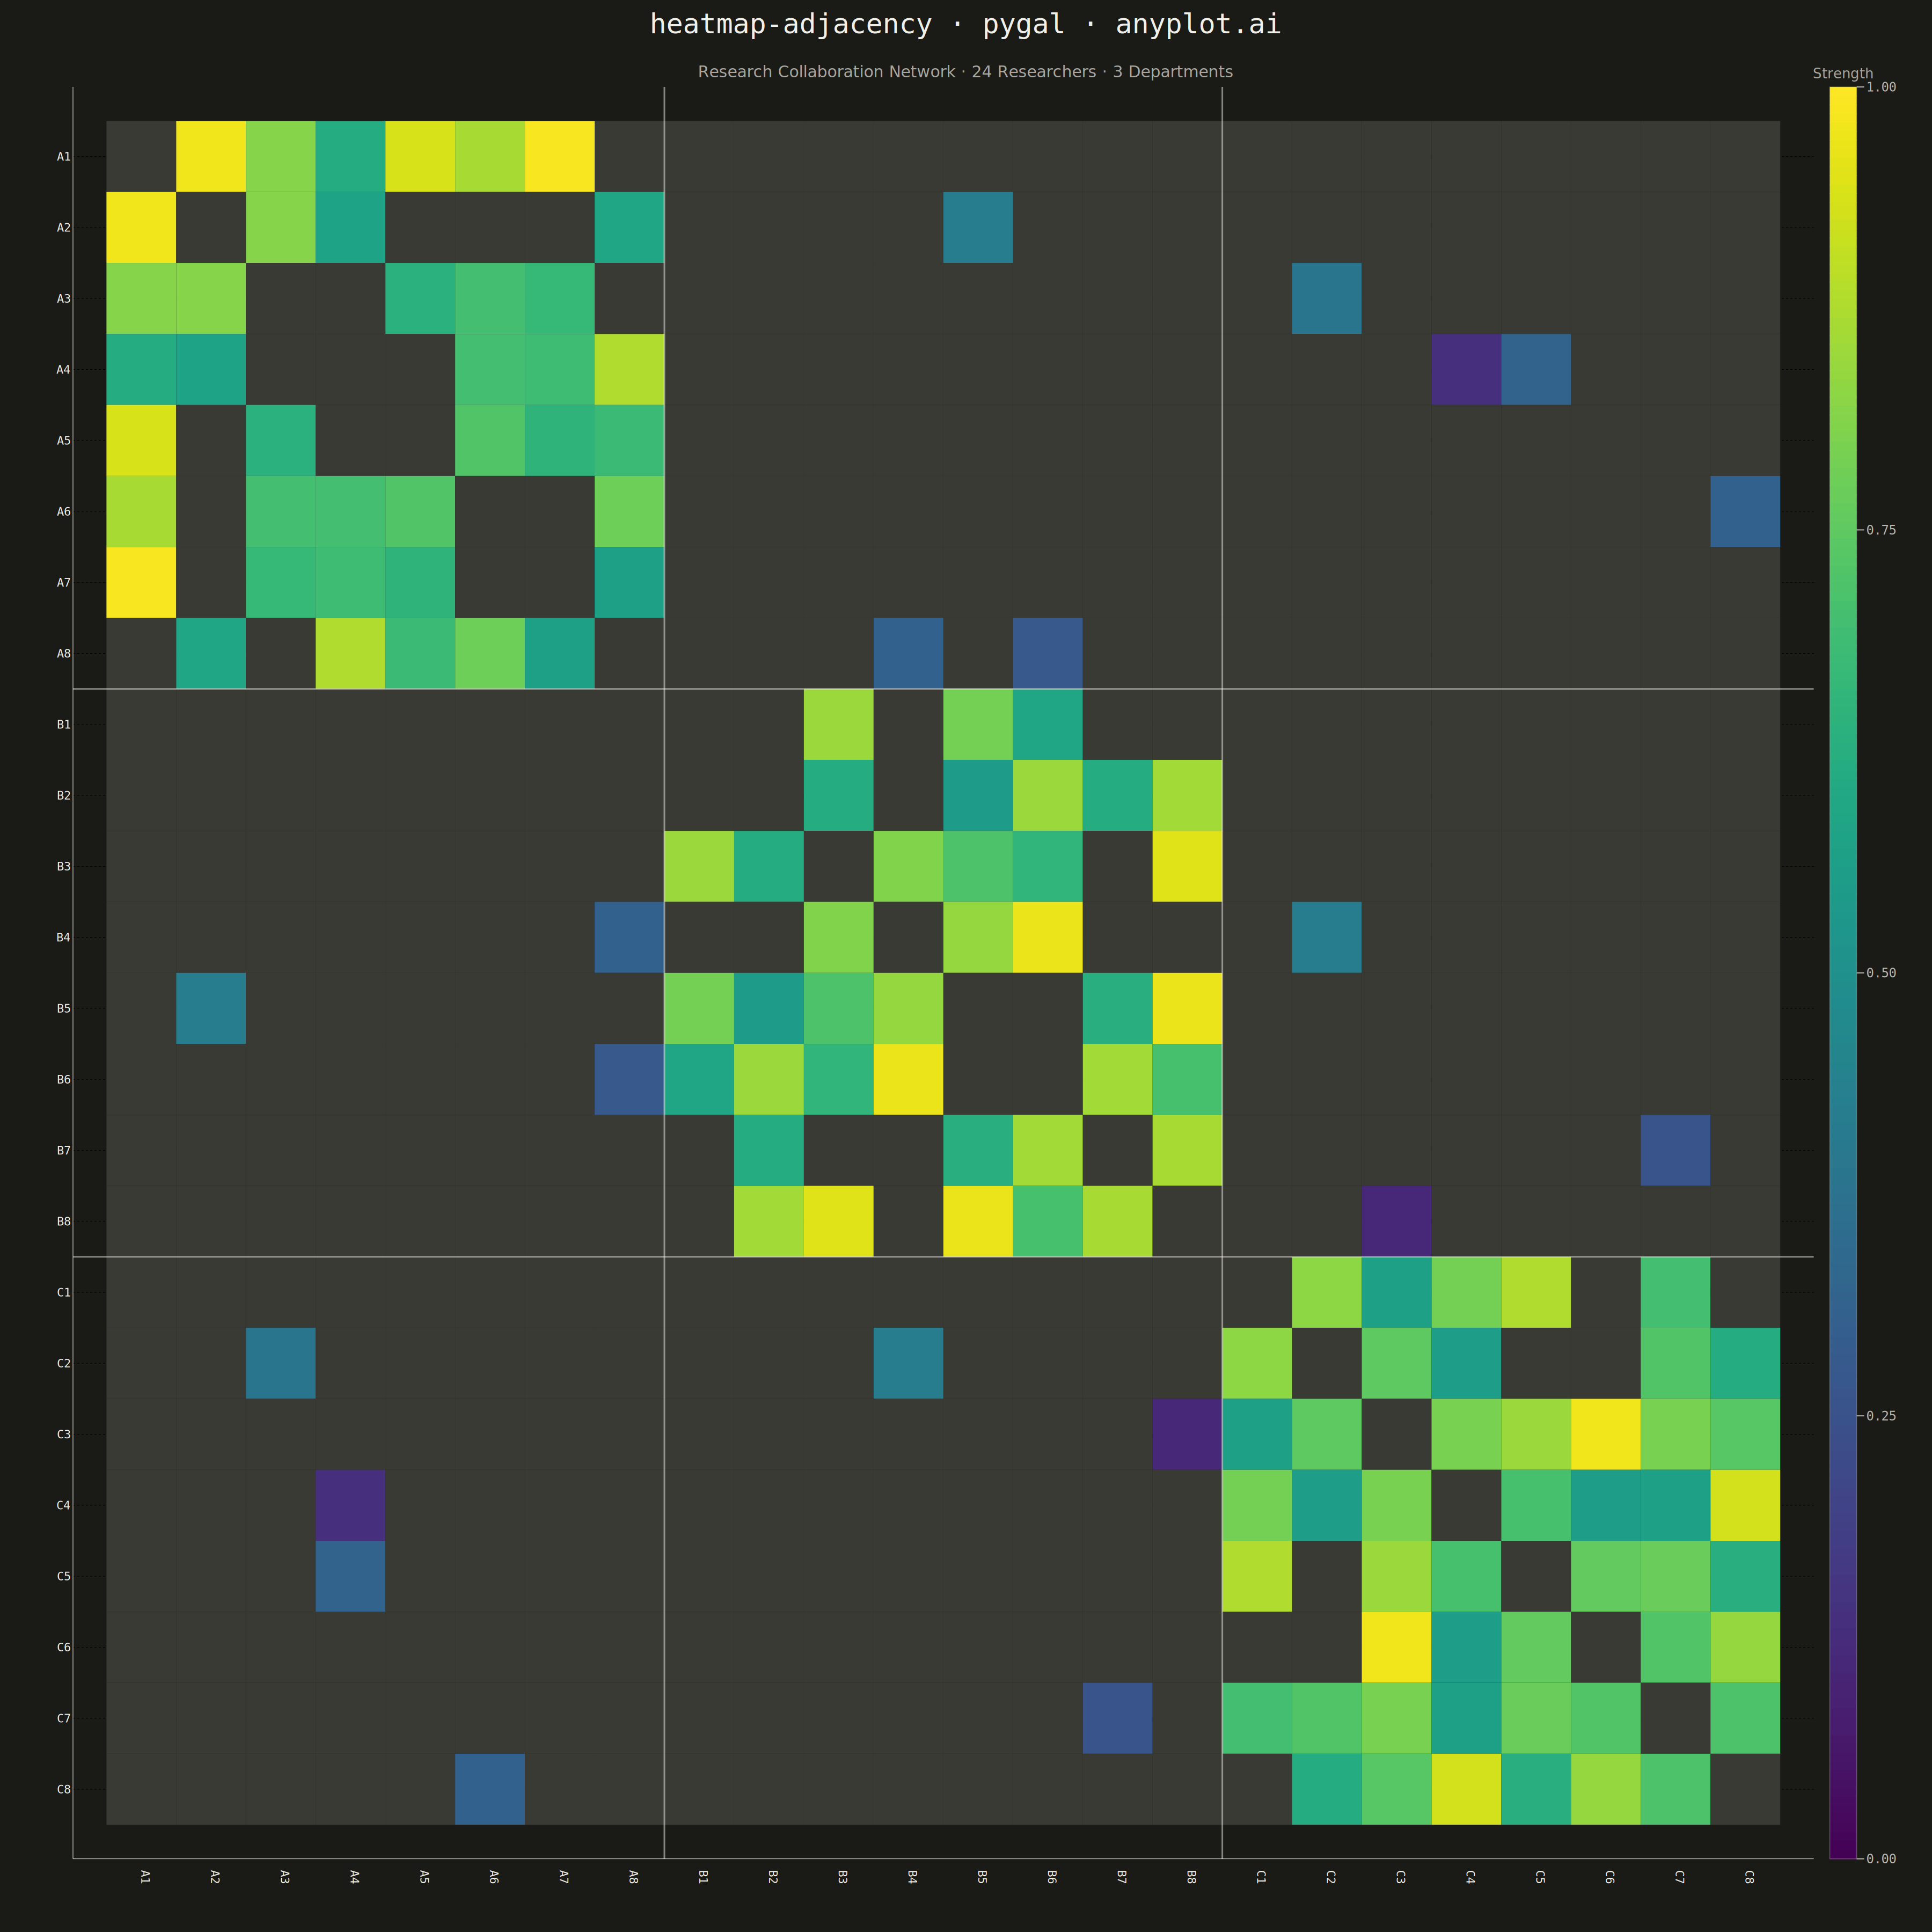
A matrix-based representation of a network or graph where rows and columns represent nodes and cell color indicates the presence or weight of edges between them. This visualization complements node-link diagrams by excelling at revealing clusters, structural patterns, and density in large or dense networks where node-link layouts become cluttered. Reordering nodes by cluster, degree, or community membership exposes block-diagonal structure and makes group boundaries immediately visible.
""" anyplot.ai
heatmap-adjacency: Network Adjacency Matrix Heatmap
Library: pygal 3.1.0 | Python 3.13.13
Quality: 81/100 | Created: 2026-05-08
"""

import importlib
import os
import sys

import cairosvg
import numpy as np


def _get_viridis():
    # The sibling matplotlib.py would shadow the installed package at module
    # import time.  By loading matplotlib inside this function, after removing
    # the current directory from sys.path, we reach the installed package.
    _here = os.path.dirname(os.path.abspath(__file__))
    _saved, sys.path = sys.path, [p for p in sys.path if p and os.path.abspath(p) != _here]
    try:
        mpl = importlib.import_module("matplotlib")
        return mpl.colormaps["viridis"]
    finally:
        sys.path = _saved


viridis = _get_viridis()

THEME = os.getenv("ANYPLOT_THEME", "light")
PAGE_BG = "#FAF8F1" if THEME == "light" else "#1A1A17"
INK = "#1A1A17" if THEME == "light" else "#F0EFE8"
INK_SOFT = "#4A4A44" if THEME == "light" else "#B8B7B0"
INK_MUTED = "#6B6A63" if THEME == "light" else "#A8A79F"
ABSENT_COLOR = "#DEDBD4" if THEME == "light" else "#2E2E2A"

# Data: research collaboration network, 24 researchers in 3 departments
np.random.seed(42)
N = 24
DEPT_SIZE = 8
communities = [i // DEPT_SIZE for i in range(N)]
node_labels = [f"{'ABC'[i // DEPT_SIZE]}{(i % DEPT_SIZE) + 1}" for i in range(N)]

adj = np.zeros((N, N))
for i in range(N):
    for j in range(i + 1, N):
        same_dept = communities[i] == communities[j]
        prob = 0.78 if same_dept else 0.07
        if np.random.random() < prob:
            w = np.random.uniform(0.55, 1.0) if same_dept else np.random.uniform(0.1, 0.45)
            adj[i, j] = round(w, 2)
            adj[j, i] = round(w, 2)

# Canvas (square — best for a symmetric matrix)
W, H = 3600, 3600
MARGIN_TOP = 180
MARGIN_LEFT = 160
MARGIN_RIGHT = 220
MARGIN_BOTTOM = 130

avail_w = W - MARGIN_LEFT - MARGIN_RIGHT
avail_h = H - MARGIN_TOP - MARGIN_BOTTOM
cell = min(avail_w, avail_h) // N
matrix_size = cell * N
mx = MARGIN_LEFT + (avail_w - matrix_size) // 2
my = MARGIN_TOP + (avail_h - matrix_size) // 2

# Colorbar layout
CB_GAP = 35
CB_W = 55
cb_x = W - MARGIN_RIGHT + CB_GAP
cb_y = my
cb_h = matrix_size


def to_hex(rgba):
    r = min(255, int(rgba[0] * 255))
    g = min(255, int(rgba[1] * 255))
    b = min(255, int(rgba[2] * 255))
    return f"#{r:02x}{g:02x}{b:02x}"


# Build SVG
parts = [
    f'<svg xmlns="http://www.w3.org/2000/svg" width="{W}" height="{H}">',
    f'<rect width="{W}" height="{H}" fill="{PAGE_BG}"/>',
    # Title
    f'<text x="{W // 2}" y="108" font-family="Arial,sans-serif" font-size="52"'
    f' font-weight="bold" fill="{INK}" text-anchor="middle">'
    f"heatmap-adjacency · pygal · anyplot.ai</text>",
    # Subtitle
    f'<text x="{W // 2}" y="153" font-family="Arial,sans-serif" font-size="30"'
    f' fill="{INK_MUTED}" text-anchor="middle">'
    f"Research Collaboration Network · 24 Researchers · 3 Departments</text>",
]

# Matrix cells
for i in range(N):
    for j in range(N):
        x = mx + j * cell
        y = my + i * cell
        v = adj[i, j]
        color = ABSENT_COLOR if v == 0 else to_hex(viridis(v))
        parts.append(
            f'<rect x="{x}" y="{y}" width="{cell}" height="{cell}"'
            f' fill="{color}" stroke="{PAGE_BG}" stroke-width="0.8"/>'
        )

# Department boundary lines
for b in [DEPT_SIZE, 2 * DEPT_SIZE]:
    bx = mx + b * cell
    by = my + b * cell
    parts.extend(
        [
            f'<line x1="{bx}" y1="{my}" x2="{bx}" y2="{my + matrix_size}"'
            f' stroke="{INK}" stroke-width="3" opacity="0.5"/>',
            f'<line x1="{mx}" y1="{by}" x2="{mx + matrix_size}" y2="{by}"'
            f' stroke="{INK}" stroke-width="3" opacity="0.5"/>',
        ]
    )

# Row labels (left side, vertically centered per cell)
for i, label in enumerate(node_labels):
    y_center = my + i * cell + cell // 2
    parts.append(
        f'<text x="{mx - 14}" y="{y_center}" dominant-baseline="middle"'
        f' font-family="monospace" font-size="24"'
        f' fill="{INK_SOFT}" text-anchor="end">{label}</text>'
    )

# Column labels (bottom, rotated 90° clockwise — reads top-to-bottom when tilted right)
for j, label in enumerate(node_labels):
    x_center = mx + j * cell + cell // 2
    y_top = my + matrix_size + 18
    parts.append(
        f'<text transform="translate({x_center},{y_top}) rotate(90)"'
        f' text-anchor="start" font-family="monospace" font-size="24"'
        f' fill="{INK_SOFT}">{label}</text>'
    )

# Colorbar gradient (200 steps)
N_STEPS = 200
for k in range(N_STEPS):
    v = 1.0 - k / N_STEPS
    color = to_hex(viridis(v))
    y_k = cb_y + k * cb_h / N_STEPS
    h_k = cb_h / N_STEPS + 1
    parts.append(f'<rect x="{cb_x}" y="{y_k:.1f}" width="{CB_W}" height="{h_k:.1f}" fill="{color}"/>')

# Colorbar border
parts.append(
    f'<rect x="{cb_x}" y="{cb_y}" width="{CB_W}" height="{cb_h}"'
    f' fill="none" stroke="{INK_SOFT}" stroke-width="1.5" opacity="0.4"/>'
)

# Colorbar tick marks and labels
for v_tick in [1.0, 0.75, 0.5, 0.25, 0.0]:
    y_t = cb_y + (1.0 - v_tick) * cb_h
    parts.extend(
        [
            f'<line x1="{cb_x + CB_W}" y1="{y_t:.1f}"'
            f' x2="{cb_x + CB_W + 12}" y2="{y_t:.1f}"'
            f' stroke="{INK_SOFT}" stroke-width="2"/>',
            f'<text x="{cb_x + CB_W + 18}" y="{y_t:.1f}" dominant-baseline="middle"'
            f' font-family="Arial,sans-serif" font-size="24"'
            f' fill="{INK_SOFT}">{v_tick:.2f}</text>',
        ]
    )

# Colorbar title
parts.append(
    f'<text x="{cb_x + CB_W // 2}" y="{cb_y - 18}"'
    f' font-family="Arial,sans-serif" font-size="26"'
    f' fill="{INK_MUTED}" text-anchor="middle">Strength</text>'
)

parts.append("</svg>")

svg_content = "\n".join(parts)

# Save PNG via cairosvg (same backend pygal uses for render_to_png)
cairosvg.svg2png(bytestring=svg_content.encode(), write_to=f"plot-{THEME}.png")

# Save HTML (pygal is an interactive/web library)
html = f"""<!DOCTYPE html>
<html>
<head><style>body{{margin:0;background:{PAGE_BG};}}</style></head>
<body>{svg_content}</body>
</html>"""
with open(f"plot-{THEME}.html", "w") as f:
    f.write(html)
Runnable source as JSON, for any HTTP client: https://api.anyplot.ai/specs/heatmap-adjacency/pygal/code. Any spec id and library id listed in llms-full.txt fit the same URL shape; every URL below is complete and callable.
{
  "spec_id": "heatmap-adjacency",
  "language": "python",
  "library": "pygal",
  "page": "https://anyplot.ai/heatmap-adjacency/python/pygal",
  "hub": "https://anyplot.ai/heatmap-adjacency",
  "code_json": "https://api.anyplot.ai/specs/heatmap-adjacency/pygal/code",
  "spec_json": "https://api.anyplot.ai/specs/heatmap-adjacency",
  "render_light_png": "https://storage.googleapis.com/anyplot-images/plots/heatmap-adjacency/python/pygal/plot-light.png",
  "render_dark_png": "https://storage.googleapis.com/anyplot-images/plots/heatmap-adjacency/python/pygal/plot-dark.png",
  "interactive_light_html": "https://storage.googleapis.com/anyplot-images/plots/heatmap-adjacency/python/pygal/plot-light.html",
  "interactive_dark_html": "https://storage.googleapis.com/anyplot-images/plots/heatmap-adjacency/python/pygal/plot-dark.html",
  "quality_score": 81.0,
  "license": "MIT",
  "guide": "https://anyplot.ai/llms.txt"
}
Part of Network Adjacency Matrix Heatmap on anyplot.ai.