The same plot in 14 other libraries — JavaScript: D3.js, Apache ECharts, Highcharts, MUI X Charts; Python: Altair, Bokeh, lets-plot, Matplotlib, Plotly, plotnine, Pygal, Seaborn; R: ggplot2; Julia: Makie.jl. Compare all 15 side by side: Network Adjacency Matrix Heatmap in Python, R, Julia and JavaScript.
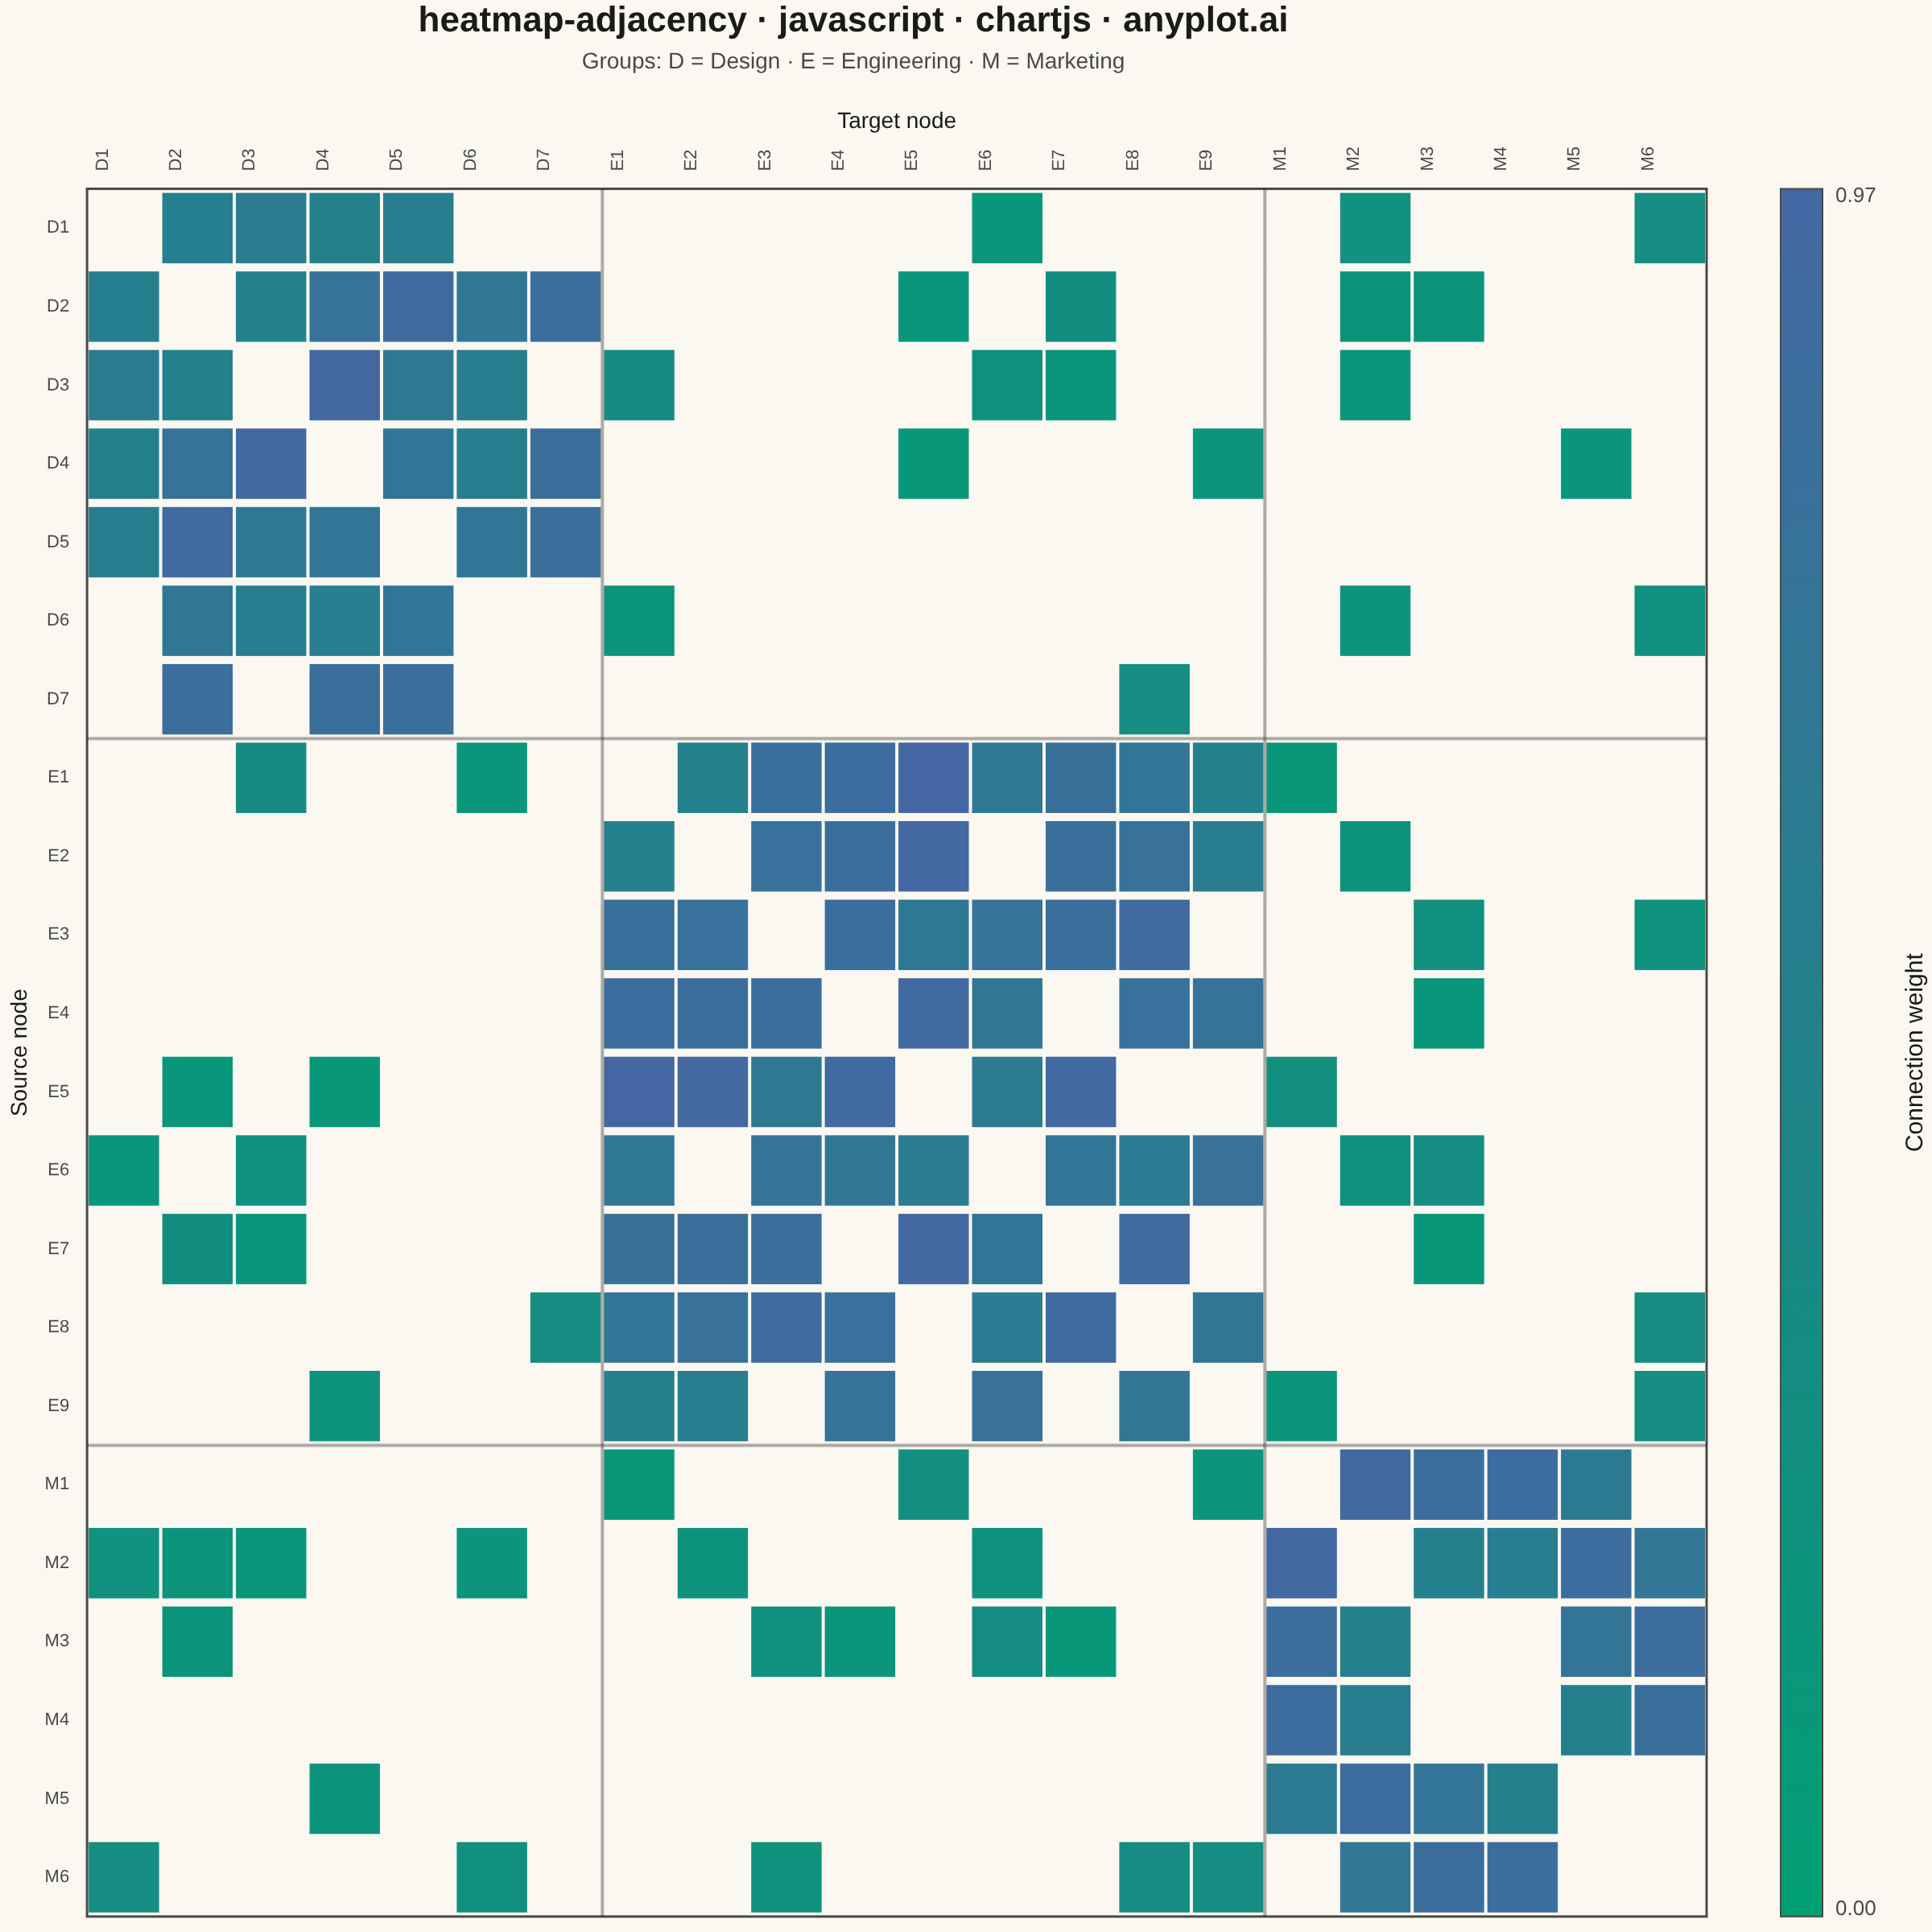
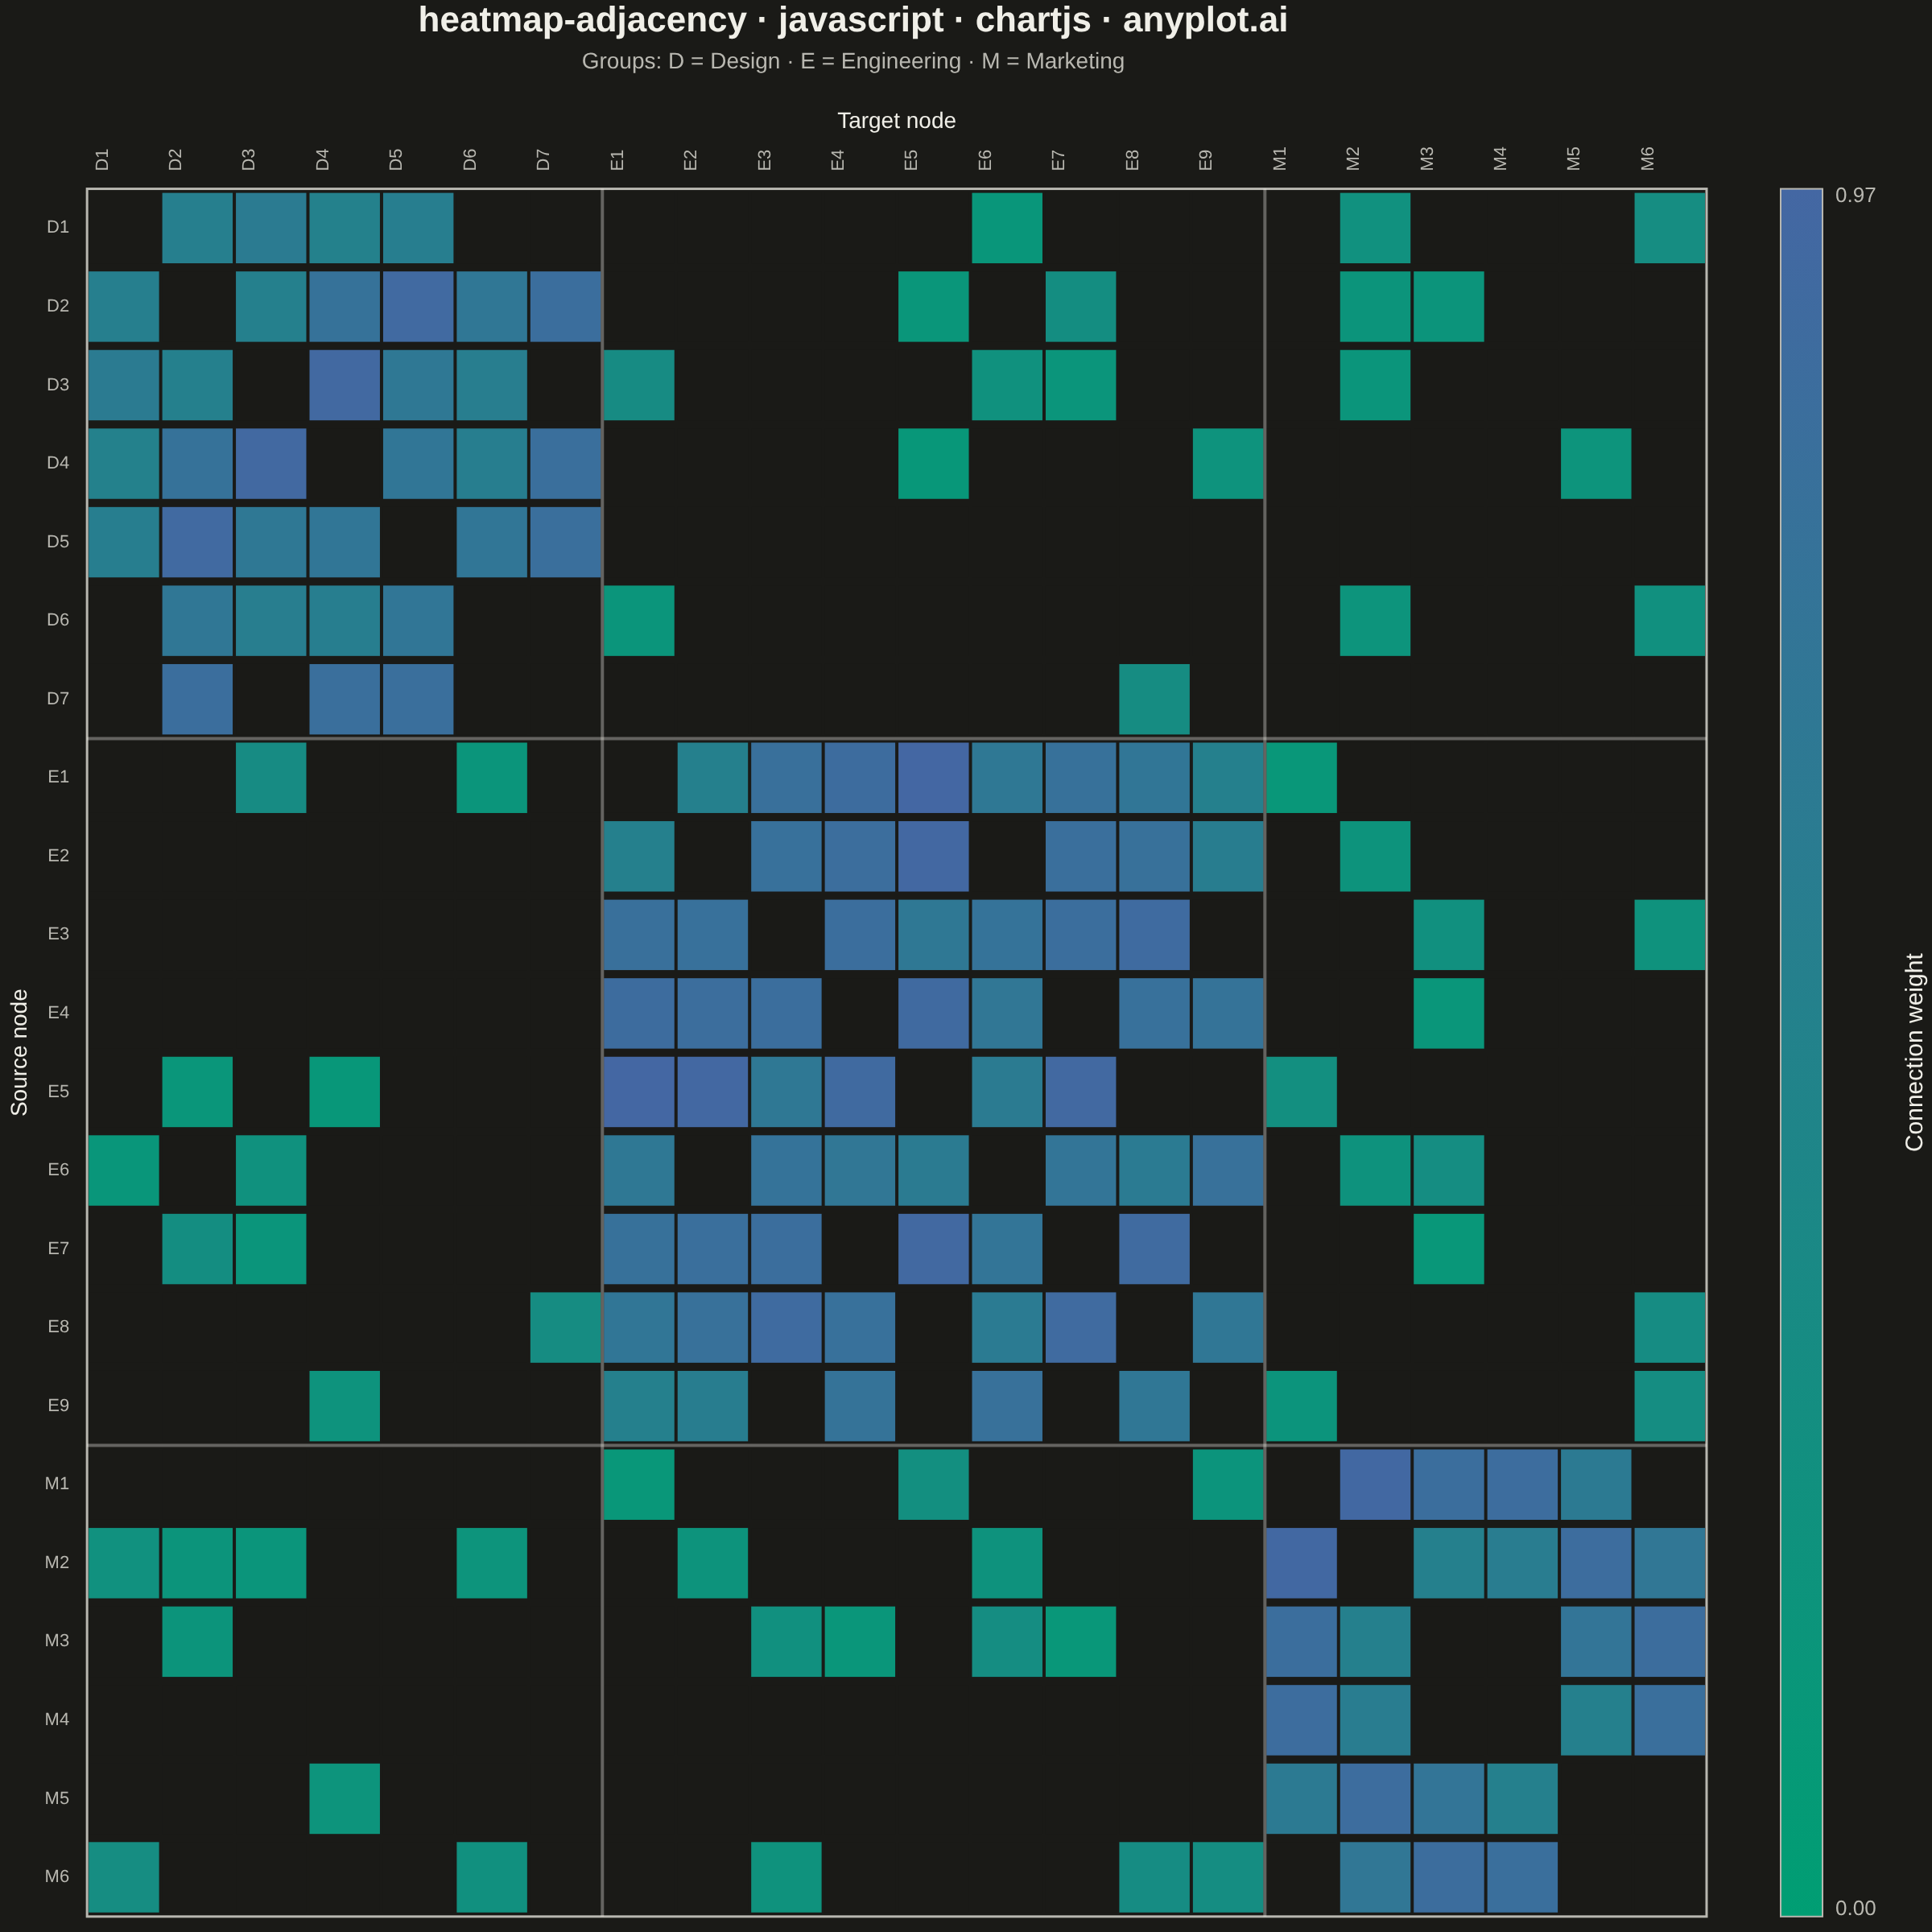
A matrix-based representation of a network or graph where rows and columns represent nodes and cell color indicates the presence or weight of edges between them. This visualization complements node-link diagrams by excelling at revealing clusters, structural patterns, and density in large or dense networks where node-link layouts become cluttered. Reordering nodes by cluster, degree, or community membership exposes block-diagonal structure and makes group boundaries immediately visible.
// anyplot.ai
// heatmap-adjacency: Network Adjacency Matrix Heatmap
// Library: chartjs 4.4.7 | JavaScript 22.23.2
// Quality: 87/100 | Created: 2026-09-05
//# anyplot-orientation: square

const t = window.ANYPLOT_TOKENS;

// --- Data (in-memory, deterministic LCG) ------------------------------------
function lcg(seed) {
  let state = seed;
  return () => {
    state = (state * 1664525 + 1013904223) % 4294967296;
    return state / 4294967296;
  };
}
const rand = lcg(42);

const groups = [
  { name: "Design", size: 7 },
  { name: "Engineering", size: 9 },
  { name: "Marketing", size: 6 },
];
const nodes = [];
groups.forEach((group, groupIndex) => {
  for (let i = 0; i < group.size; i++) {
    nodes.push({ label: `${group.name[0]}${i + 1}`, group: groupIndex });
  }
});
const nodeCount = nodes.length;
const labels = nodes.map((node) => node.label);
const groupBoundaries = groups.reduce((acc, group) => {
  acc.push((acc.length ? acc[acc.length - 1] : 0) + group.size);
  return acc;
}, []);
groupBoundaries.pop(); // drop trailing boundary at the matrix edge

// Symmetric weighted adjacency — collaboration strength between coworkers.
// Same-group pairs connect more often and more strongly than cross-group pairs.
const adjacency = Array.from({ length: nodeCount }, () => new Array(nodeCount).fill(0));
for (let i = 0; i < nodeCount; i++) {
  for (let j = i + 1; j < nodeCount; j++) {
    const sameGroup = nodes[i].group === nodes[j].group;
    const connectChance = sameGroup ? 0.85 : 0.22;
    const weight = rand() < connectChance ? (sameGroup ? 0.5 : 0.1) + rand() * (sameGroup ? 0.5 : 0.25) : 0;
    adjacency[i][j] = weight;
    adjacency[j][i] = weight;
  }
}
const maxWeight = Math.max(...adjacency.flat());

const cells = [];
for (let row = 0; row < nodeCount; row++) {
  for (let col = 0; col < nodeCount; col++) {
    cells.push({ x: labels[col], y: labels[row], v: row === col ? 0 : adjacency[row][col] });
  }
}

// --- Color mapping (Imprint imprint_seq — single-polarity weight) ----------
function hexToRgb(hex) {
  const clean = hex.replace("#", "");
  return [0, 2, 4].map((offset) => parseInt(clean.slice(offset, offset + 2), 16));
}
const seqStart = hexToRgb(t.seq[0]);
const seqEnd = hexToRgb(t.seq[1]);
function weightColor(value) {
  if (value <= 0) return t.pageBg; // absent edge — distinct background, per spec
  const ratio = value / maxWeight;
  const [r, g, b] = seqStart.map((start, i) => Math.round(start + (seqEnd[i] - start) * ratio));
  return `rgb(${r}, ${g}, ${b})`;
}

// --- Mount -------------------------------------------------------------------
const canvas = document.createElement("canvas");
document.getElementById("container").appendChild(canvas);

// --- Plugin: draw matrix cells as square fills (Chart.js core has no matrix
// chart type; this draws directly on the canvas via a plugin, not a plugin
// package) plus community-boundary dividers exposing block-diagonal structure.
const heatmapCells = {
  id: "heatmapCells",
  afterDatasetsDraw(chart) {
    const { ctx, scales } = chart;
    const cellW = scales.x.width / nodeCount;
    const cellH = scales.y.height / nodeCount;
    const side = Math.min(cellW, cellH) - 2;

    ctx.save();
    cells.forEach((cell) => {
      const cx = scales.x.getPixelForValue(cell.x);
      const cy = scales.y.getPixelForValue(cell.y);
      ctx.fillStyle = weightColor(cell.v);
      ctx.fillRect(cx - side / 2, cy - side / 2, side, side);
    });

    const left = scales.x.getPixelForValue(labels[0]) - cellW / 2;
    const right = scales.x.getPixelForValue(labels[nodeCount - 1]) + cellW / 2;
    const top = scales.y.getPixelForValue(labels[0]) - cellH / 2;
    const bottom = scales.y.getPixelForValue(labels[nodeCount - 1]) + cellH / 2;

    ctx.strokeStyle = t.inkSoft;
    ctx.lineWidth = 1.5;
    ctx.strokeRect(left, top, right - left, bottom - top);

    ctx.strokeStyle = t.ink;
    ctx.globalAlpha = 0.35;
    ctx.lineWidth = 2;
    groupBoundaries.forEach((boundaryIndex) => {
      const frac = boundaryIndex / nodeCount;
      const bx = left + frac * (right - left);
      const by = top + frac * (bottom - top);
      ctx.beginPath();
      ctx.moveTo(bx, top);
      ctx.lineTo(bx, bottom);
      ctx.stroke();
      ctx.beginPath();
      ctx.moveTo(left, by);
      ctx.lineTo(right, by);
      ctx.stroke();
    });
    ctx.restore();
  },
};

// --- Plugin: colorbar legend for the weight scale ---------------------------
const colorbarPlugin = {
  id: "colorbarPlugin",
  afterDraw(chart) {
    const { ctx, chartArea } = chart;
    const barWidth = 26;
    const barX = chartArea.right + 46;
    const barTop = chartArea.top;
    const barHeight = chartArea.height;

    const gradient = ctx.createLinearGradient(0, barTop + barHeight, 0, barTop);
    gradient.addColorStop(0, t.seq[0]);
    gradient.addColorStop(1, t.seq[1]);

    ctx.save();
    ctx.fillStyle = gradient;
    ctx.fillRect(barX, barTop, barWidth, barHeight);
    ctx.strokeStyle = t.inkSoft;
    ctx.lineWidth = 1;
    ctx.strokeRect(barX, barTop, barWidth, barHeight);

    ctx.fillStyle = t.inkSoft;
    ctx.font = "13px sans-serif";
    ctx.textAlign = "left";
    ctx.textBaseline = "top";
    ctx.fillText(maxWeight.toFixed(2), barX + barWidth + 8, barTop - 2);
    ctx.textBaseline = "bottom";
    ctx.fillText("0.00", barX + barWidth + 8, barTop + barHeight + 2);

    ctx.save();
    ctx.translate(barX + barWidth + 58, barTop + barHeight / 2);
    ctx.rotate(-Math.PI / 2);
    ctx.textAlign = "center";
    ctx.textBaseline = "middle";
    ctx.fillStyle = t.ink;
    ctx.font = "15px sans-serif";
    ctx.fillText("Connection weight", 0, 0);
    ctx.restore();
    ctx.restore();
  },
};

// --- Chart -------------------------------------------------------------------
new Chart(canvas, {
  type: "scatter",
  data: {
    datasets: [
      {
        data: cells.map((cell) => ({ x: cell.x, y: cell.y })),
        pointRadius: 0,
        showLine: false,
      },
    ],
  },
  plugins: [heatmapCells, colorbarPlugin],
  options: {
    responsive: true,
    maintainAspectRatio: false,
    animation: false,
    layout: {
      padding: { right: 140, bottom: 6 },
    },
    plugins: {
      title: {
        display: true,
        text: "heatmap-adjacency · javascript · chartjs · anyplot.ai",
        color: t.ink,
        font: { size: 22 },
        padding: { bottom: 4 },
      },
      subtitle: {
        display: true,
        text: "Groups: D = Design · E = Engineering · M = Marketing",
        color: t.inkSoft,
        font: { size: 14 },
        padding: { bottom: 16 },
      },
      legend: { display: false },
      tooltip: { enabled: false },
    },
    scales: {
      x: {
        type: "category",
        labels,
        position: "top",
        offset: true,
        grid: { display: false },
        border: { display: false },
        ticks: { color: t.inkSoft, font: { size: 11 }, autoSkip: false, maxRotation: 90, minRotation: 90 },
        title: { display: true, text: "Target node", color: t.ink, font: { size: 14 } },
      },
      y: {
        type: "category",
        labels,
        offset: true,
        grid: { display: false },
        border: { display: false },
        ticks: { color: t.inkSoft, font: { size: 11 }, autoSkip: false },
        title: { display: true, text: "Source node", color: t.ink, font: { size: 14 } },
      },
    },
  },
});
Runnable source as JSON, for any HTTP client: https://api.anyplot.ai/specs/heatmap-adjacency/chartjs/code. Any spec id and library id listed in llms-full.txt fit the same URL shape; every URL below is complete and callable.
{
  "spec_id": "heatmap-adjacency",
  "language": "javascript",
  "library": "chartjs",
  "page": "https://anyplot.ai/heatmap-adjacency/javascript/chartjs",
  "hub": "https://anyplot.ai/heatmap-adjacency",
  "code_json": "https://api.anyplot.ai/specs/heatmap-adjacency/chartjs/code",
  "spec_json": "https://api.anyplot.ai/specs/heatmap-adjacency",
  "render_light_png": "https://storage.googleapis.com/anyplot-images/plots/heatmap-adjacency/javascript/chartjs/plot-light.png",
  "render_dark_png": "https://storage.googleapis.com/anyplot-images/plots/heatmap-adjacency/javascript/chartjs/plot-dark.png",
  "interactive_light_html": "https://storage.googleapis.com/anyplot-images/plots/heatmap-adjacency/javascript/chartjs/plot-light.html",
  "interactive_dark_html": "https://storage.googleapis.com/anyplot-images/plots/heatmap-adjacency/javascript/chartjs/plot-dark.html",
  "quality_score": 87.0,
  "license": "MIT",
  "guide": "https://anyplot.ai/llms.txt"
}
Part of Network Adjacency Matrix Heatmap on anyplot.ai.