The same plot in 14 other libraries — Python: Altair, Bokeh, Matplotlib, Plotly, plotnine, Pygal, Seaborn; R: ggplot2; Julia: Makie.jl; JavaScript: Chart.js, D3.js, Apache ECharts, Highcharts, MUI X Charts. Compare all 15 side by side: Network Adjacency Matrix Heatmap in Python, R, Julia and JavaScript.
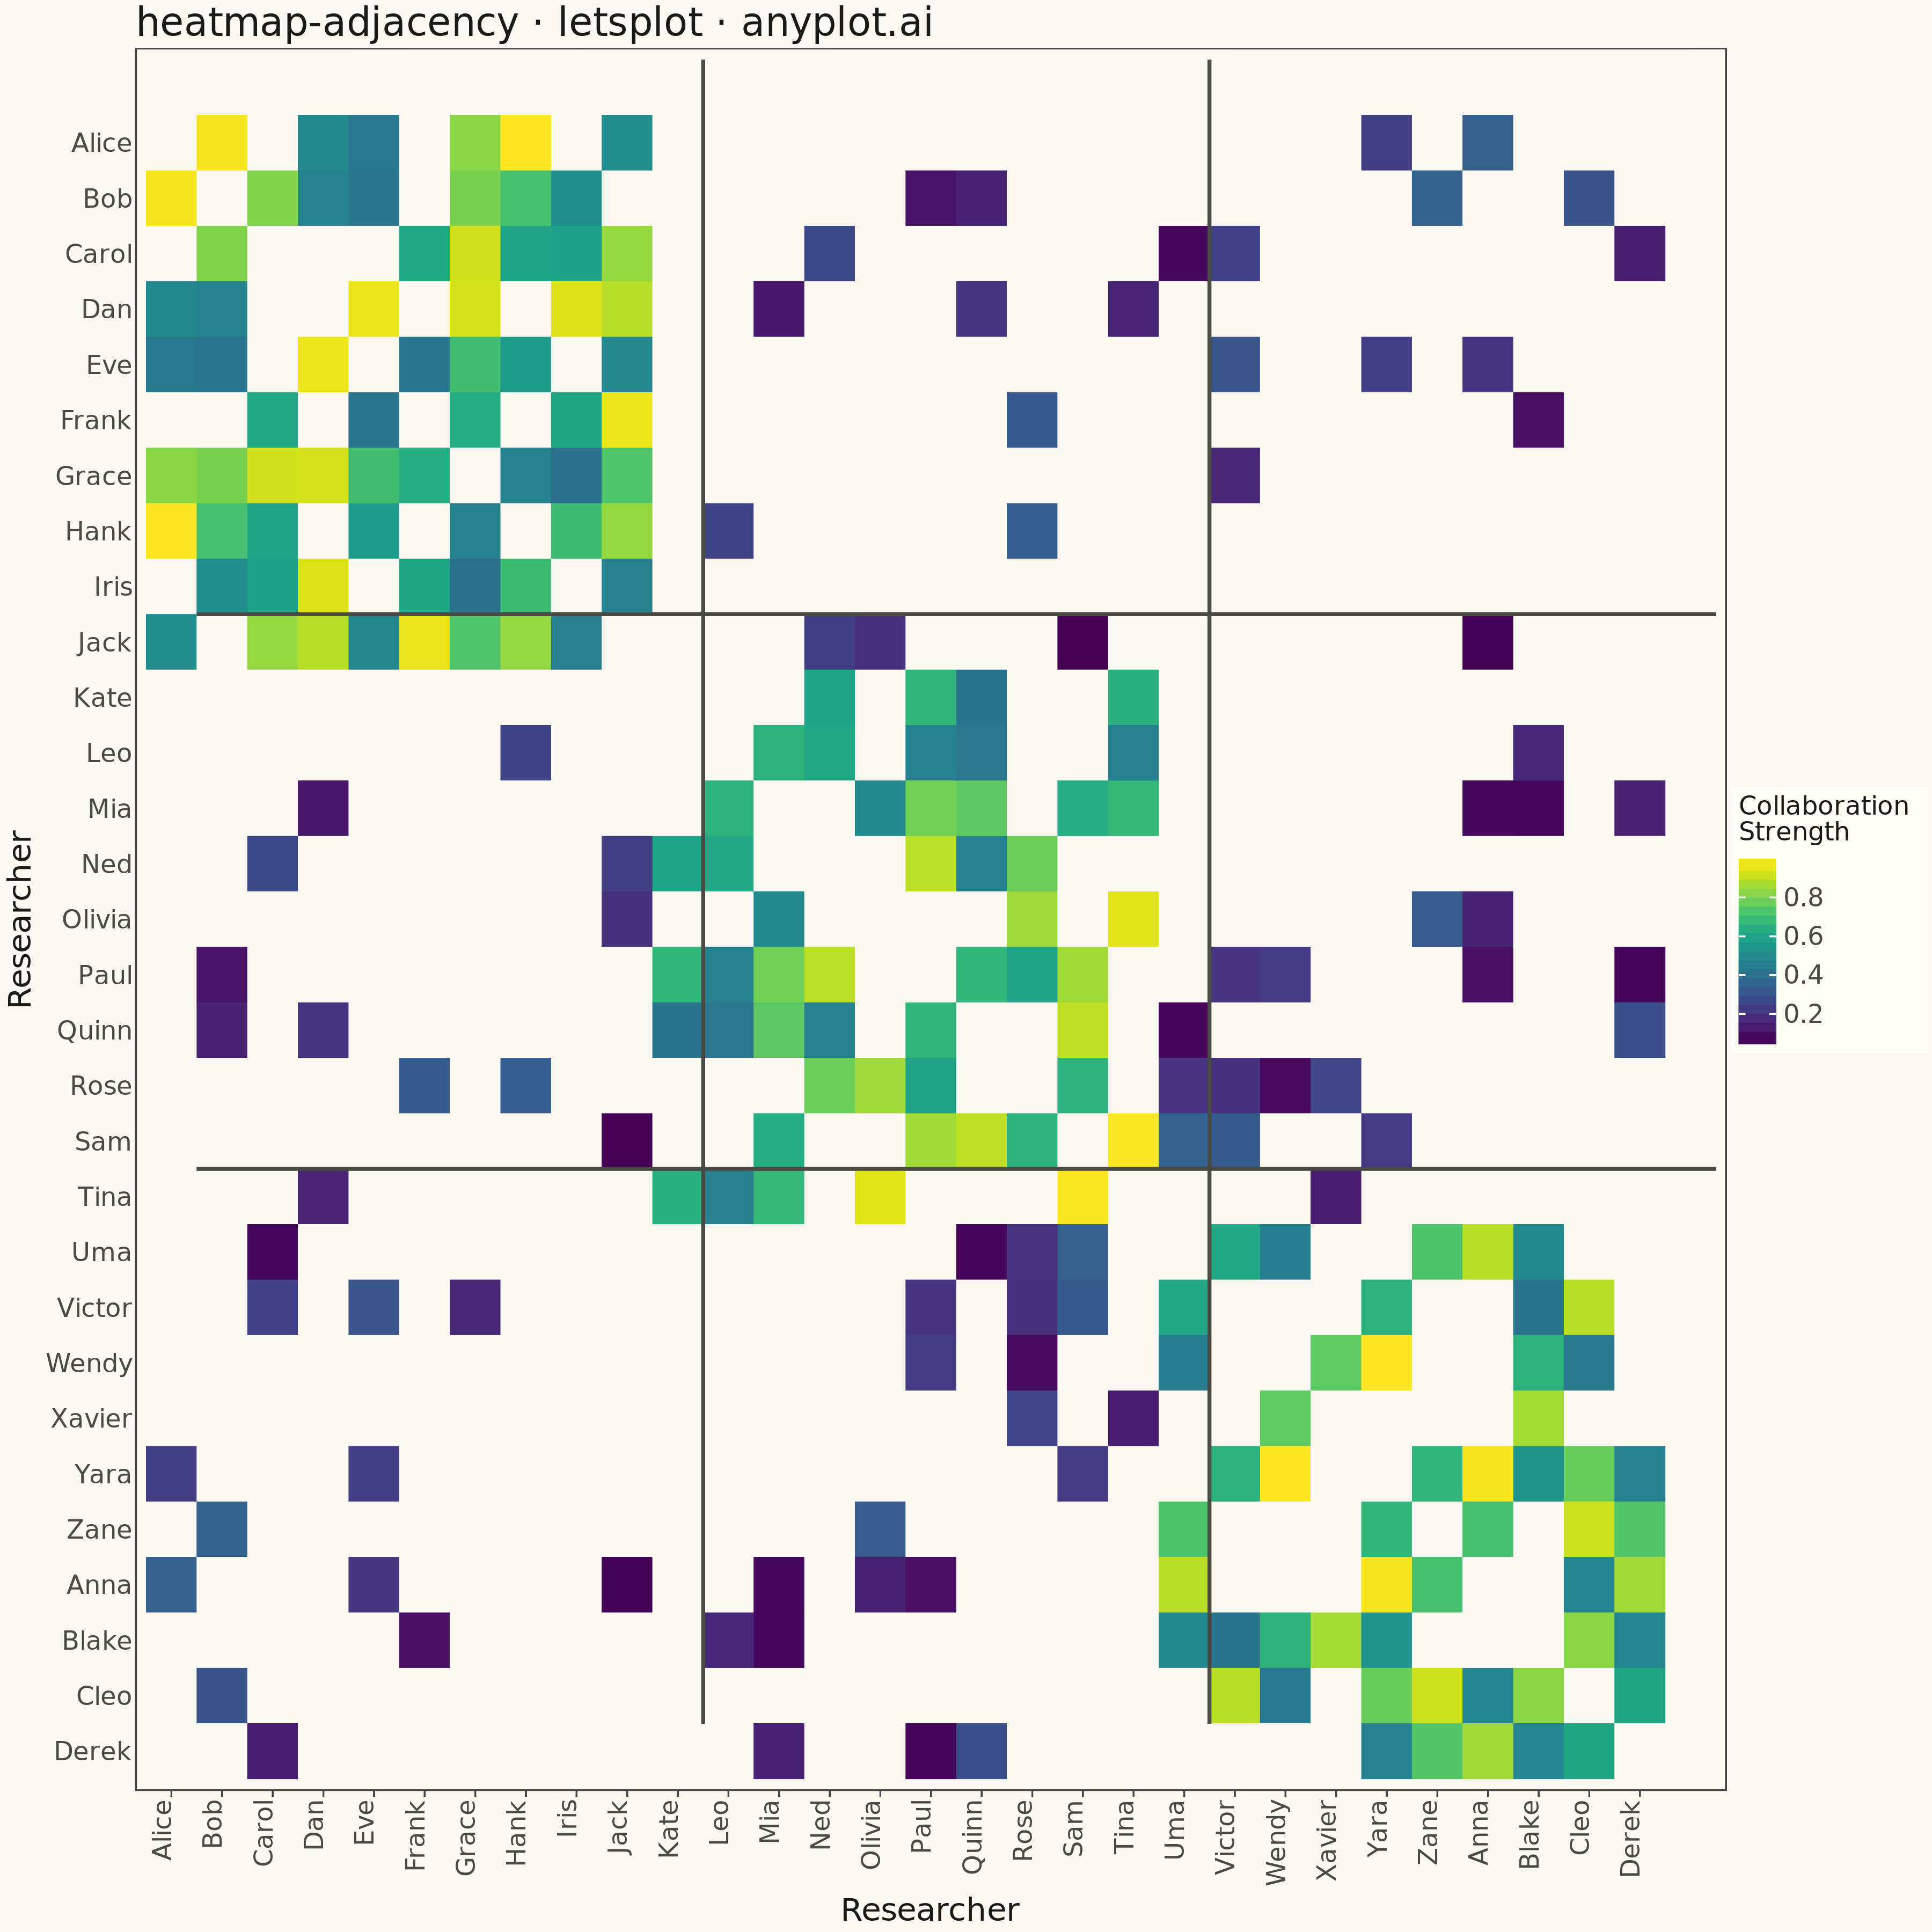
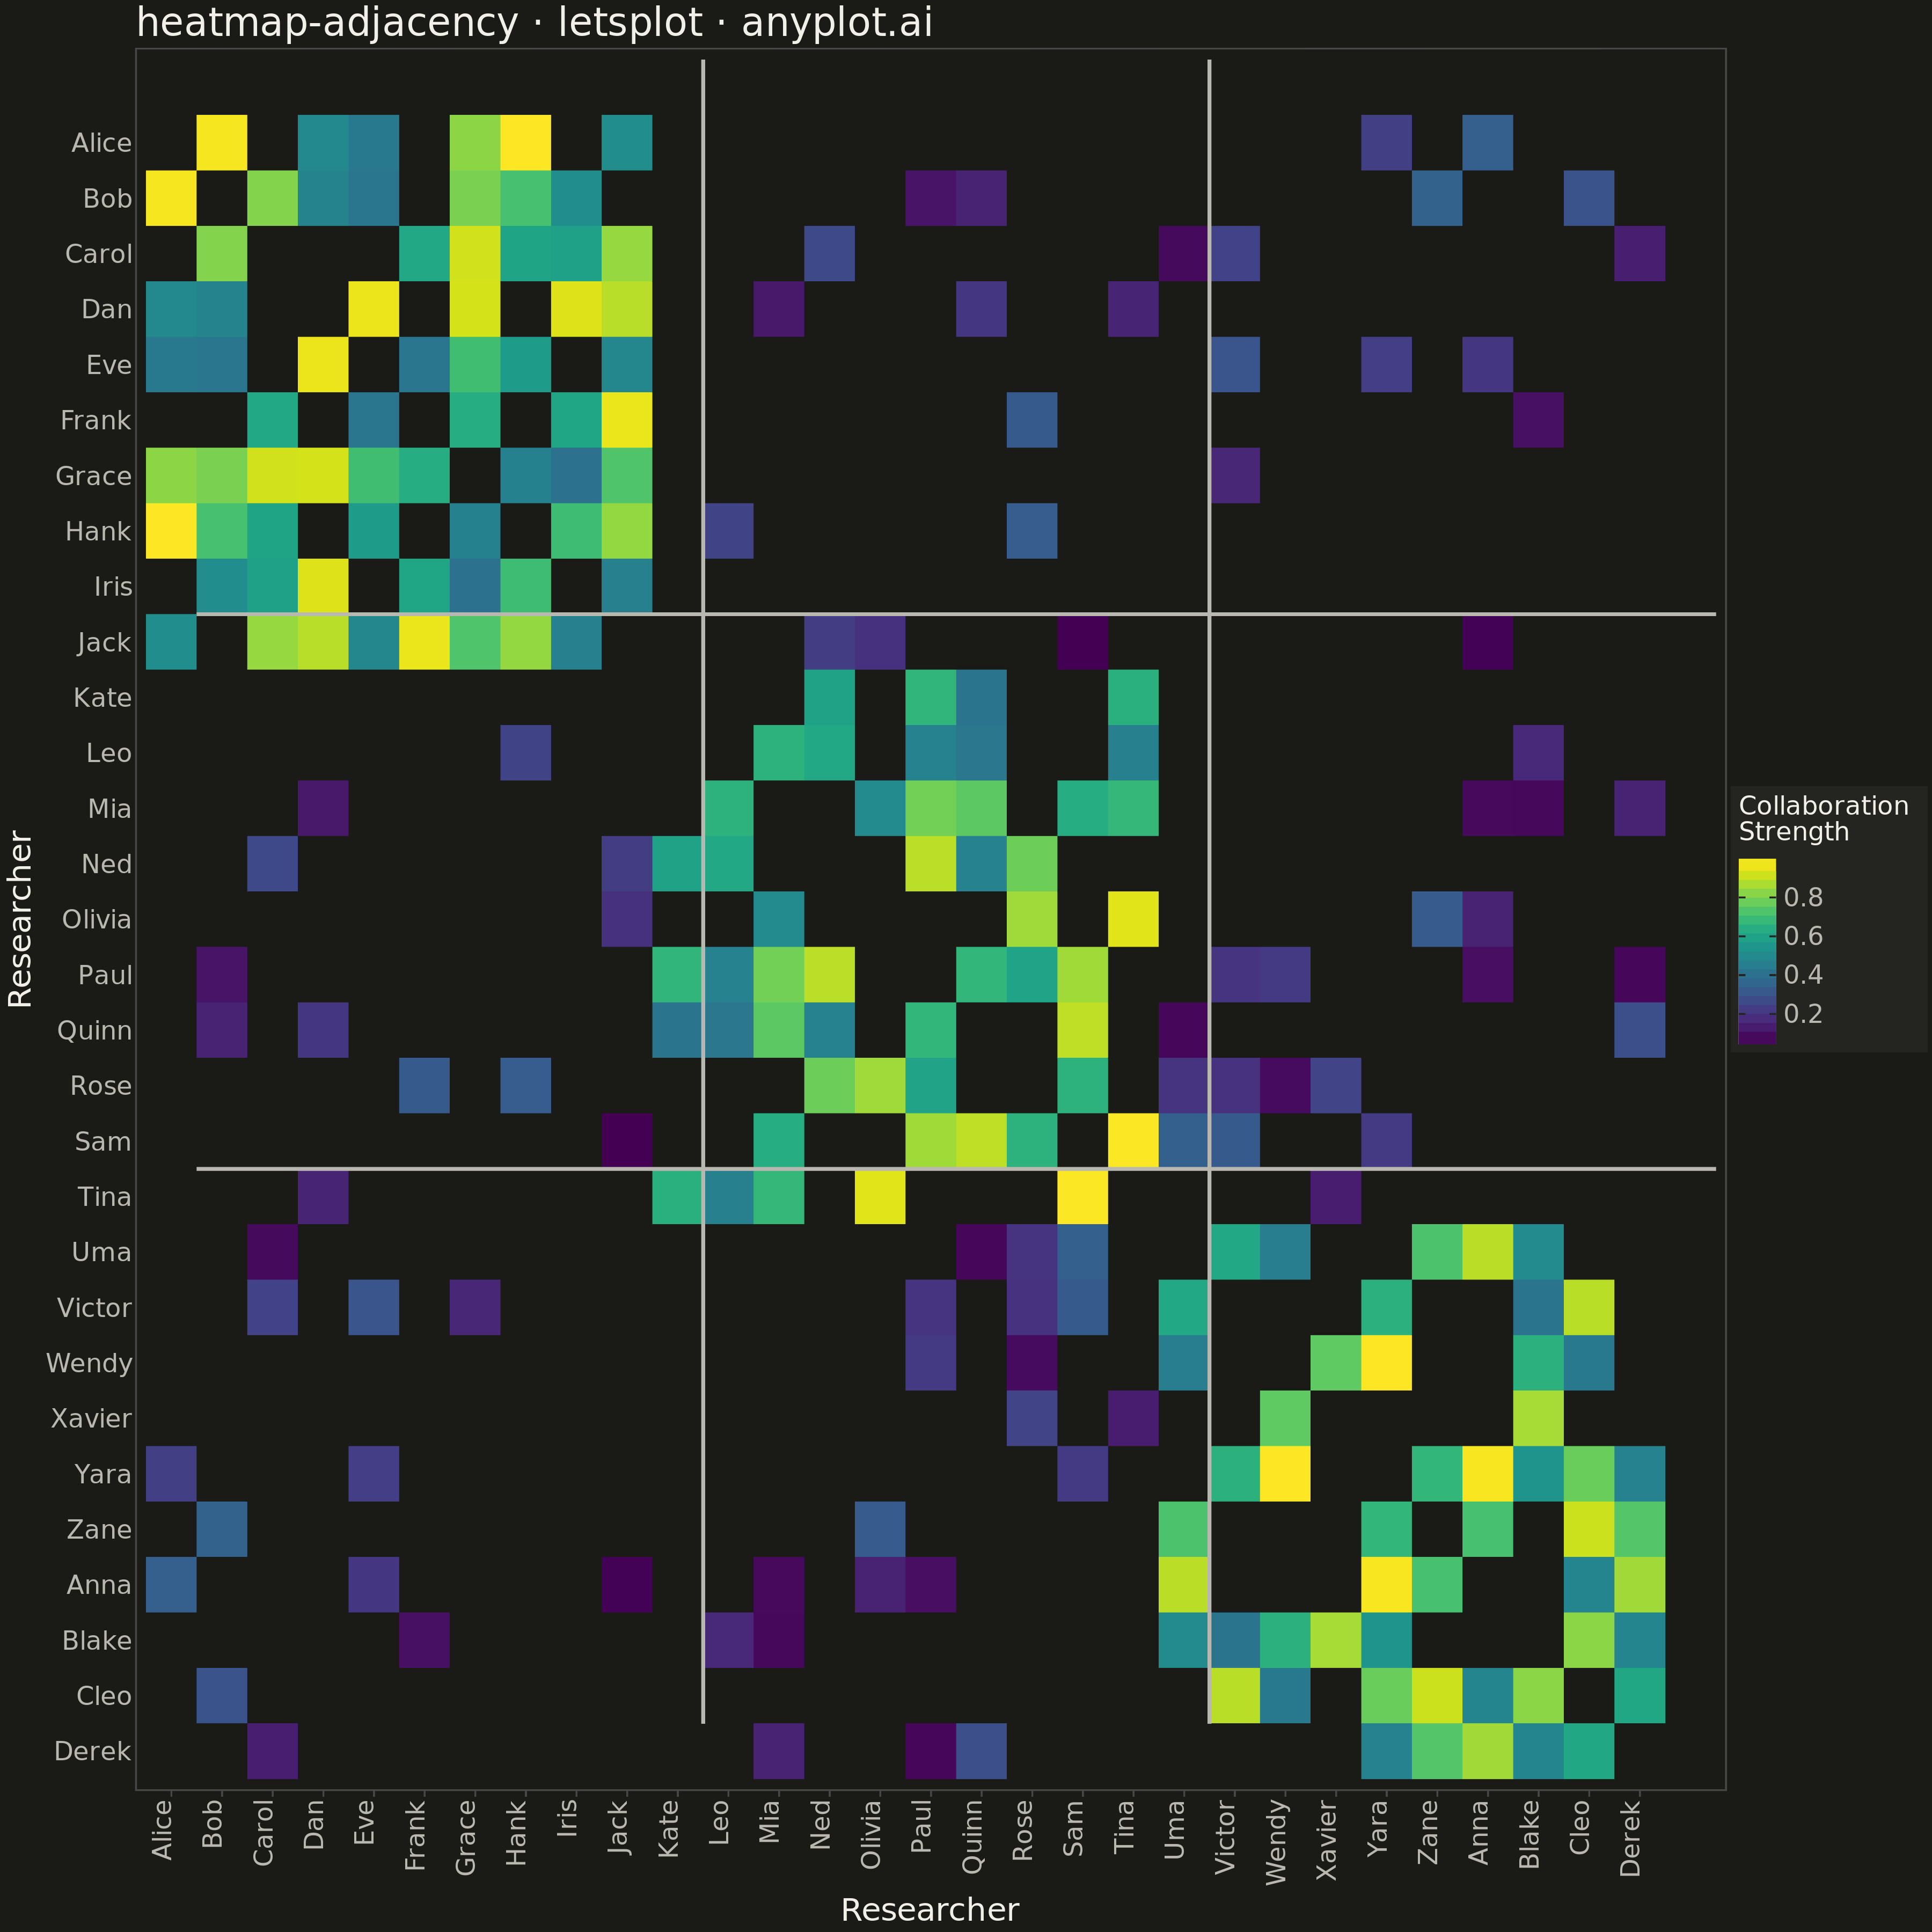
A matrix-based representation of a network or graph where rows and columns represent nodes and cell color indicates the presence or weight of edges between them. This visualization complements node-link diagrams by excelling at revealing clusters, structural patterns, and density in large or dense networks where node-link layouts become cluttered. Reordering nodes by cluster, degree, or community membership exposes block-diagonal structure and makes group boundaries immediately visible.
""" anyplot.ai
heatmap-adjacency: Network Adjacency Matrix Heatmap
Library: letsplot 4.9.0 | Python 3.13.13
Quality: 85/100 | Created: 2026-05-08
"""

import os

import numpy as np
import pandas as pd
from lets_plot import (
    LetsPlot,
    aes,
    element_blank,
    element_rect,
    element_text,
    geom_tile,
    ggplot,
    ggsave,
    ggsize,
    labs,
    scale_fill_viridis,
    theme,
)


LetsPlot.setup_html()

# Theme tokens
THEME = os.getenv("ANYPLOT_THEME", "light")
PAGE_BG = "#FAF8F1" if THEME == "light" else "#1A1A17"
ELEVATED_BG = "#FFFDF6" if THEME == "light" else "#242420"
INK = "#1A1A17" if THEME == "light" else "#F0EFE8"
INK_SOFT = "#4A4A44" if THEME == "light" else "#B8B7B0"

# Data: Research collaboration network — 30 scientists across 3 departments
np.random.seed(42)

names = [
    "Alice",
    "Bob",
    "Carol",
    "Dan",
    "Eve",
    "Frank",
    "Grace",
    "Hank",
    "Iris",
    "Jack",  # Dept A
    "Kate",
    "Leo",
    "Mia",
    "Ned",
    "Olivia",
    "Paul",
    "Quinn",
    "Rose",
    "Sam",
    "Tina",  # Dept B
    "Uma",
    "Victor",
    "Wendy",
    "Xavier",
    "Yara",
    "Zane",
    "Anna",
    "Blake",
    "Cleo",
    "Derek",  # Dept C
]
n = len(names)  # 30

# Build symmetric adjacency matrix with block-diagonal community structure
weights = np.zeros((n, n))
for i in range(n):
    for j in range(i + 1, n):
        same_dept = (i // 10) == (j // 10)
        prob = 0.70 if same_dept else 0.12
        if np.random.rand() < prob:
            lo, hi = (0.4, 1.0) if same_dept else (0.05, 0.35)
            w = np.random.uniform(lo, hi)
            weights[i, j] = weights[j, i] = w

# Convert to long format; absent edges → NaN so they render as background color
rows = []
for i in range(n):
    for j in range(n):
        w = weights[i, j]
        rows.append({"source": names[i], "target": names[j], "weight": w if w > 0 else np.nan})

df = pd.DataFrame(rows)

# Categorical ordering: x left-to-right = Dept A → C; y reversed so Dept A is at top
df["source"] = pd.Categorical(df["source"], categories=names, ordered=True)
df["target"] = pd.Categorical(df["target"], categories=names[::-1], ordered=True)

# anyplot theme
anyplot_theme = theme(
    plot_background=element_rect(fill=PAGE_BG, color=PAGE_BG),
    panel_background=element_rect(fill=PAGE_BG),
    panel_grid=element_blank(),
    axis_title=element_text(color=INK, size=20),
    axis_text=element_text(color=INK_SOFT, size=11),
    axis_line=element_blank(),
    plot_title=element_text(color=INK, size=24),
    legend_background=element_rect(fill=ELEVATED_BG, color=INK_SOFT),
    legend_text=element_text(color=INK_SOFT, size=16),
    legend_title=element_text(color=INK, size=16),
)

# Plot
plot = (
    ggplot(df, aes(x="source", y="target", fill="weight"))
    + geom_tile()
    + scale_fill_viridis(name="Collaboration\nStrength", na_value=PAGE_BG)
    + labs(title="heatmap-adjacency · letsplot · anyplot.ai", x="Researcher", y="Researcher")
    + anyplot_theme
    + theme(axis_text_x=element_text(angle=90, hjust=1, size=11))
    + ggsize(1200, 1200)
)

# Save
ggsave(plot, f"plot-{THEME}.png", path=".", scale=3)
ggsave(plot, f"plot-{THEME}.html", path=".")
Runnable source as JSON, for any HTTP client: https://api.anyplot.ai/specs/heatmap-adjacency/letsplot/code. Any spec id and library id listed in llms-full.txt fit the same URL shape; every URL below is complete and callable.
{
  "spec_id": "heatmap-adjacency",
  "language": "python",
  "library": "letsplot",
  "page": "https://anyplot.ai/heatmap-adjacency/python/letsplot",
  "hub": "https://anyplot.ai/heatmap-adjacency",
  "code_json": "https://api.anyplot.ai/specs/heatmap-adjacency/letsplot/code",
  "spec_json": "https://api.anyplot.ai/specs/heatmap-adjacency",
  "render_light_png": "https://storage.googleapis.com/anyplot-images/plots/heatmap-adjacency/python/letsplot/plot-light.png",
  "render_dark_png": "https://storage.googleapis.com/anyplot-images/plots/heatmap-adjacency/python/letsplot/plot-dark.png",
  "interactive_light_html": "https://storage.googleapis.com/anyplot-images/plots/heatmap-adjacency/python/letsplot/plot-light.html",
  "interactive_dark_html": "https://storage.googleapis.com/anyplot-images/plots/heatmap-adjacency/python/letsplot/plot-dark.html",
  "quality_score": 85.0,
  "license": "MIT",
  "guide": "https://anyplot.ai/llms.txt"
}
Part of Network Adjacency Matrix Heatmap on anyplot.ai.