The same plot in 14 other libraries — Python: Altair, Bokeh, lets-plot, Matplotlib, Plotly, plotnine, Pygal, Seaborn; R: ggplot2; JavaScript: Chart.js, D3.js, Apache ECharts, Highcharts, MUI X Charts. Compare all 15 side by side: Network Adjacency Matrix Heatmap in Python, R, Julia and JavaScript.
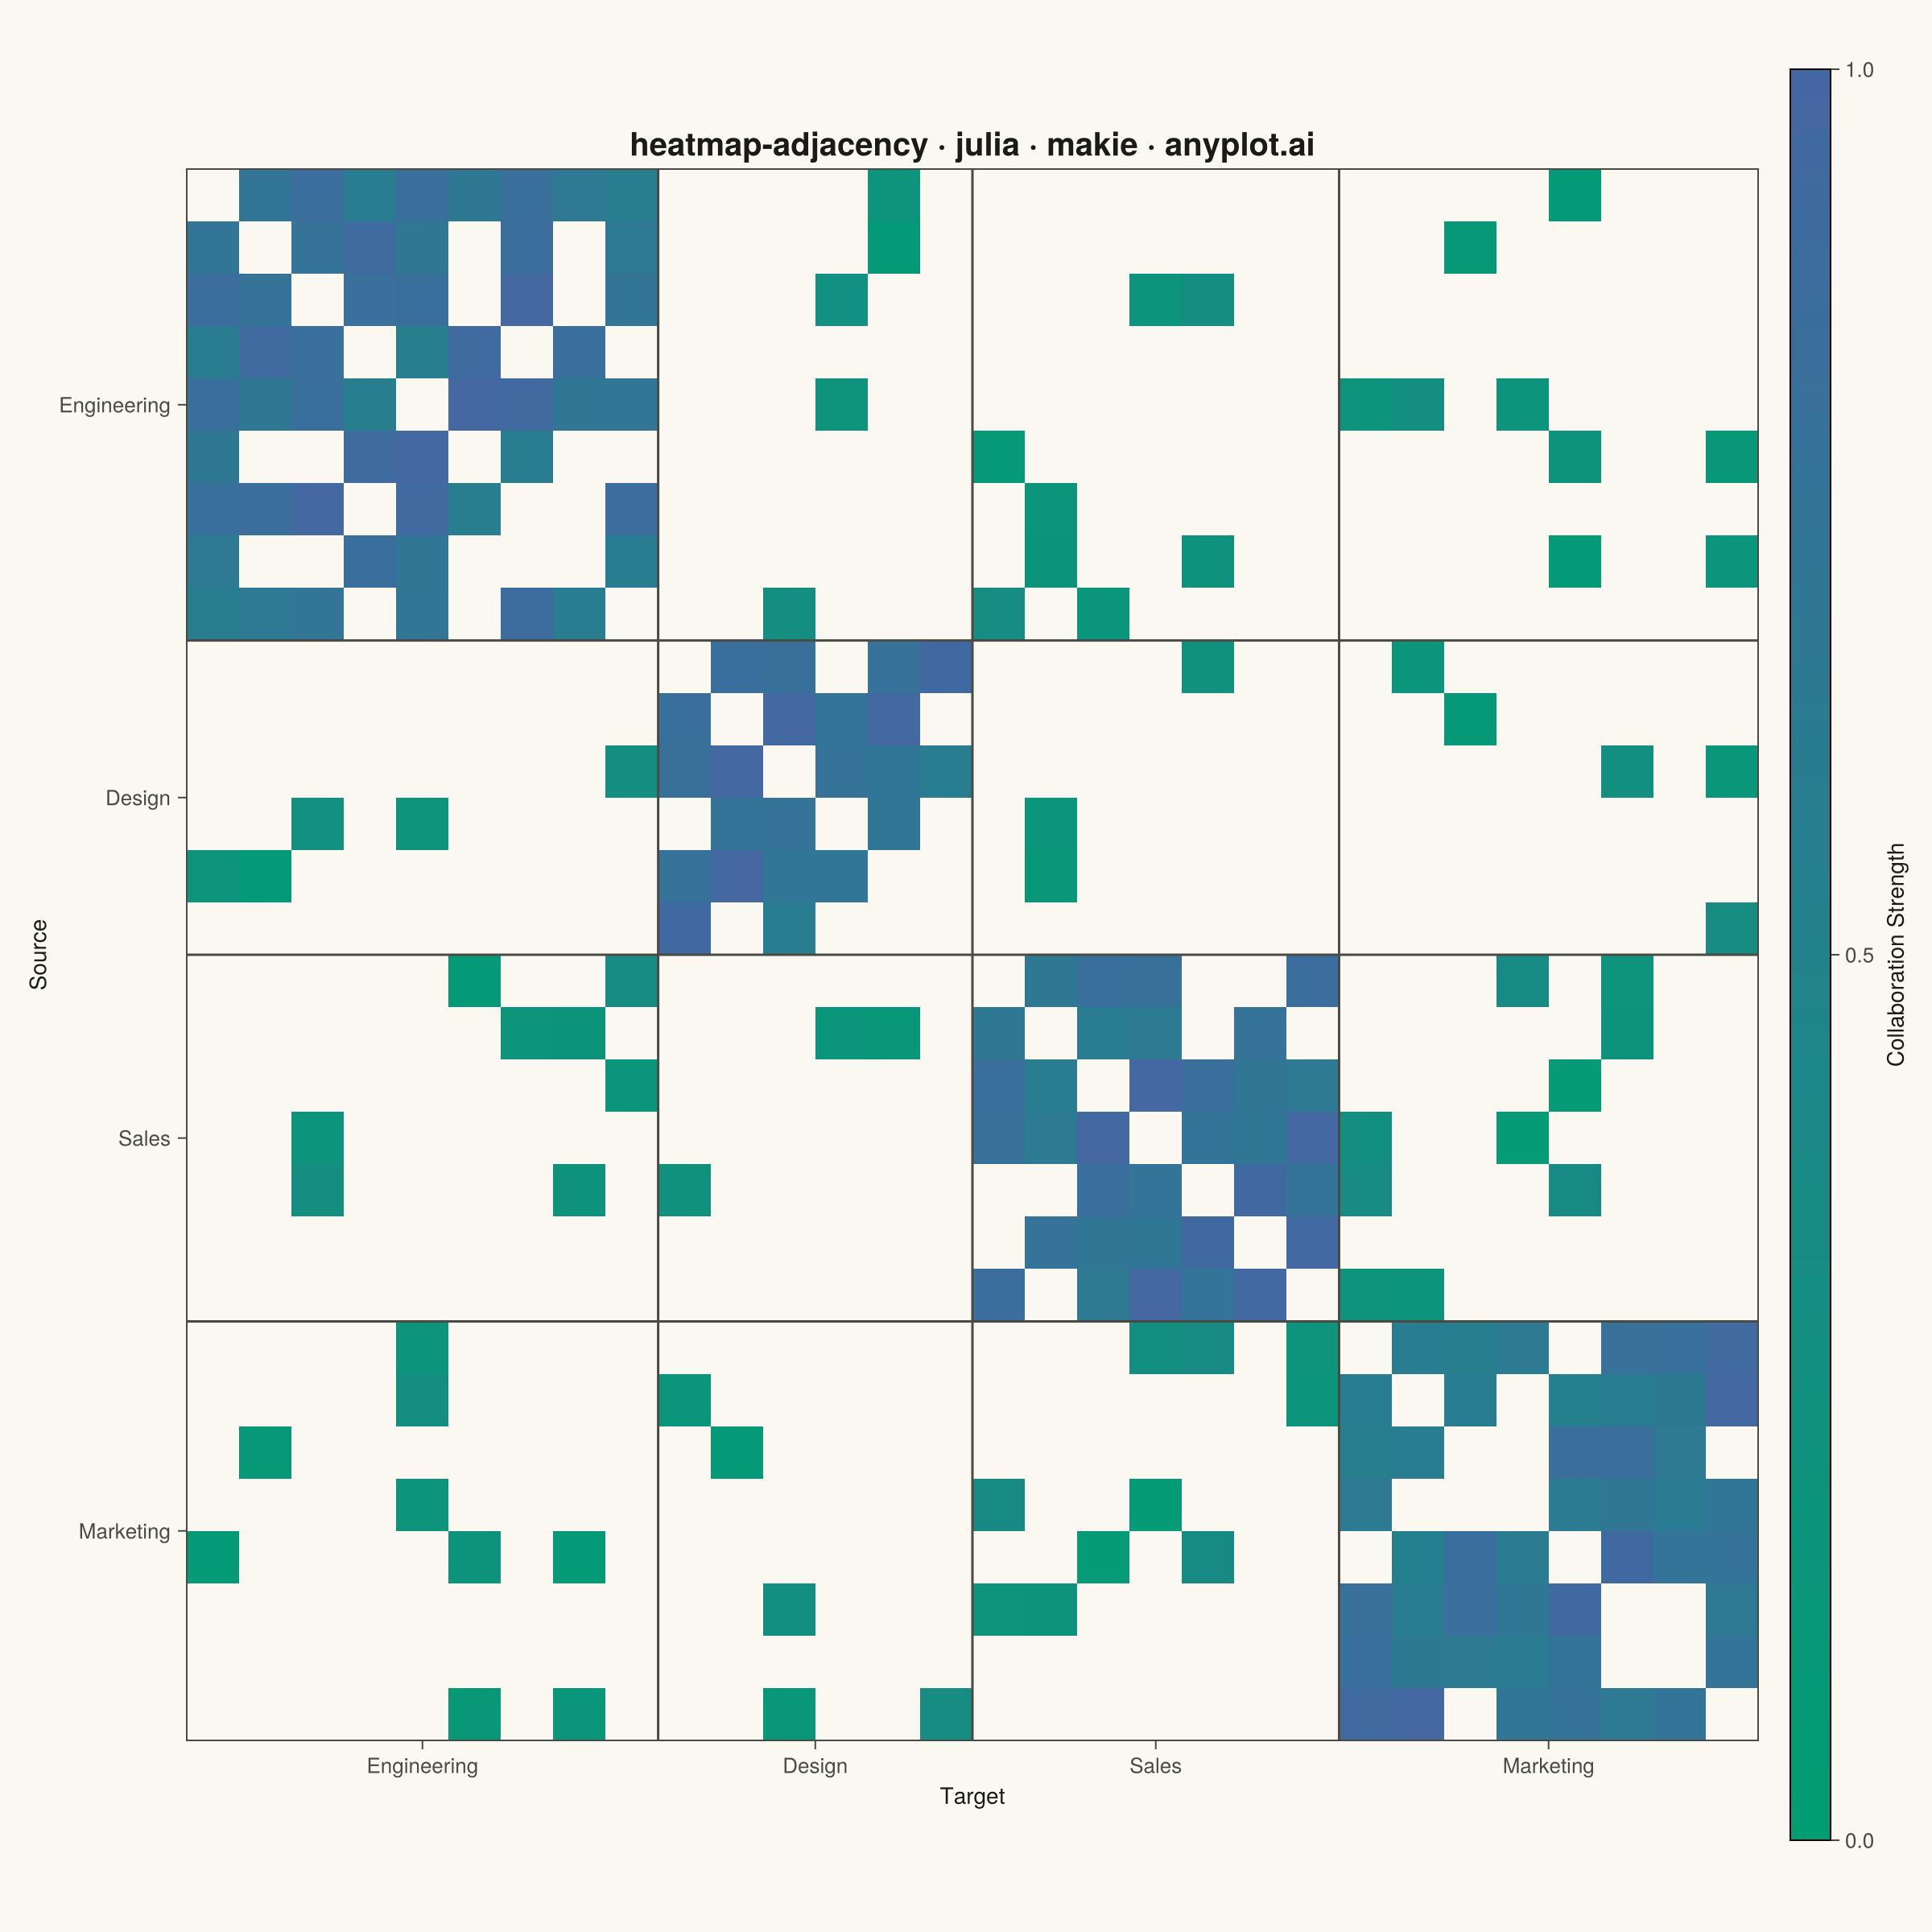
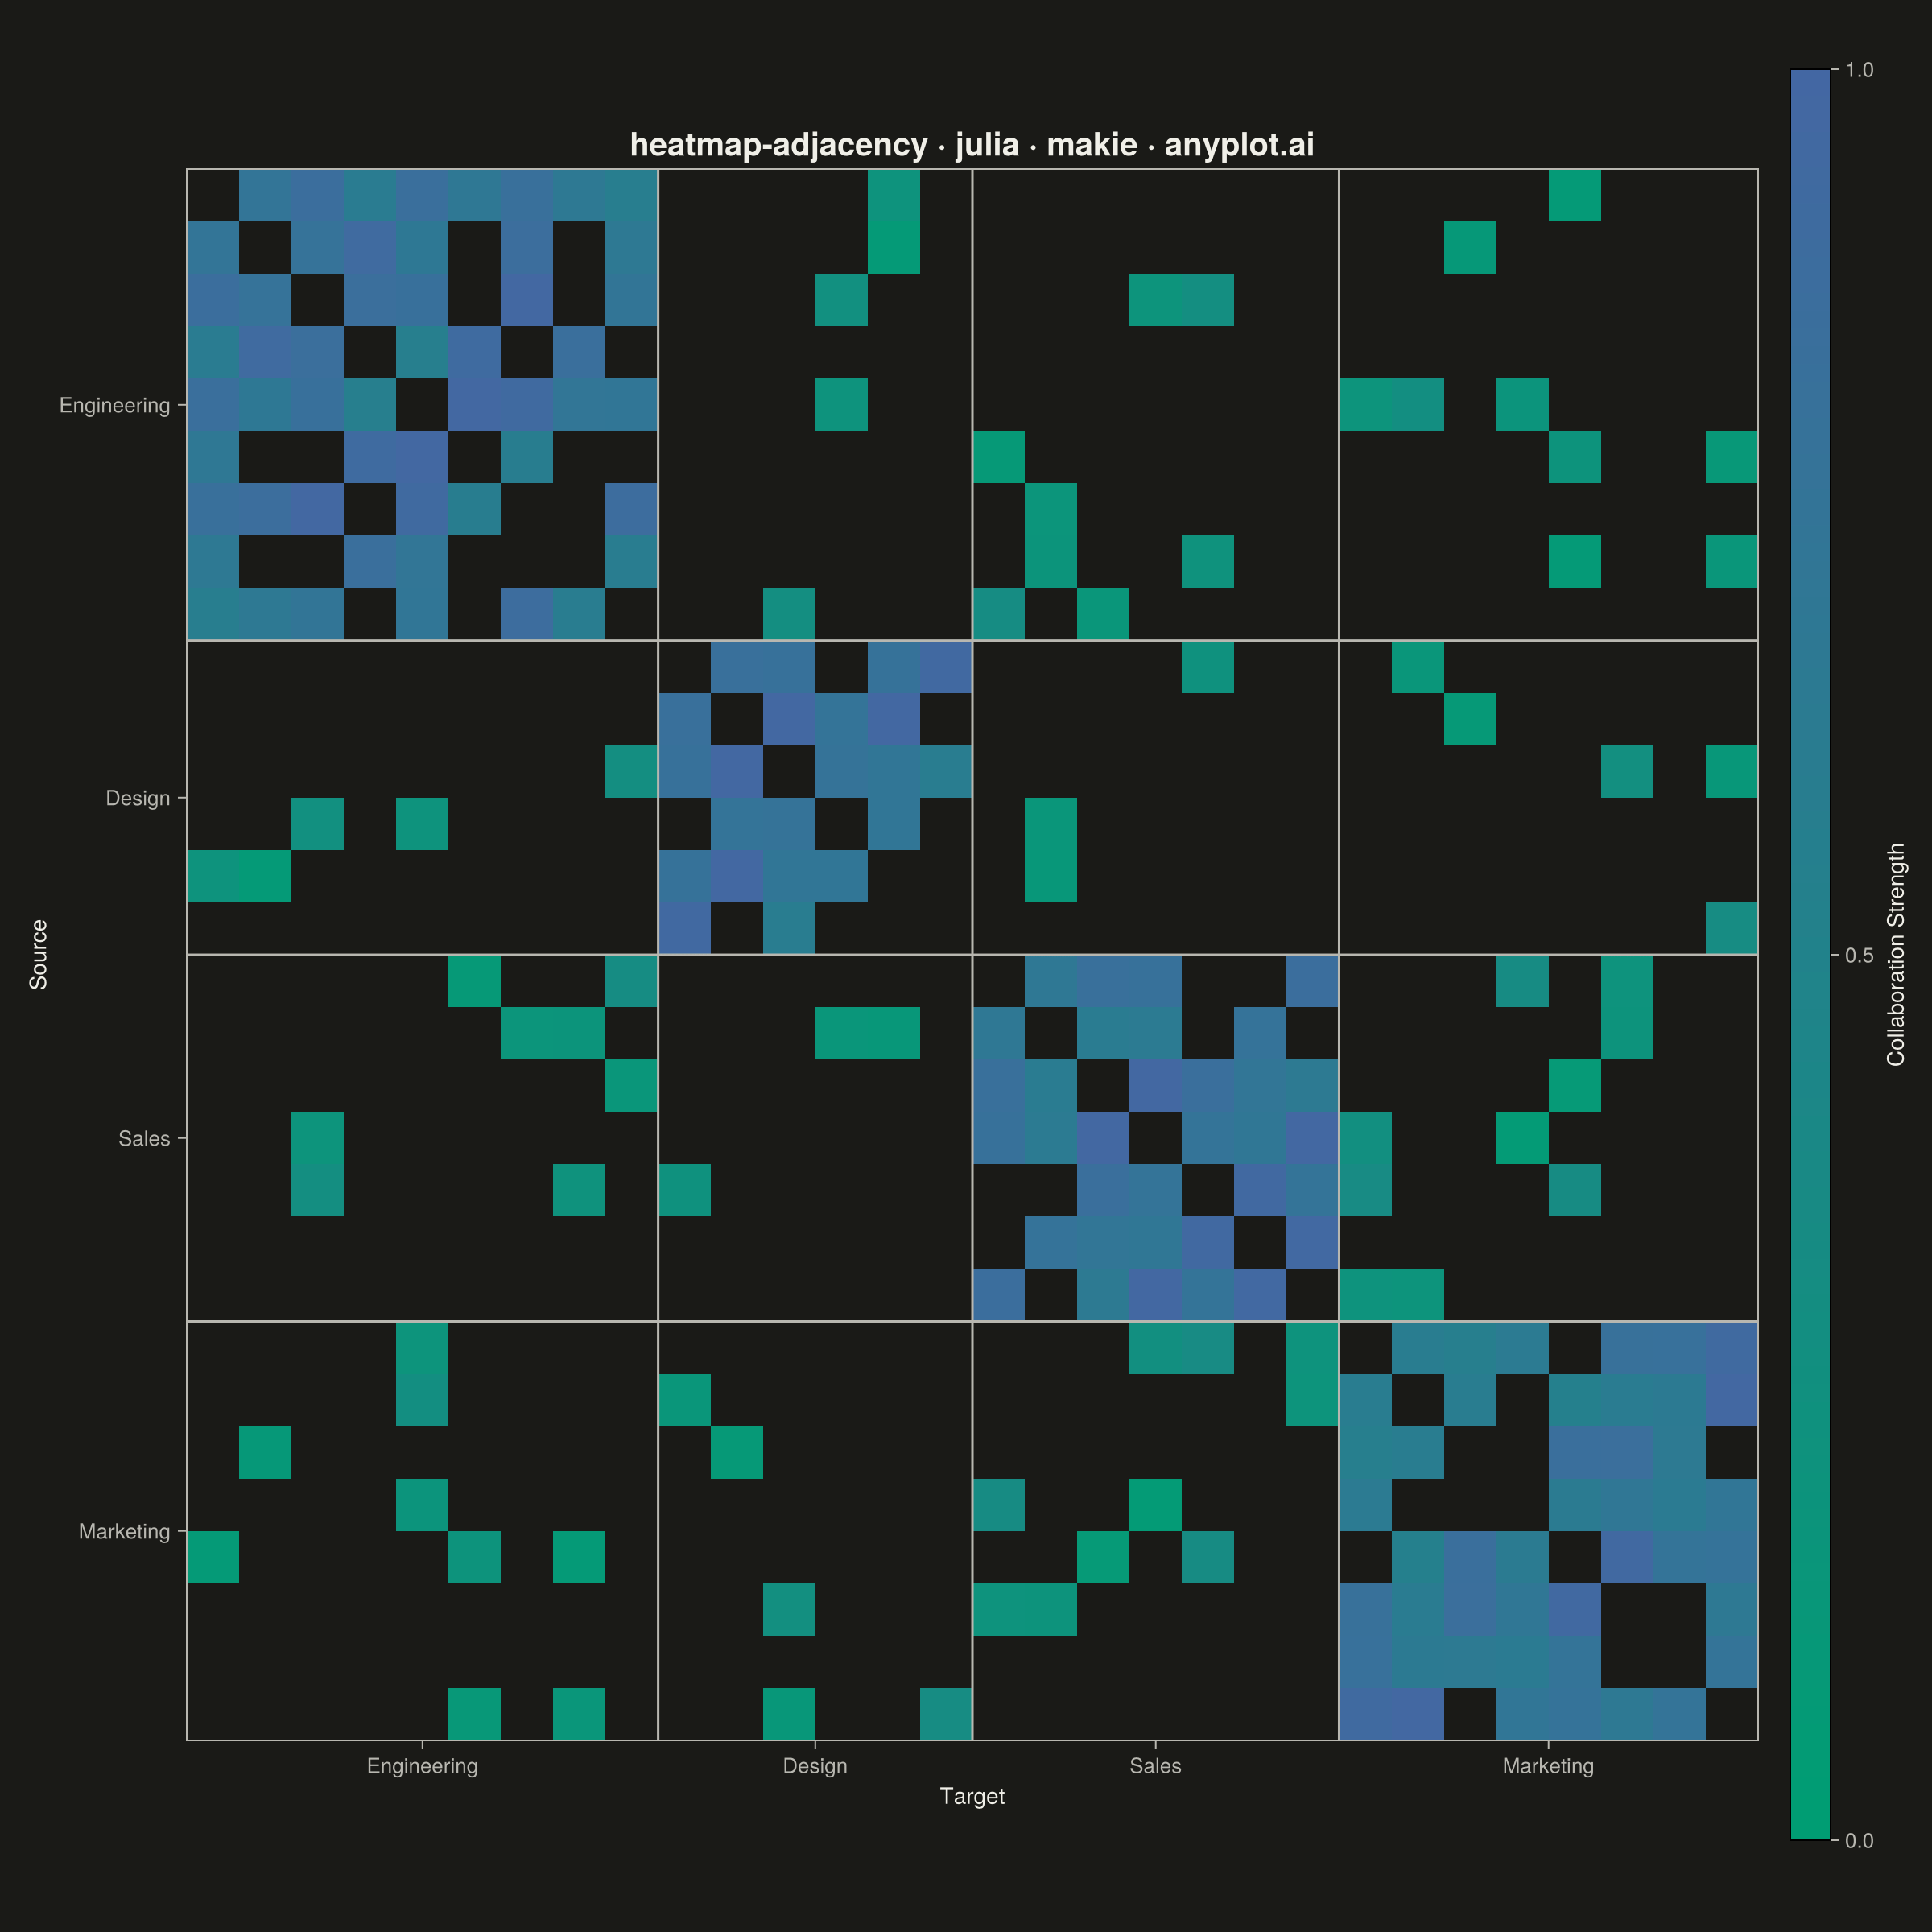
A matrix-based representation of a network or graph where rows and columns represent nodes and cell color indicates the presence or weight of edges between them. This visualization complements node-link diagrams by excelling at revealing clusters, structural patterns, and density in large or dense networks where node-link layouts become cluttered. Reordering nodes by cluster, degree, or community membership exposes block-diagonal structure and makes group boundaries immediately visible.
# anyplot.ai
# heatmap-adjacency: Network Adjacency Matrix Heatmap
# Library: makie 0.21.9 | Julia 1.11.9
# Quality: 88/100 | Created: 2026-09-05

using CairoMakie
using Colors
using Random

Random.seed!(42)

# --- Theme tokens -----------------------------------------------------------
const THEME    = get(ENV, "ANYPLOT_THEME", "light")
const PAGE_BG  = THEME == "light" ? colorant"#FAF8F1" : colorant"#1A1A17"
const INK      = THEME == "light" ? colorant"#1A1A17" : colorant"#F0EFE8"
const INK_SOFT = THEME == "light" ? colorant"#4A4A44" : colorant"#B8B7B0"

# Continuous colormap — sequential, single-polarity (collaboration strength)
const ANYPLOT_SEQ = cgrad([colorant"#009E73", colorant"#4467A3"])

# --- Data ---------------------------------------------------------------
# Cross-team collaboration network: employees grouped by team, weight =
# frequency of joint project work. Nodes are pre-ordered by team so the
# within-team block-diagonal structure is immediately visible.
team_names = ["Engineering", "Design", "Sales", "Marketing"]
team_sizes = [9, 6, 7, 8]
n_nodes = sum(team_sizes)
node_team = vcat([fill(i, team_sizes[i]) for i in eachindex(team_sizes)]...)

# Undirected weighted adjacency matrix — both triangles filled symmetrically.
# Absent edges (including the diagonal) stay NaN so they render as a
# distinct background color rather than a low-intensity data color.
collaboration = fill(NaN, n_nodes, n_nodes)
for i in 1:n_nodes, j in (i + 1):n_nodes
    same_team = node_team[i] == node_team[j]
    connected = same_team ? rand() < 0.75 : rand() < 0.12
    if connected
        weight = same_team ? 0.55 + rand() * 0.45 : 0.05 + rand() * 0.30
        collaboration[i, j] = weight
        collaboration[j, i] = weight
    end
end

# Group boundaries (between blocks) and centers (for tick labels)
cum_sizes = cumsum(team_sizes)
boundaries = cum_sizes[1:(end - 1)] .+ 0.5
centers = cum_sizes .- team_sizes ./ 2 .+ 0.5

# --- Plot -----------------------------------------------------------------
fig = Figure(
    size            = (1200, 1200),
    fontsize        = 14,
    backgroundcolor = PAGE_BG,
)

ax = Axis(
    fig[1, 1];
    title              = "heatmap-adjacency · julia · makie · anyplot.ai",
    titlesize          = 20,
    titlecolor         = INK,
    subtitle           = "$(n_nodes) nodes, ordered by team",
    subtitlesize       = 13,
    subtitlecolor      = INK_SOFT,
    xlabel             = "Target",
    ylabel             = "Source",
    xlabelsize         = 14,
    ylabelsize         = 14,
    xlabelcolor        = INK,
    ylabelcolor        = INK,
    xticks             = (centers, team_names),
    yticks             = (centers, team_names),
    xticklabelsize     = 13,
    yticklabelsize     = 13,
    xticklabelcolor    = INK_SOFT,
    yticklabelcolor    = INK_SOFT,
    xtickcolor         = INK_SOFT,
    ytickcolor         = INK_SOFT,
    # Unlabeled per-node minor ticks confirm the true 30x30 node density
    # underneath the 4 labeled team blocks.
    xminorticksvisible = true,
    yminorticksvisible = true,
    xminorticks        = 0.5:1:(n_nodes + 0.5),
    yminorticks        = 0.5:1:(n_nodes + 0.5),
    xminortickalign    = 1,
    yminortickalign    = 1,
    xminortickcolor    = INK_SOFT,
    yminortickcolor    = INK_SOFT,
    xminorticksize     = 3,
    yminorticksize     = 3,
    backgroundcolor    = PAGE_BG,
    aspect             = DataAspect(),
    # Enclosed heatmap grid — style-guide spine exception keeps all 4 sides.
    topspinevisible    = true,
    rightspinevisible  = true,
    leftspinecolor     = INK_SOFT,
    bottomspinecolor   = INK_SOFT,
    topspinecolor      = INK_SOFT,
    rightspinecolor    = INK_SOFT,
    xgridvisible       = false,
    ygridvisible       = false,
)
ax.yreversed = true

hm = heatmap!(
    ax, collaboration;
    colormap   = ANYPLOT_SEQ,
    colorrange = (0.0, 1.0),
    nan_color  = PAGE_BG,
)

vlines!(ax, boundaries; color = INK_SOFT, linewidth = 1.5)
hlines!(ax, boundaries; color = INK_SOFT, linewidth = 1.5)

Colorbar(
    fig[1, 2], hm;
    label           = "Collaboration Strength",
    labelcolor      = INK,
    labelsize       = 14,
    ticklabelcolor  = INK_SOFT,
    ticklabelsize   = 13,
    tickcolor       = INK_SOFT,
    width           = 25,
)
colgap!(fig.layout, 20)

# --- Save -------------------------------------------------------------------
save("plot-$(THEME).png", fig; px_per_unit = 2)
Runnable source as JSON, for any HTTP client: https://api.anyplot.ai/specs/heatmap-adjacency/makie/code. Any spec id and library id listed in llms-full.txt fit the same URL shape; every URL below is complete and callable.
{
  "spec_id": "heatmap-adjacency",
  "language": "julia",
  "library": "makie",
  "page": "https://anyplot.ai/heatmap-adjacency/julia/makie",
  "hub": "https://anyplot.ai/heatmap-adjacency",
  "code_json": "https://api.anyplot.ai/specs/heatmap-adjacency/makie/code",
  "spec_json": "https://api.anyplot.ai/specs/heatmap-adjacency",
  "render_light_png": "https://storage.googleapis.com/anyplot-images/plots/heatmap-adjacency/julia/makie/plot-light.png",
  "render_dark_png": "https://storage.googleapis.com/anyplot-images/plots/heatmap-adjacency/julia/makie/plot-dark.png",
  "quality_score": 88.0,
  "license": "MIT",
  "guide": "https://anyplot.ai/llms.txt"
}
Part of Network Adjacency Matrix Heatmap on anyplot.ai.