The same plot in 14 other libraries — JavaScript: Chart.js, D3.js, Highcharts, MUI X Charts; Python: Altair, Bokeh, lets-plot, Matplotlib, Plotly, plotnine, Pygal, Seaborn; R: ggplot2; Julia: Makie.jl. Compare all 15 side by side: Network Adjacency Matrix Heatmap in Python, R, Julia and JavaScript.
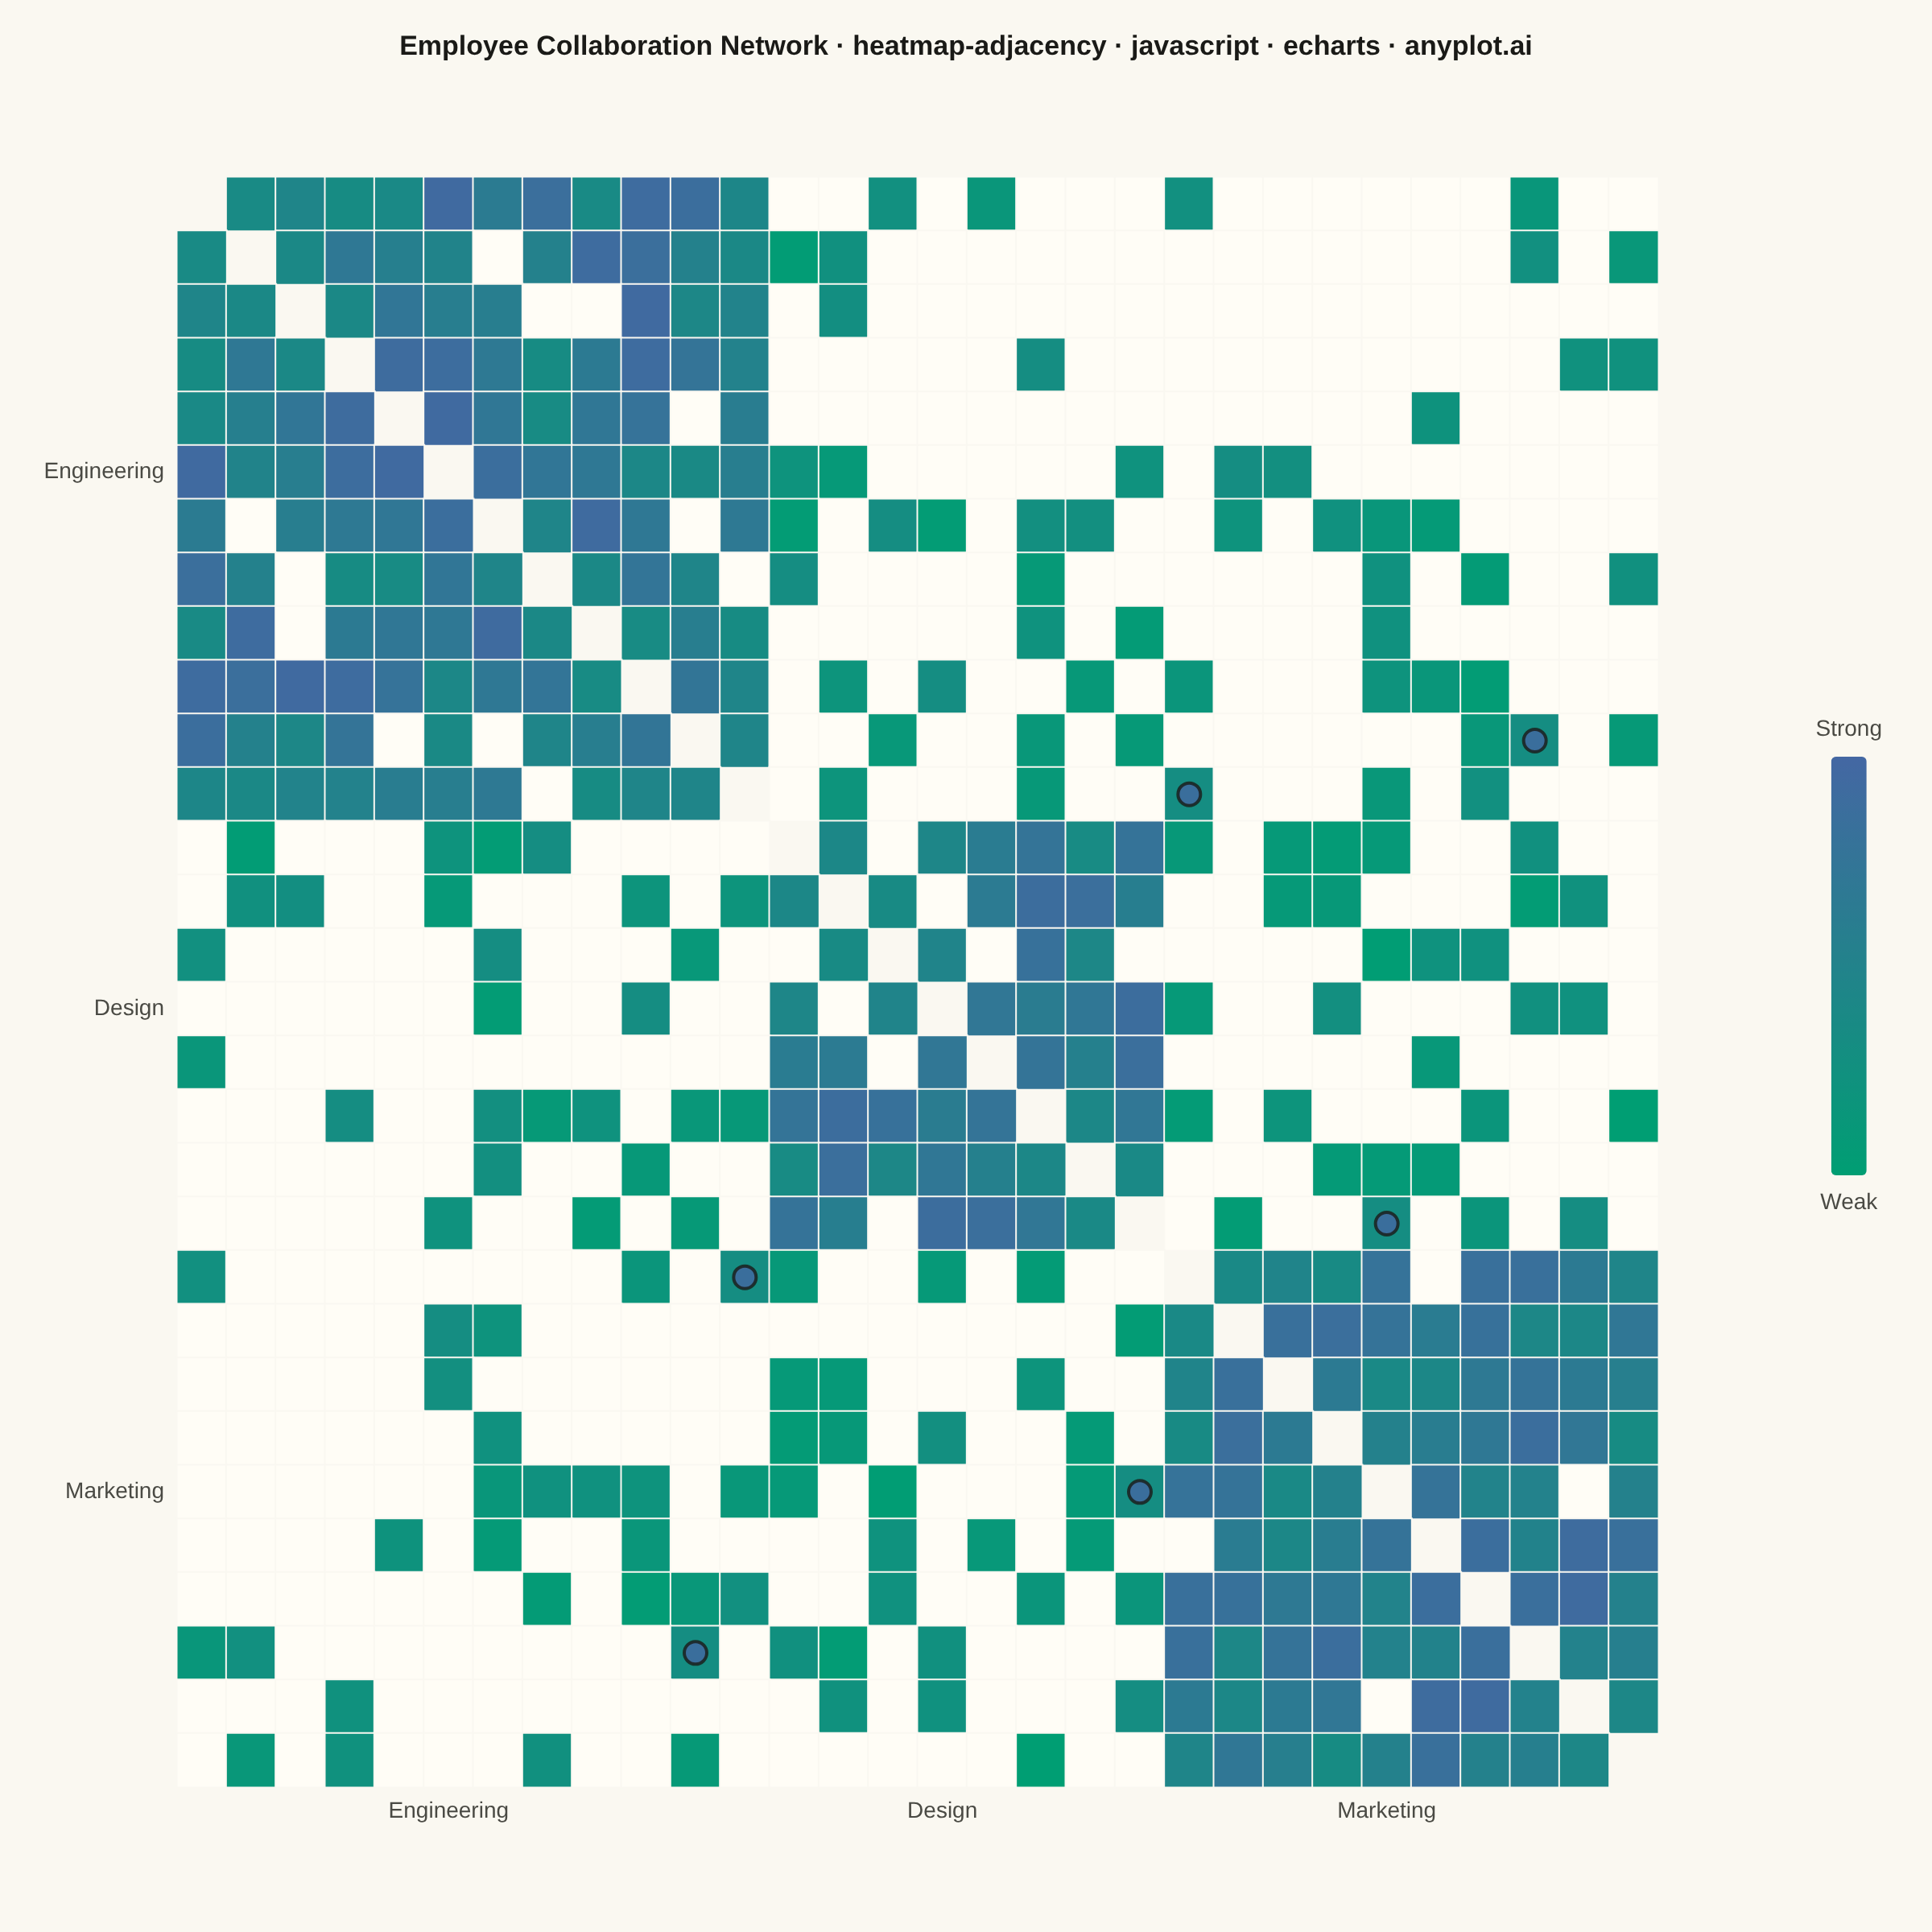
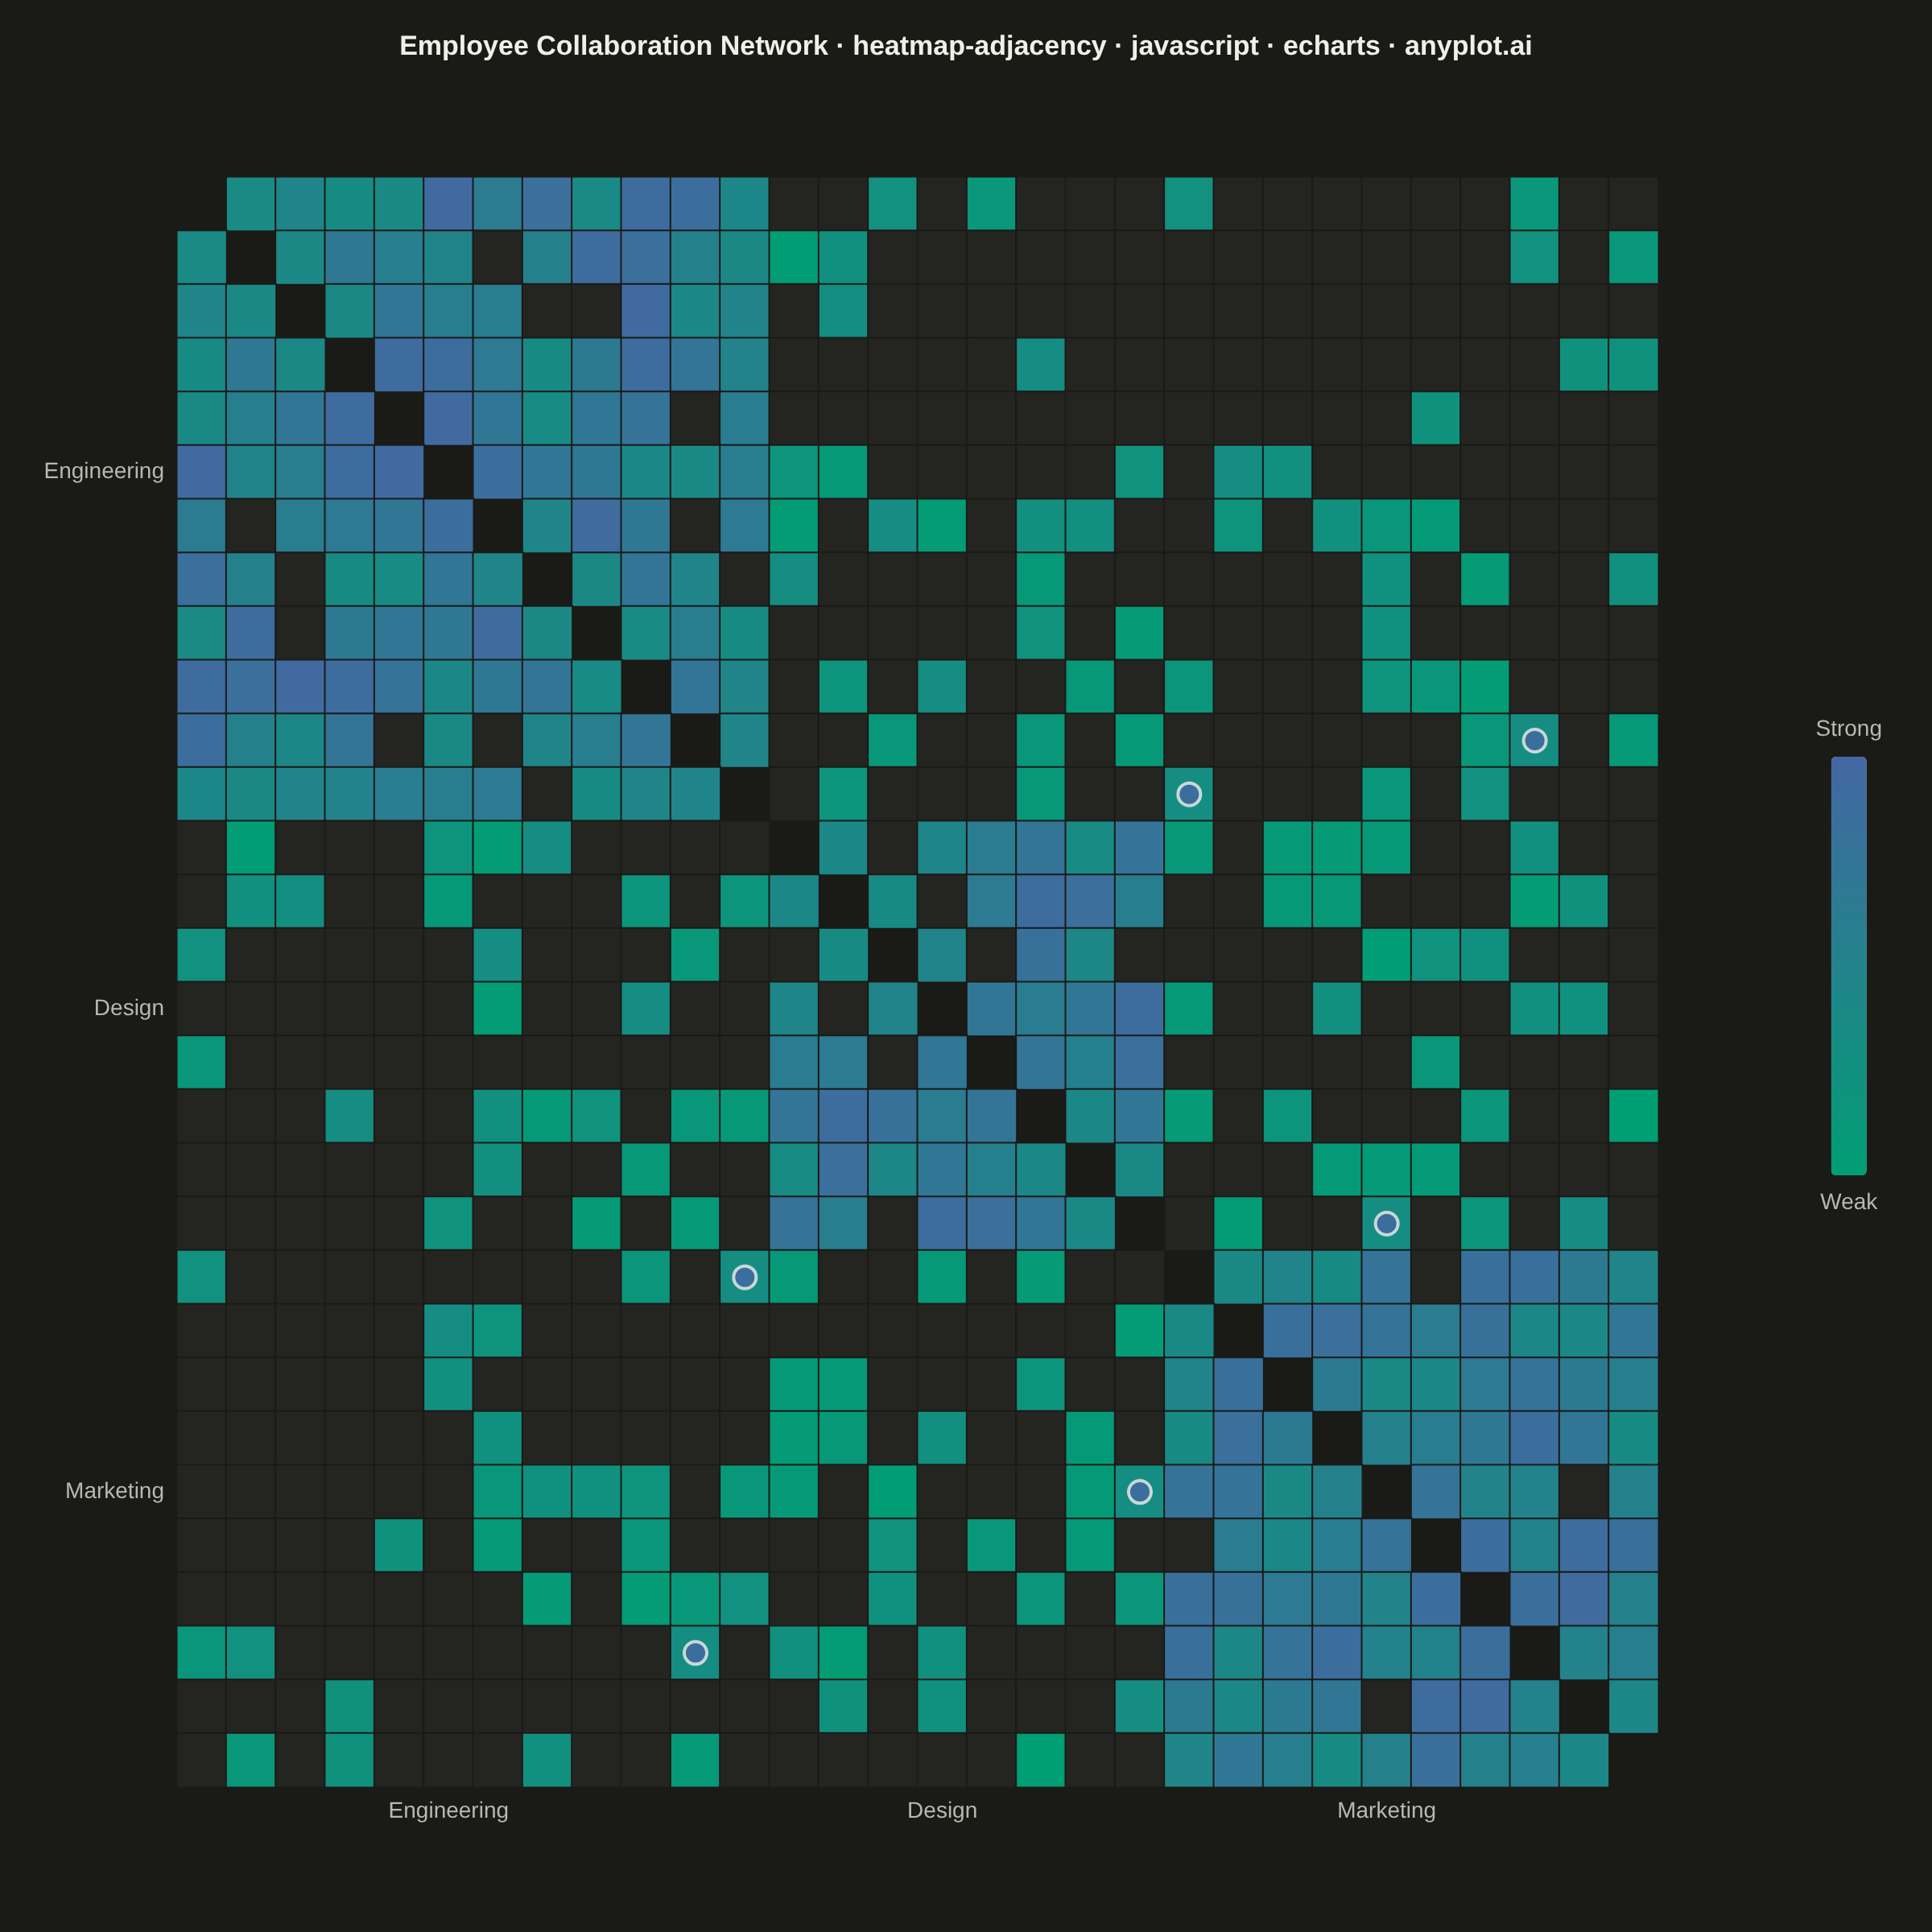
A matrix-based representation of a network or graph where rows and columns represent nodes and cell color indicates the presence or weight of edges between them. This visualization complements node-link diagrams by excelling at revealing clusters, structural patterns, and density in large or dense networks where node-link layouts become cluttered. Reordering nodes by cluster, degree, or community membership exposes block-diagonal structure and makes group boundaries immediately visible.
// anyplot.ai
// heatmap-adjacency: Network Adjacency Matrix Heatmap
// Library: echarts 6.1.0 | JavaScript 22.23.2
// Quality: 91/100 | Created: 2026-09-05

//# anyplot-orientation: square
const t = window.ANYPLOT_TOKENS;

// --- Data: employee collaboration network, grouped by department -----------
// Node order is fixed by department membership so the matrix exposes
// block-diagonal structure (dense intra-department collaboration) without
// any extra clustering step.
const departments = [
  { name: "Engineering", size: 12 },
  { name: "Design", size: 8 },
  { name: "Marketing", size: 10 },
];

const nodeNames = [];
const nodeDept = [];
departments.forEach((dept, deptIndex) => {
  for (let i = 1; i <= dept.size; i++) {
    nodeNames.push(`${dept.name.slice(0, 3).toUpperCase()}-${i}`);
    nodeDept.push(deptIndex);
  }
});
const n = nodeNames.length;

// Boundary label: show the department name once, centered under its block.
const boundaryLabel = {};
let cursor = 0;
departments.forEach((dept) => {
  boundaryLabel[cursor + Math.floor((dept.size - 1) / 2)] = dept.name;
  cursor += dept.size;
});
const axisLabelFormatter = (value, index) => boundaryLabel[index] ?? "";

// Fixed-seed LCG so the matrix is reproducible without a browser RNG.
const makeRng = (seed) => {
  let state = seed >>> 0;
  return () => {
    state = (state * 1664525 + 1013904223) >>> 0;
    return state / 4294967296;
  };
};
const rng = makeRng(42);

// Symmetric weight matrix: dense within a department, sparse across.
const weights = Array.from({ length: n }, () => new Array(n).fill(0));
for (let i = 0; i < n; i++) {
  for (let j = i + 1; j < n; j++) {
    const sameDept = nodeDept[i] === nodeDept[j];
    let w = 0;
    if (sameDept && rng() > 0.12) {
      w = 0.35 + rng() * 0.6;
    } else if (!sameDept && rng() > 0.75) {
      w = 0.05 + rng() * 0.3;
    }
    w = Math.round(w * 100) / 100;
    weights[i][j] = w;
    weights[j][i] = w;
  }
}

// Heatmap cells: [colIndex, rowIndex, weight]. The diagonal (self) is
// omitted entirely; absent edges (weight 0) get an explicit near-background
// fill so they read as "no connection" rather than the low end of the scale.
const cells = [];
for (let row = 0; row < n; row++) {
  for (let col = 0; col < n; col++) {
    if (row === col) continue;
    const w = weights[row][col];
    cells.push({
      value: [col, row, w],
      itemStyle:
        w === 0
          ? { color: t.elevatedBg, borderColor: t.pageBg, borderWidth: 1 }
          : { borderColor: t.pageBg, borderWidth: 1 },
    });
  }
}

// Notable structural exceptions: the strongest cross-department ties that
// bridge otherwise-separate blocks. Called out with a ring marker so the
// viewer's eye is drawn past the block-diagonal pattern to the few
// collaborations that cross department lines.
const bridges = [];
for (let i = 0; i < n; i++) {
  for (let j = i + 1; j < n; j++) {
    if (nodeDept[i] !== nodeDept[j] && weights[i][j] > 0) {
      bridges.push([i, j, weights[i][j]]);
    }
  }
}
bridges.sort((a, b) => b[2] - a[2]);
const bridgeMarkers = [];
bridges.slice(0, 3).forEach(([i, j]) => {
  bridgeMarkers.push([j, i]);
  bridgeMarkers.push([i, j]);
});

// --- Init -------------------------------------------------------------------
const chart = echarts.init(document.getElementById("container"));

// --- Option -----------------------------------------------------------------
chart.setOption({
  animation: false,
  backgroundColor: "transparent",
  title: {
    text: "Employee Collaboration Network · heatmap-adjacency · javascript · echarts · anyplot.ai",
    left: "center",
    top: 16,
    textStyle: { color: t.ink, fontSize: 17 },
  },
  tooltip: {
    formatter: (p) =>
      p.value[2] > 0
        ? `${nodeNames[p.value[1]]} ↔ ${nodeNames[p.value[0]]}<br/>strength: ${p.value[2].toFixed(2)}`
        : `${nodeNames[p.value[1]]} ↔ ${nodeNames[p.value[0]]}<br/>no connection`,
  },
  grid: { left: 110, right: 170, top: 110, bottom: 90 },
  xAxis: {
    type: "category",
    data: nodeNames,
    position: "bottom",
    axisLine: { show: false },
    axisTick: { show: false },
    splitLine: { show: false },
    axisLabel: { color: t.inkSoft, fontSize: 14, interval: 0, formatter: axisLabelFormatter },
    // Boundary labels keep the 30-node axis readable; hovering near the axis
    // still reveals the individual node name via the axis pointer.
    axisPointer: { show: true, type: "line", label: { show: true, backgroundColor: t.ink, color: t.pageBg, fontSize: 12 } },
  },
  yAxis: {
    type: "category",
    data: nodeNames,
    inverse: true,
    axisLine: { show: false },
    axisTick: { show: false },
    splitLine: { show: false },
    axisLabel: { color: t.inkSoft, fontSize: 14, interval: 0, formatter: axisLabelFormatter },
    axisPointer: { show: true, type: "line", label: { show: true, backgroundColor: t.ink, color: t.pageBg, fontSize: 12 } },
  },
  // Lets viewers zoom into a department block to inspect individual node
  // pairs on the 30x30 matrix without cluttering the static view with labels.
  dataZoom: [
    { type: "inside", xAxisIndex: 0, filterMode: "none" },
    { type: "inside", yAxisIndex: 0, filterMode: "none" },
  ],
  visualMap: {
    type: "continuous",
    min: 0.05,
    max: 1,
    calculable: false,
    orient: "vertical",
    right: 16,
    top: "middle",
    itemWidth: 22,
    itemHeight: 260,
    text: ["Strong", "Weak"],
    textStyle: { color: t.inkSoft, fontSize: 14 },
    inRange: { color: t.seq },
  },
  series: [
    {
      type: "heatmap",
      data: cells,
      itemStyle: { color: t.elevatedBg },
    },
    {
      type: "scatter",
      name: "Notable cross-department bridge",
      data: bridgeMarkers,
      symbol: "circle",
      symbolSize: 14,
      itemStyle: { color: "transparent", borderColor: t.ink, borderWidth: 2 },
      tooltip: {
        formatter: (p) =>
          `${nodeNames[p.value[1]]} ↔ ${nodeNames[p.value[0]]}<br/>notable cross-department bridge (strength ${weights[p.value[1]][p.value[0]].toFixed(2)})`,
      },
      z: 10,
    },
  ],
});
Runnable source as JSON, for any HTTP client: https://api.anyplot.ai/specs/heatmap-adjacency/echarts/code. Any spec id and library id listed in llms-full.txt fit the same URL shape; every URL below is complete and callable.
{
  "spec_id": "heatmap-adjacency",
  "language": "javascript",
  "library": "echarts",
  "page": "https://anyplot.ai/heatmap-adjacency/javascript/echarts",
  "hub": "https://anyplot.ai/heatmap-adjacency",
  "code_json": "https://api.anyplot.ai/specs/heatmap-adjacency/echarts/code",
  "spec_json": "https://api.anyplot.ai/specs/heatmap-adjacency",
  "render_light_png": "https://storage.googleapis.com/anyplot-images/plots/heatmap-adjacency/javascript/echarts/plot-light.png",
  "render_dark_png": "https://storage.googleapis.com/anyplot-images/plots/heatmap-adjacency/javascript/echarts/plot-dark.png",
  "interactive_light_html": "https://storage.googleapis.com/anyplot-images/plots/heatmap-adjacency/javascript/echarts/plot-light.html",
  "interactive_dark_html": "https://storage.googleapis.com/anyplot-images/plots/heatmap-adjacency/javascript/echarts/plot-dark.html",
  "quality_score": 91.0,
  "license": "MIT",
  "guide": "https://anyplot.ai/llms.txt"
}
Part of Network Adjacency Matrix Heatmap on anyplot.ai.