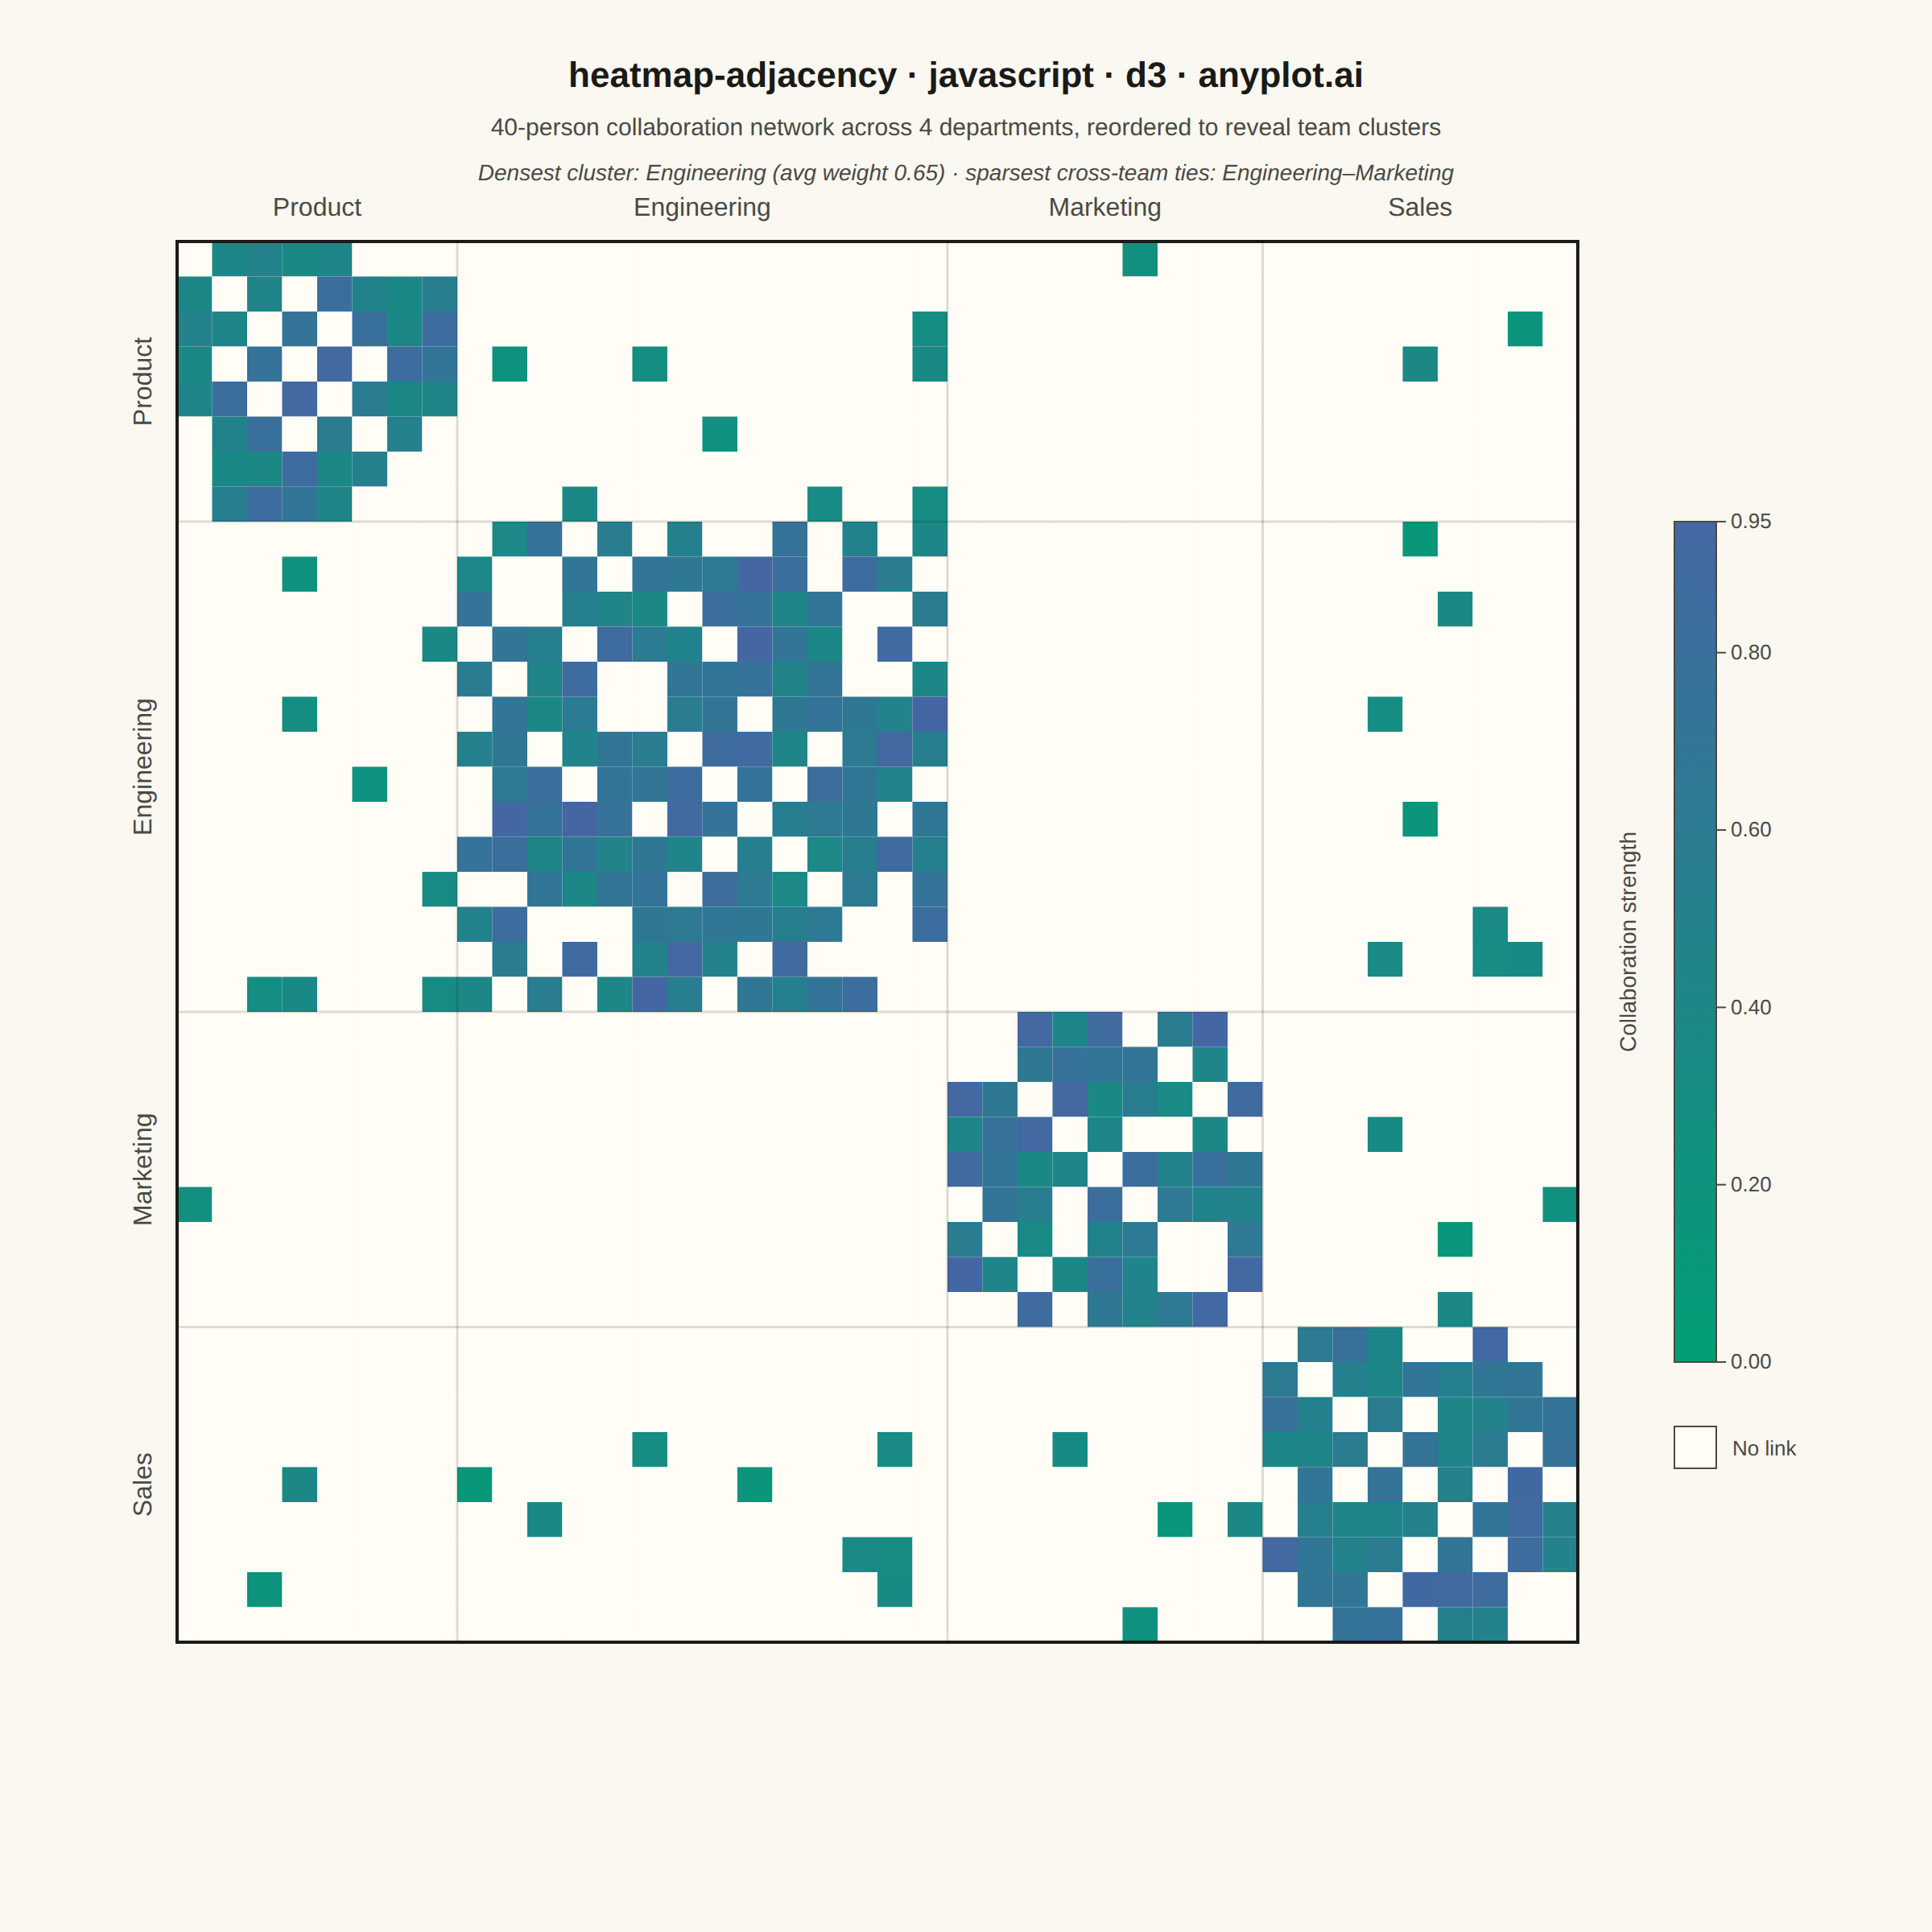
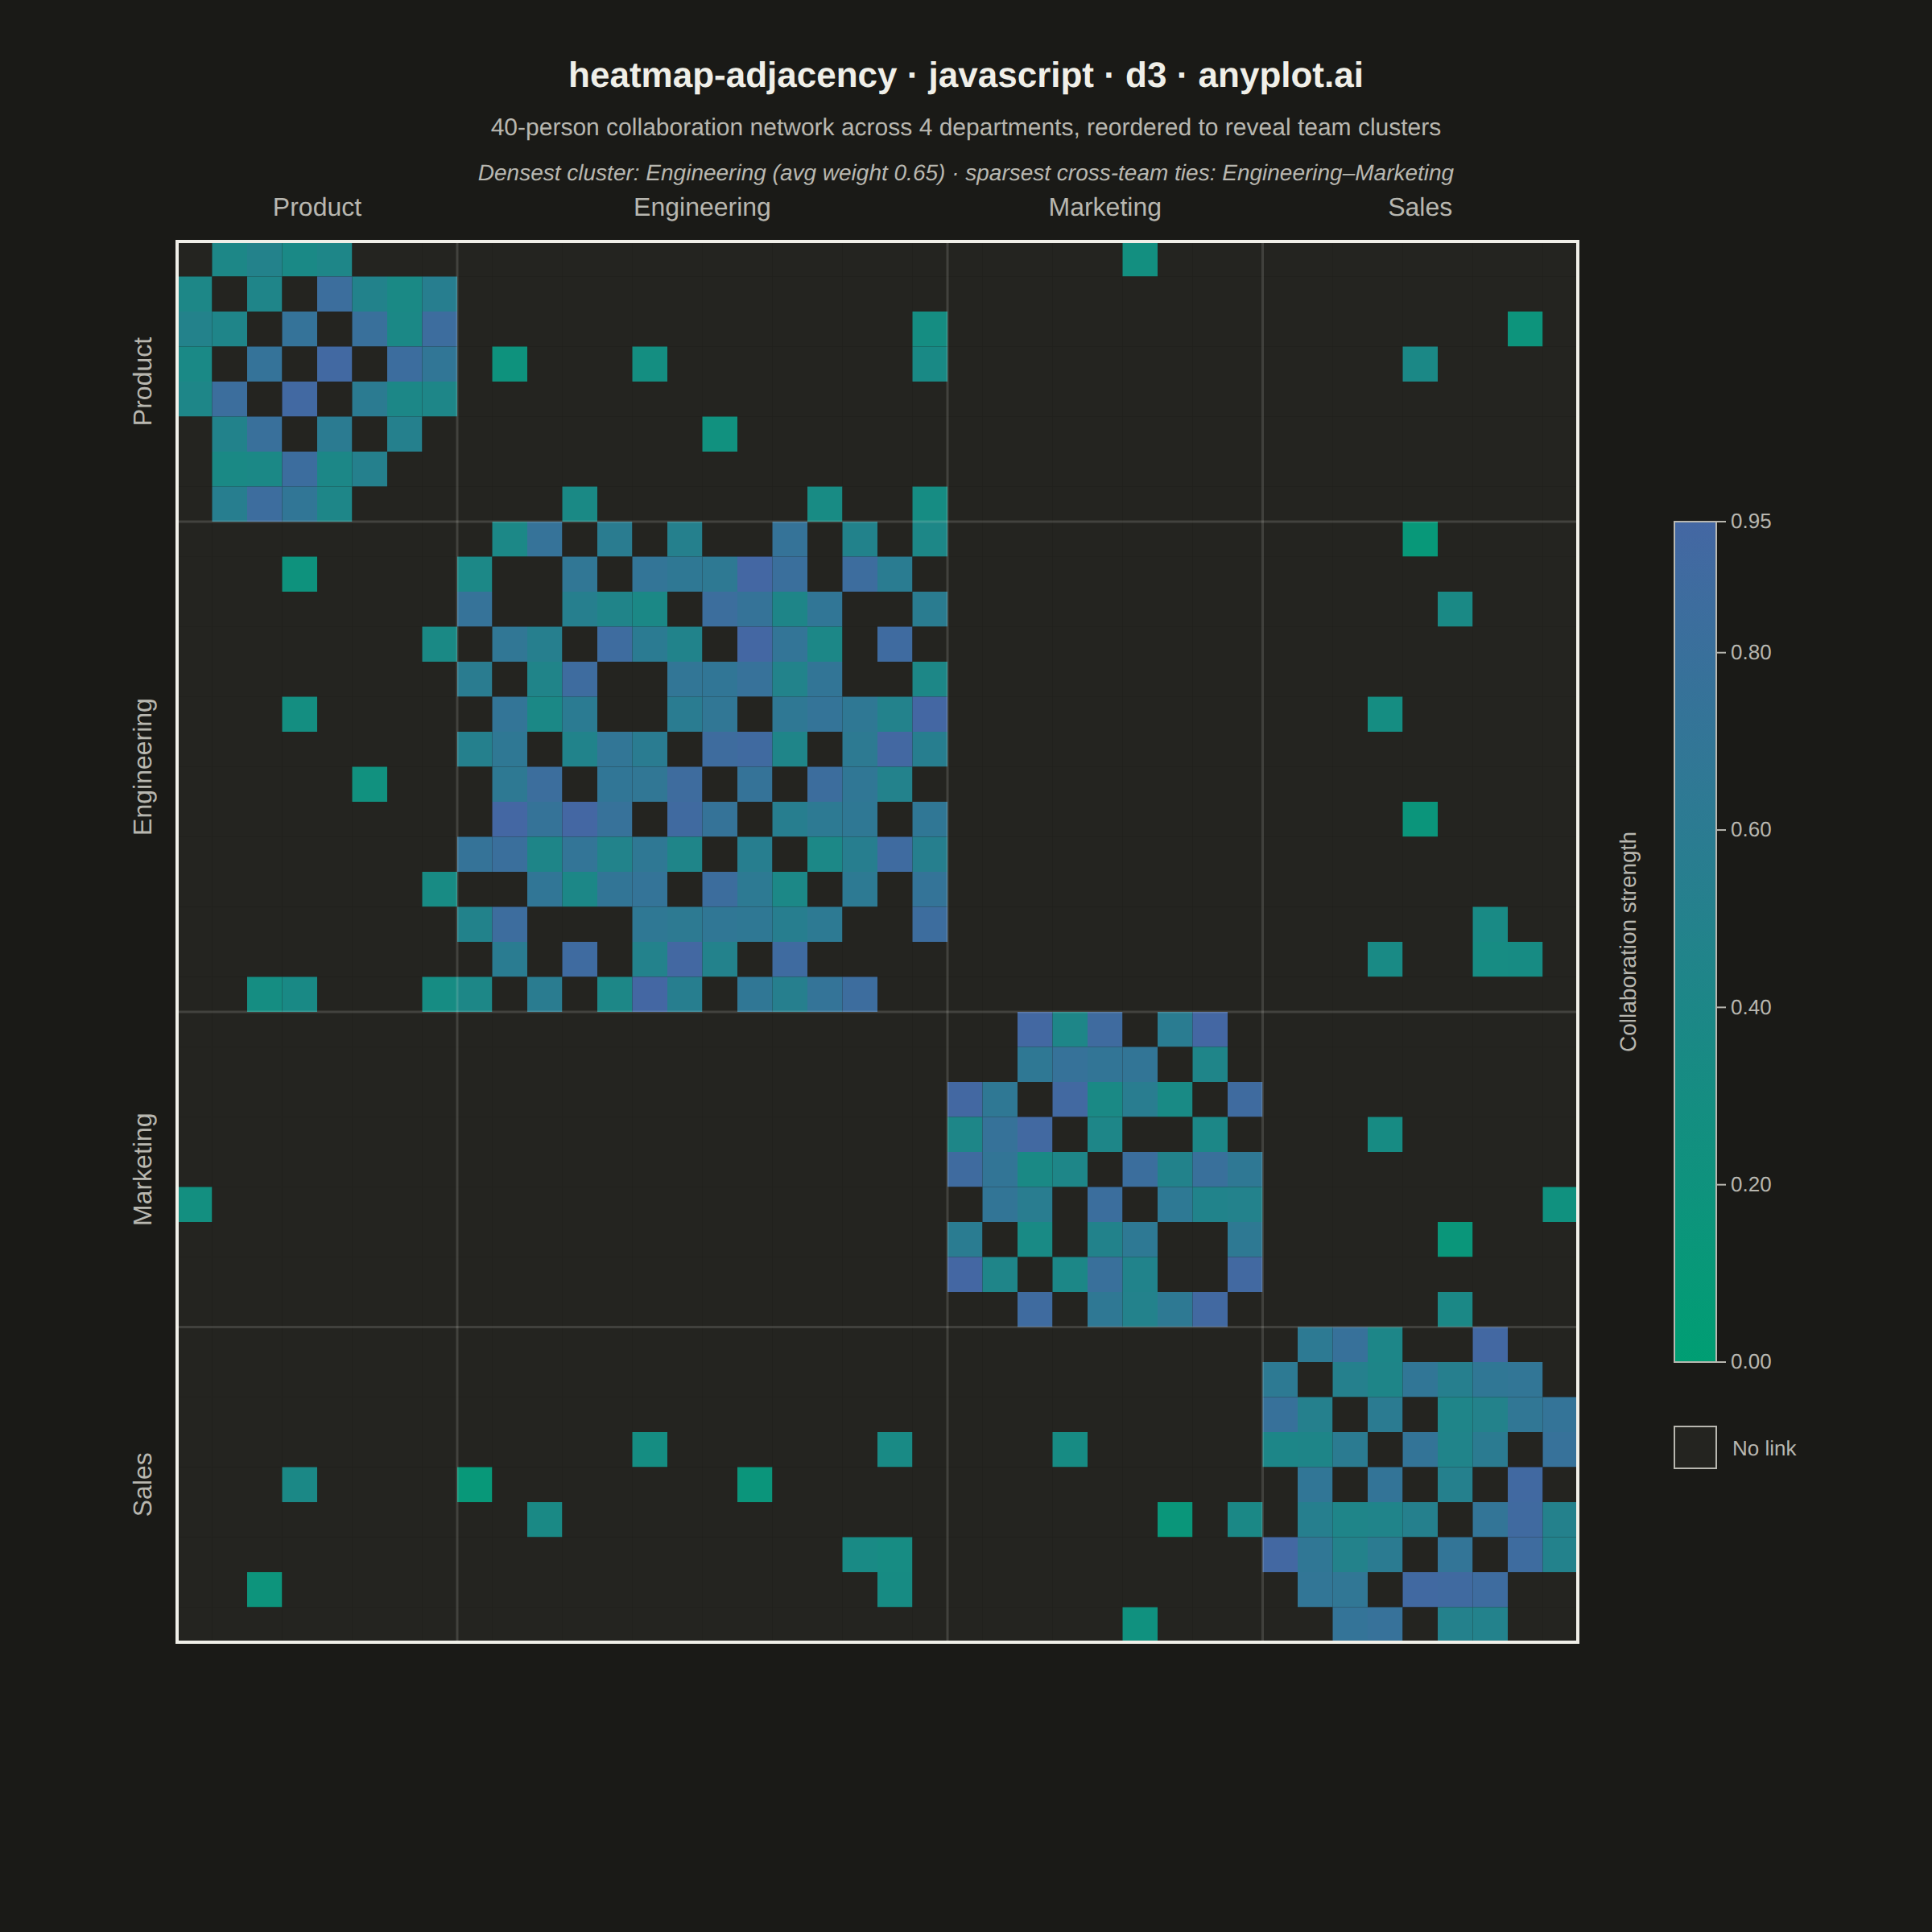
The same plot in 14 other libraries — JavaScript: Chart.js, Apache ECharts, Highcharts, MUI X Charts; Python: Altair, Bokeh, lets-plot, Matplotlib, Plotly, plotnine, Pygal, Seaborn; R: ggplot2; Julia: Makie.jl. Compare all 15 side by side: Network Adjacency Matrix Heatmap in Python, R, Julia and JavaScript.
A matrix-based representation of a network or graph where rows and columns represent nodes and cell color indicates the presence or weight of edges between them. This visualization complements node-link diagrams by excelling at revealing clusters, structural patterns, and density in large or dense networks where node-link layouts become cluttered. Reordering nodes by cluster, degree, or community membership exposes block-diagonal structure and makes group boundaries immediately visible.
// anyplot.ai
// heatmap-adjacency: Network Adjacency Matrix Heatmap
// Library: d3 7.9.0 | JavaScript 22.23.2
// Quality: 88/100 | Created: 2026-09-05
//# anyplot-orientation: square

const t = window.ANYPLOT_TOKENS;
const { width, height } = window.ANYPLOT_SIZE;

// --- Deterministic PRNG (LCG, no seeded Math.random in the browser) --------
let seed = 42;
function rand() {
  seed = (seed * 1664525 + 1013904223) % 4294967296;
  return seed / 4294967296;
}

// --- Data: workplace collaboration network, grouped by department ----------
// Nodes are ordered by department so the block-diagonal structure (dense
// within-team collaboration, sparse cross-team ties) is visible without any
// reordering step.
const departments = [
  { name: "Product", size: 8 },
  { name: "Engineering", size: 14 },
  { name: "Marketing", size: 9 },
  { name: "Sales", size: 9 },
];
const nodes = [];
departments.forEach((dept) => {
  for (let i = 0; i < dept.size; i++) nodes.push({ department: dept.name });
});
const n = nodes.length;

// Symmetric weighted adjacency matrix; null = no collaboration recorded.
// Diagonal stays null (self-loops carry no information here).
const matrix = Array.from({ length: n }, () => new Array(n).fill(null));
for (let i = 0; i < n; i++) {
  for (let j = i + 1; j < n; j++) {
    const sameDept = nodes[i].department === nodes[j].department;
    let weight = null;
    if (sameDept) {
      if (rand() < 0.72) weight = 0.35 + rand() * 0.6;
    } else if (rand() < 0.05) {
      weight = 0.1 + rand() * 0.3;
    }
    matrix[i][j] = weight;
    matrix[j][i] = weight;
  }
}
const maxWeight = d3.max(matrix.flat().filter((v) => v !== null));

// Department block boundaries (node index ranges) for separators + labels.
let cursor = 0;
const blocks = departments.map((dept) => {
  const start = cursor;
  cursor += dept.size;
  return { name: dept.name, start, end: cursor, mid: start + dept.size / 2 };
});

// --- Insight: densest internal cluster + sparsest cross-team pair -----------
// A short reinforcing takeaway beyond "block-diagonal is visible".
const deptAvg = blocks.map((b) => {
  let sum = 0;
  let count = 0;
  for (let i = b.start; i < b.end; i++) {
    for (let j = b.start; j < b.end; j++) {
      if (i !== j && matrix[i][j] !== null) {
        sum += matrix[i][j];
        count++;
      }
    }
  }
  return { name: b.name, avg: count ? sum / count : 0 };
});
const densest = deptAvg.reduce((best, d) => (d.avg > best.avg ? d : best));

let sparsestPair = null;
for (let a = 0; a < blocks.length; a++) {
  for (let b = a + 1; b < blocks.length; b++) {
    const ba = blocks[a];
    const bb = blocks[b];
    let count = 0;
    for (let i = ba.start; i < ba.end; i++) {
      for (let j = bb.start; j < bb.end; j++) {
        if (matrix[i][j] !== null) count++;
      }
    }
    const density = count / ((ba.end - ba.start) * (bb.end - bb.start));
    if (!sparsestPair || density < sparsestPair.density) {
      sparsestPair = { a: ba.name, b: bb.name, density };
    }
  }
}

// --- SVG mount ---------------------------------------------------------------
const svg = d3.select("#container").append("svg").attr("width", width).attr("height", height);

// --- Layout -------------------------------------------------------------------
const margin = { top: 150, right: 220, bottom: 40, left: 110 };
const availW = width - margin.left - margin.right;
const availH = height - margin.top - margin.bottom;
const gridSize = Math.min(availW, availH);
const cell = gridSize / n;
const gridX = margin.left;
const gridY = margin.top;

// --- Color scale (Imprint sequential: brand green -> blue) ------------------
const color = d3.scaleSequential(d3.interpolateRgbBasis(t.seq)).domain([0, maxWeight]);

// --- Cells --------------------------------------------------------------------
const cellData = [];
for (let i = 0; i < n; i++) {
  for (let j = 0; j < n; j++) {
    cellData.push({ i, j, value: matrix[i][j] });
  }
}

svg
  .append("g")
  .selectAll("rect")
  .data(cellData)
  .join("rect")
  .attr("x", (d) => gridX + d.j * cell)
  .attr("y", (d) => gridY + d.i * cell)
  .attr("width", cell)
  .attr("height", cell)
  .attr("fill", (d) => (d.value === null ? t.elevatedBg : color(d.value)));

// --- Block separators (mark cluster / department boundaries) ----------------
// Kept subtle (t.grid, the 15%-alpha ink rule token) so only the outer frame
// reads at full ink weight, per the Imprint "subtle structural line" convention.
const separators = svg.append("g");
blocks.forEach((b) => {
  if (b.start === 0) return;
  const pos = gridX + b.start * cell;
  separators
    .append("line")
    .attr("x1", pos)
    .attr("x2", pos)
    .attr("y1", gridY)
    .attr("y2", gridY + gridSize)
    .attr("stroke", t.grid)
    .attr("stroke-width", 1.5);
  separators
    .append("line")
    .attr("x1", gridX)
    .attr("x2", gridX + gridSize)
    .attr("y1", gridY + b.start * cell)
    .attr("y2", gridY + b.start * cell)
    .attr("stroke", t.grid)
    .attr("stroke-width", 1.5);
});
// Outer frame around the full matrix.
separators
  .append("rect")
  .attr("x", gridX)
  .attr("y", gridY)
  .attr("width", gridSize)
  .attr("height", gridSize)
  .attr("fill", "none")
  .attr("stroke", t.ink)
  .attr("stroke-width", 2);

// --- Group boundary labels (node count too large for per-node ticks) -------
svg
  .append("g")
  .selectAll("text")
  .data(blocks)
  .join("text")
  .attr("x", (d) => gridX + d.mid * cell)
  .attr("y", gridY - 16)
  .attr("text-anchor", "middle")
  .attr("fill", t.inkSoft)
  .style("font-size", "16px")
  .text((d) => d.name);

svg
  .append("g")
  .selectAll("text")
  .data(blocks)
  .join("text")
  .attr("transform", (d) => `translate(${gridX - 16},${gridY + d.mid * cell}) rotate(-90)`)
  .attr("text-anchor", "middle")
  .attr("fill", t.inkSoft)
  .style("font-size", "16px")
  .text((d) => d.name);

// --- Colorbar legend (weight scale) ------------------------------------------
const legendX = gridX + gridSize + 60;
const legendW = 26;
const legendH = gridSize * 0.6;
const legendY = gridY + (gridSize - legendH) / 2;

const defs = svg.append("defs");
const gradient = defs
  .append("linearGradient")
  .attr("id", "weight-gradient")
  .attr("x1", "0%")
  .attr("x2", "0%")
  .attr("y1", "100%")
  .attr("y2", "0%");
// d3.quantize samples the interpolator at N evenly-spaced points in one call,
// avoiding a hand-rolled d3.range/offset loop for the gradient stops.
const stopColors = d3.quantize((tt) => color(tt * maxWeight), 11);
gradient
  .selectAll("stop")
  .data(stopColors)
  .join("stop")
  .attr("offset", (d, i) => `${(i / (stopColors.length - 1)) * 100}%`)
  .attr("stop-color", (d) => d);

svg
  .append("rect")
  .attr("x", legendX)
  .attr("y", legendY)
  .attr("width", legendW)
  .attr("height", legendH)
  .attr("fill", "url(#weight-gradient)")
  .attr("stroke", t.inkSoft)
  .attr("stroke-width", 1);

const legendScale = d3.scaleLinear().domain([0, maxWeight]).range([legendY + legendH, legendY]);
// Force a tick at the true data ceiling so the legend never appears to stop
// short of the actual max weight.
const legendTickValues = legendScale.ticks(4);
if (legendTickValues[legendTickValues.length - 1] < maxWeight * 0.97) {
  legendTickValues.push(maxWeight);
}
const legendAxis = d3.axisRight(legendScale).tickValues(legendTickValues).tickFormat(d3.format(".2f"));
const legendAxisG = svg
  .append("g")
  .attr("transform", `translate(${legendX + legendW},0)`)
  .call(legendAxis);
legendAxisG.selectAll("text").attr("fill", t.inkSoft).style("font-size", "13px");
legendAxisG.selectAll("line").attr("stroke", t.inkSoft);
legendAxisG.select(".domain").attr("stroke", t.inkSoft);

svg
  .append("text")
  .attr("transform", `translate(${legendX - 24},${legendY + legendH / 2}) rotate(-90)`)
  .attr("text-anchor", "middle")
  .attr("fill", t.inkSoft)
  .style("font-size", "14px")
  .text("Collaboration strength");

// No-data swatch, to disambiguate the near-background fill from a low weight.
const swatchY = legendY + legendH + 40;
svg
  .append("rect")
  .attr("x", legendX)
  .attr("y", swatchY)
  .attr("width", legendW)
  .attr("height", legendW)
  .attr("fill", t.elevatedBg)
  .attr("stroke", t.inkSoft)
  .attr("stroke-width", 1);
svg
  .append("text")
  .attr("x", legendX + legendW + 10)
  .attr("y", swatchY + legendW / 2 + 5)
  .attr("fill", t.inkSoft)
  .style("font-size", "13px")
  .text("No link");

// --- Title --------------------------------------------------------------------
svg
  .append("text")
  .attr("x", width / 2)
  .attr("y", 54)
  .attr("text-anchor", "middle")
  .attr("fill", t.ink)
  .style("font-size", "22px")
  .style("font-weight", "600")
  .text("heatmap-adjacency · javascript · d3 · anyplot.ai");

svg
  .append("text")
  .attr("x", width / 2)
  .attr("y", 84)
  .attr("text-anchor", "middle")
  .attr("fill", t.inkSoft)
  .style("font-size", "15px")
  .text(`${n}-person collaboration network across 4 departments, reordered to reveal team clusters`);

svg
  .append("text")
  .attr("x", width / 2)
  .attr("y", 112)
  .attr("text-anchor", "middle")
  .attr("fill", t.inkSoft)
  .style("font-size", "14px")
  .style("font-style", "italic")
  .text(
    `Densest cluster: ${densest.name} (avg weight ${densest.avg.toFixed(2)}) · sparsest cross-team ties: ${sparsestPair.a}–${sparsestPair.b}`,
  );
Runnable source as JSON, for any HTTP client: https://api.anyplot.ai/specs/heatmap-adjacency/d3/code. Any spec id and library id listed in llms-full.txt fit the same URL shape; every URL below is complete and callable.
{
  "spec_id": "heatmap-adjacency",
  "language": "javascript",
  "library": "d3",
  "page": "https://anyplot.ai/heatmap-adjacency/javascript/d3",
  "hub": "https://anyplot.ai/heatmap-adjacency",
  "code_json": "https://api.anyplot.ai/specs/heatmap-adjacency/d3/code",
  "spec_json": "https://api.anyplot.ai/specs/heatmap-adjacency",
  "render_light_png": "https://storage.googleapis.com/anyplot-images/plots/heatmap-adjacency/javascript/d3/plot-light.png",
  "render_dark_png": "https://storage.googleapis.com/anyplot-images/plots/heatmap-adjacency/javascript/d3/plot-dark.png",
  "interactive_light_html": "https://storage.googleapis.com/anyplot-images/plots/heatmap-adjacency/javascript/d3/plot-light.html",
  "interactive_dark_html": "https://storage.googleapis.com/anyplot-images/plots/heatmap-adjacency/javascript/d3/plot-dark.html",
  "quality_score": 88.0,
  "license": "MIT",
  "guide": "https://anyplot.ai/llms.txt"
}
Part of Network Adjacency Matrix Heatmap on anyplot.ai.