The same plot in 14 other libraries — JavaScript: Chart.js, D3.js, Apache ECharts, Highcharts; Python: Altair, Bokeh, lets-plot, Matplotlib, Plotly, plotnine, Pygal, Seaborn; R: ggplot2; Julia: Makie.jl. Compare all 15 side by side: Network Adjacency Matrix Heatmap in Python, R, Julia and JavaScript.
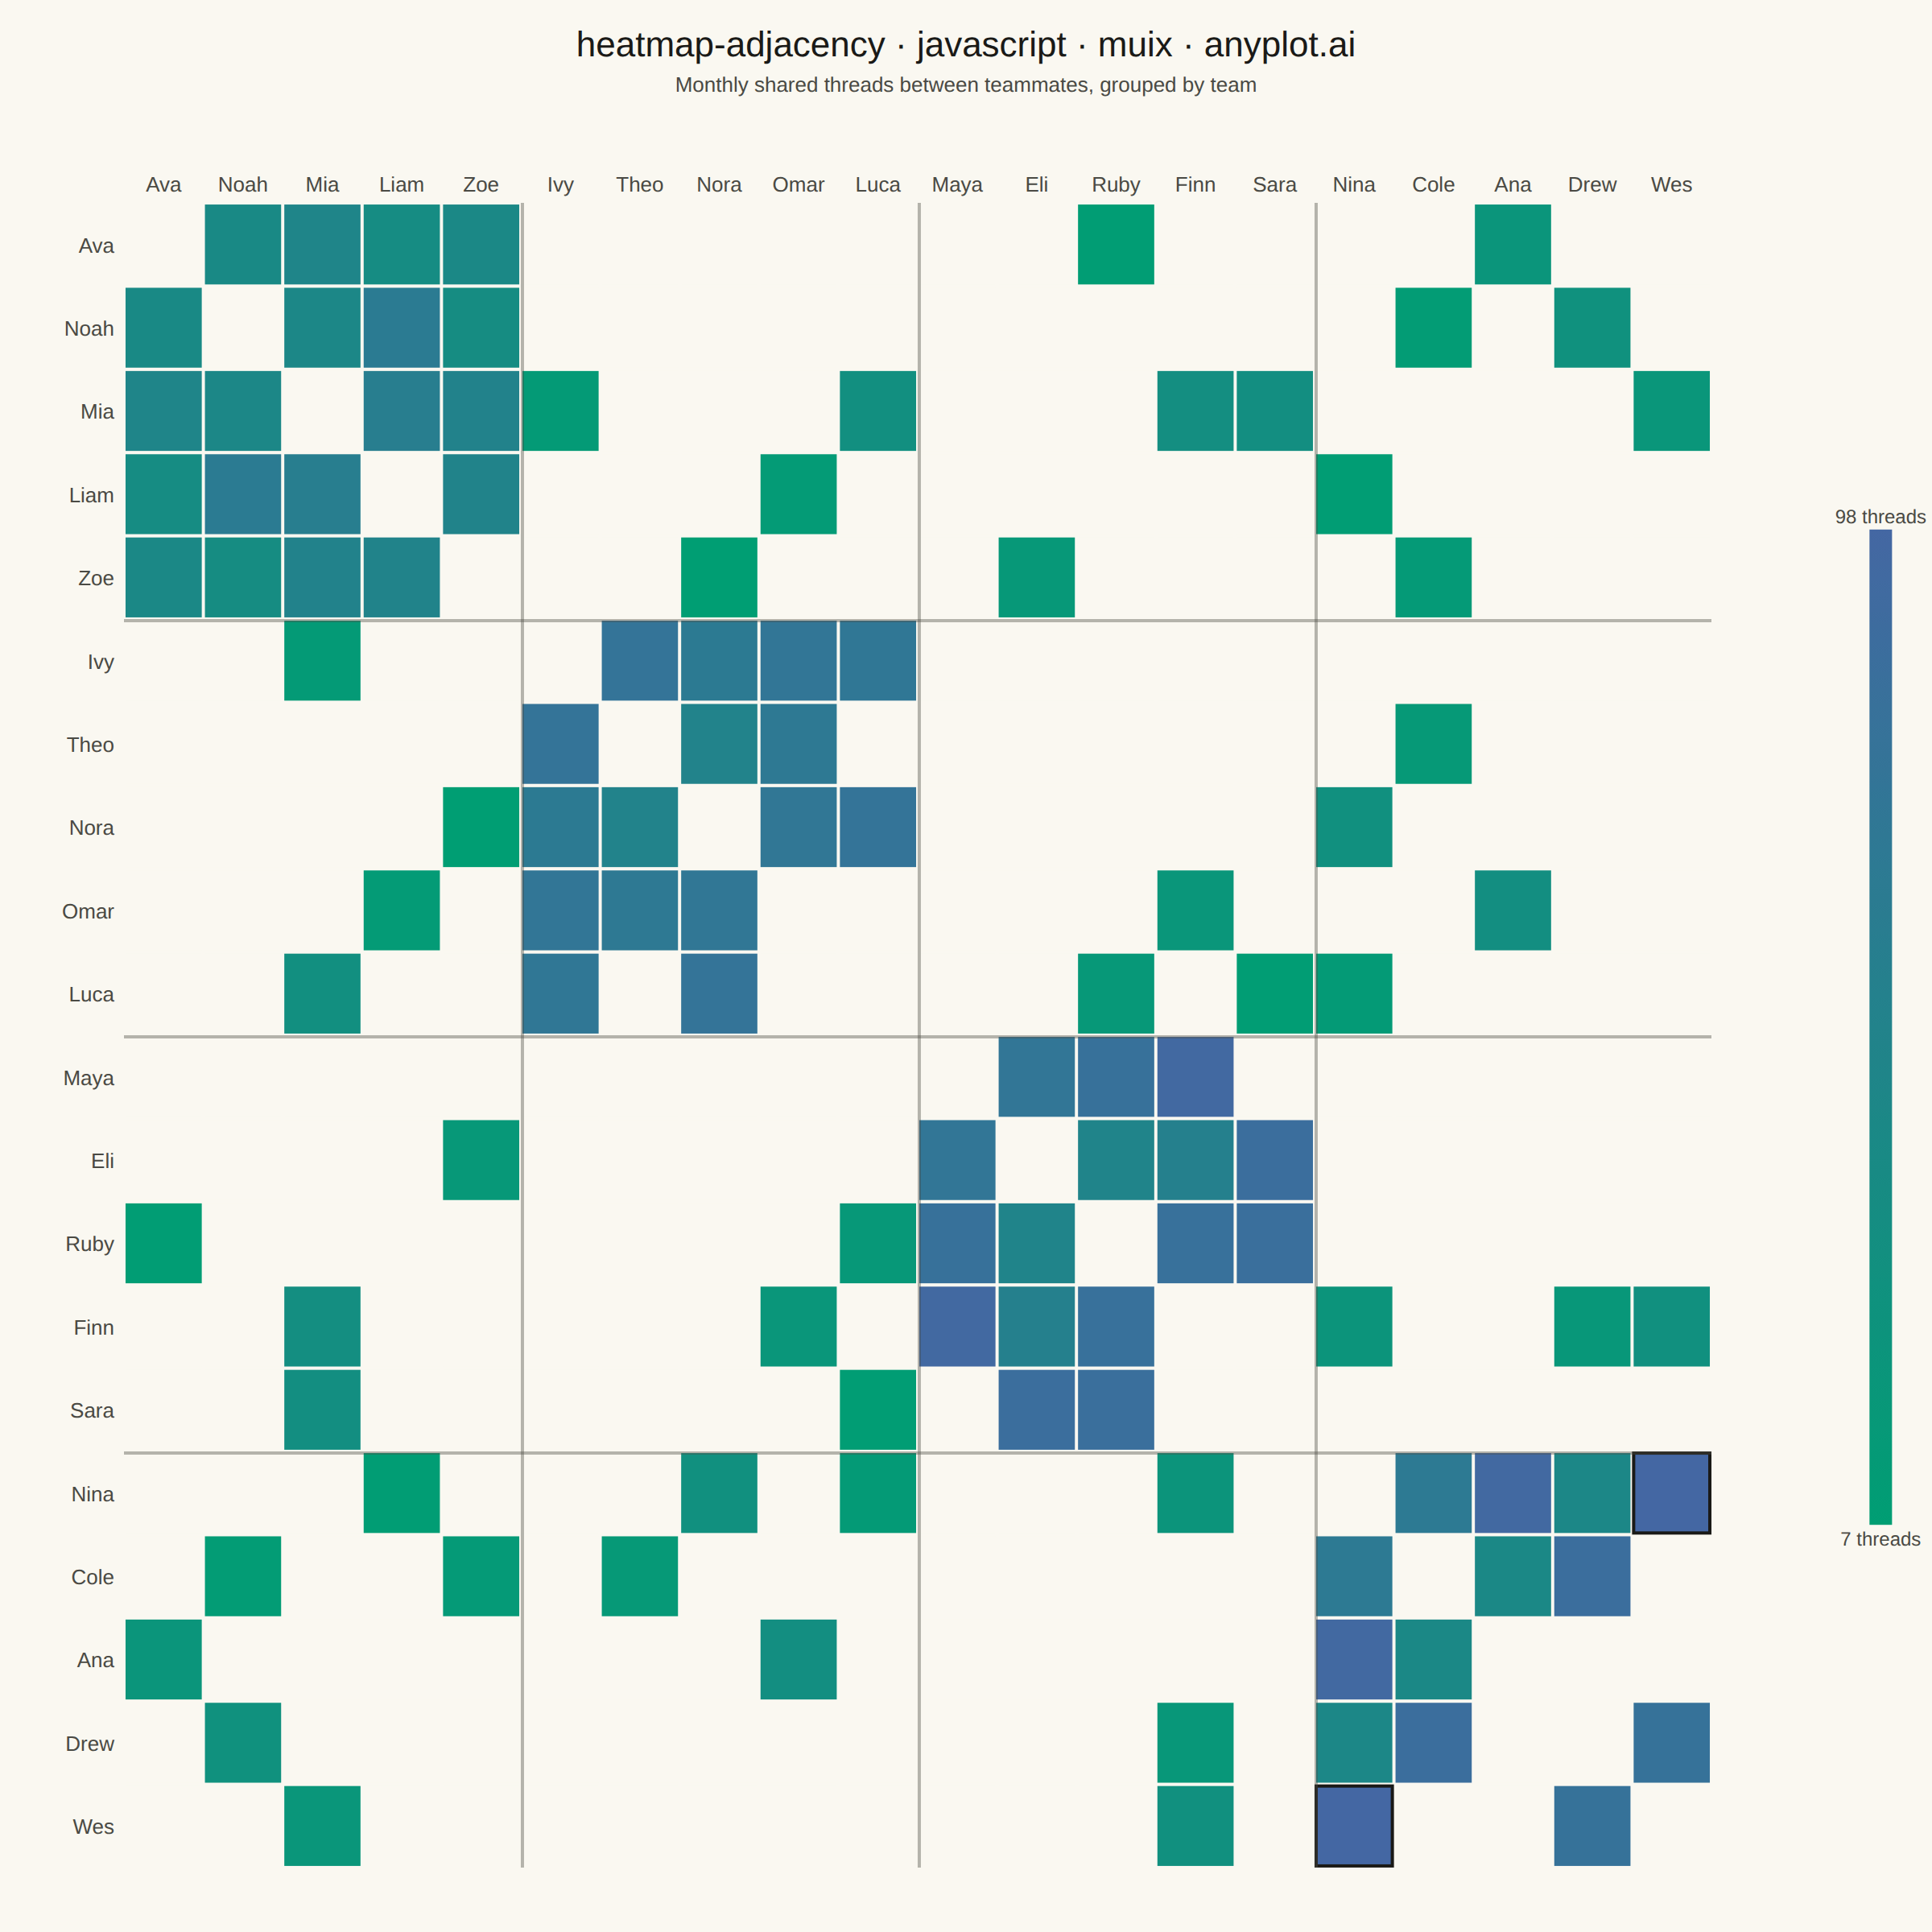
A matrix-based representation of a network or graph where rows and columns represent nodes and cell color indicates the presence or weight of edges between them. This visualization complements node-link diagrams by excelling at revealing clusters, structural patterns, and density in large or dense networks where node-link layouts become cluttered. Reordering nodes by cluster, degree, or community membership exposes block-diagonal structure and makes group boundaries immediately visible.
// anyplot.ai
// heatmap-adjacency: Network Adjacency Matrix Heatmap
// Library: muix 7.29.1 | JavaScript 22.23.2
// Quality: 95/100 | Created: 2026-09-05
//# anyplot-orientation: square
// anyplot.ai
// heatmap-adjacency: Network Adjacency Matrix Heatmap
// Library: MUI X Charts | React | Node 22
// License: @mui/x-charts — MIT (community). Pro/Premium are out of scope.
// Quality: pending | Created: 2026-09-05

import Box from "@mui/material/Box";
import Typography from "@mui/material/Typography";
import { ScatterChart } from "@mui/x-charts/ScatterChart";
import { ContinuousColorLegend } from "@mui/x-charts/ChartsLegend";
import { useXScale, useYScale, useDrawingArea } from "@mui/x-charts/hooks";

const tokens = window.ANYPLOT_TOKENS;

// --- Data (in-memory, deterministic) — cross-team collaboration network ----
// A fixed-seed LCG replaces the browser's non-reproducible Math.random().
function lcg(seed) {
  let s = seed >>> 0;
  return () => {
    s = (Math.imul(1664525, s) + 1013904223) >>> 0;
    return s / 4294967295;
  };
}
const random = lcg(42);

const teams = [
  { name: "Engineering", members: ["Ava", "Noah", "Mia", "Liam", "Zoe"] },
  { name: "Design", members: ["Ivy", "Theo", "Nora", "Omar", "Luca"] },
  { name: "Product", members: ["Maya", "Eli", "Ruby", "Finn", "Sara"] },
  { name: "Marketing", members: ["Nina", "Cole", "Ana", "Drew", "Wes"] },
];
const names = teams.flatMap((team) => team.members);
const clusterSize = teams[0].members.length;
const nodeCount = names.length;

// Edge weight = shared Slack threads/docs per month. Same-team pairs link
// often and strongly; cross-team pairs link rarely and weakly — this is what
// makes the community structure visible as darker diagonal blocks.
const weights = Array.from({ length: nodeCount }, () => new Array(nodeCount).fill(0));
for (let i = 0; i < nodeCount; i += 1) {
  for (let j = i + 1; j < nodeCount; j += 1) {
    const sameTeam = Math.floor(i / clusterSize) === Math.floor(j / clusterSize);
    const linkRoll = random();
    let weight = 0;
    if (sameTeam && linkRoll < 0.85) {
      weight = Math.round(35 + random() * 65);
    } else if (!sameTeam && linkRoll < 0.22) {
      weight = Math.round(5 + random() * 30);
    }
    weights[i][j] = weight;
    weights[j][i] = weight;
  }
}

// Full matrix — both triangles filled, since the underlying graph is
// undirected (a diagonal stays 0: no self-collaboration edges).
const points = [];
for (let row = 0; row < nodeCount; row += 1) {
  for (let col = 0; col < nodeCount; col += 1) {
    points.push({ id: `${row}-${col}`, x: names[col], y: names[row], z: weights[row][col] });
  }
}

const edgeWeights = weights.flat().filter((w) => w > 0);
const minWeight = Math.min(...edgeWeights);
const maxWeight = Math.max(...edgeWeights);

// Custom marker: filled square matrix cells instead of the default circles.
// Absent edges (z === 0) render as the plain page background — visually
// distinct from every real, colored edge — rather than the palest color step.
function AdjacencyCell(props) {
  const { series, xScale, yScale, colorGetter, color } = props;
  const cellWidth = xScale.bandwidth();
  const cellHeight = yScale.bandwidth();

  return (
    <g>
      {series.data.map((point, i) => {
        const x0 = xScale(point.x) ?? 0;
        const y0 = yScale(point.y) ?? 0;
        const fill = point.z > 0 ? (colorGetter ? colorGetter(i) : color) : tokens.pageBg;
        const isTopLink = point.z === maxWeight;
        return (
          <rect
            key={point.id}
            x={x0}
            y={y0}
            width={cellWidth}
            height={cellHeight}
            fill={fill}
            stroke={isTopLink ? tokens.ink : "none"}
            strokeWidth={isTopLink ? 2 : 0}
          />
        );
      })}
    </g>
  );
}

// Ink-soft dividers at team boundaries (drawn at low opacity, distinct from
// both the colored edges and the blank/absent-edge background) so the
// block-diagonal cluster structure reads at a glance.
function ClusterBoundaries() {
  const xScale = useXScale("col");
  const yScale = useYScale("row");
  const drawingArea = useDrawingArea();
  const marks = [];
  for (let k = clusterSize; k < nodeCount; k += clusterSize) {
    const bx = xScale(names[k]) ?? 0;
    const by = yScale(names[k]) ?? 0;
    marks.push(
      <line
        key={`v-${k}`}
        x1={bx}
        y1={drawingArea.top}
        x2={bx}
        y2={drawingArea.top + drawingArea.height}
        stroke={tokens.inkSoft}
        strokeOpacity={0.4}
        strokeWidth={2}
      />,
      <line
        key={`h-${k}`}
        x1={drawingArea.left}
        y1={by}
        x2={drawingArea.left + drawingArea.width}
        y2={by}
        stroke={tokens.inkSoft}
        strokeOpacity={0.4}
        strokeWidth={2}
      />,
    );
  }
  return <g>{marks}</g>;
}

export default function Chart() {
  const { width, height } = window.ANYPLOT_SIZE;
  const TITLE_HEIGHT = 76;
  const MARGIN_TOP = 50;
  const MARGIN_LEFT = 70;
  const MARGIN_RIGHT = 130;
  const MARGIN_BOTTOM = 40;

  const LEGEND_EDGE_PADDING = 14;
  const chartWidth = width - LEGEND_EDGE_PADDING;
  const chartHeight = height - TITLE_HEIGHT;

  return (
    <Box sx={{ width, height, bgcolor: tokens.pageBg, display: "flex", flexDirection: "column" }}>
      <Box sx={{ height: TITLE_HEIGHT, display: "flex", flexDirection: "column", justifyContent: "center", alignItems: "center" }}>
        <Typography sx={{ color: tokens.ink, fontSize: 22, fontWeight: 500, lineHeight: 1.2, fontFamily: "inherit" }}>
          heatmap-adjacency · javascript · muix · anyplot.ai
        </Typography>
        <Typography sx={{ color: tokens.inkSoft, fontSize: 13, lineHeight: 1.2, fontFamily: "inherit", pt: "4px" }}>
          Monthly shared threads between teammates, grouped by team
        </Typography>
      </Box>
      <Box sx={{ flex: 1, display: "flex", alignItems: "flex-start", justifyContent: "flex-start" }}>
        <ScatterChart
          width={chartWidth}
          height={chartHeight}
          skipAnimation
          disableVoronoi
          series={[
            {
              id: "collaboration",
              type: "scatter",
              data: points,
              label: "Collaboration weight",
              xAxisId: "col",
              yAxisId: "row",
              zAxisId: "weight",
            },
          ]}
          xAxis={[
            {
              id: "col",
              scaleType: "band",
              data: names,
              categoryGapRatio: 0.04,
              tickLabelStyle: { fontSize: 13, fill: tokens.inkSoft },
              disableTicks: true,
              disableLine: true,
            },
          ]}
          yAxis={[
            {
              id: "row",
              scaleType: "band",
              data: names,
              categoryGapRatio: 0.04,
              tickLabelStyle: { fontSize: 13, fill: tokens.inkSoft },
              disableTicks: true,
              disableLine: true,
            },
          ]}
          zAxis={[
            {
              id: "weight",
              min: minWeight,
              max: maxWeight,
              colorMap: { type: "continuous", min: minWeight, max: maxWeight, color: [tokens.seq[0], tokens.seq[1]] },
            },
          ]}
          topAxis="col"
          bottomAxis={null}
          leftAxis="row"
          rightAxis={null}
          margin={{ top: MARGIN_TOP, right: MARGIN_RIGHT, bottom: MARGIN_BOTTOM, left: MARGIN_LEFT }}
          slots={{ scatter: AdjacencyCell }}
          slotProps={{ legend: { hidden: true } }}
        >
          <ClusterBoundaries />
          <ContinuousColorLegend
            axisId="weight"
            axisDirection="z"
            position={{ horizontal: "right", vertical: "middle" }}
            direction="column"
            length="55%"
            thickness={14}
            minLabel={({ formattedValue }) => `${formattedValue} threads`}
            maxLabel={({ formattedValue }) => `${formattedValue} threads`}
            labelStyle={{ fontSize: 12, fill: tokens.inkSoft, fontFamily: "inherit" }}
          />
        </ScatterChart>
      </Box>
    </Box>
  );
}
Runnable source as JSON, for any HTTP client: https://api.anyplot.ai/specs/heatmap-adjacency/muix/code. Any spec id and library id listed in llms-full.txt fit the same URL shape; every URL below is complete and callable.
{
  "spec_id": "heatmap-adjacency",
  "language": "javascript",
  "library": "muix",
  "page": "https://anyplot.ai/heatmap-adjacency/javascript/muix",
  "hub": "https://anyplot.ai/heatmap-adjacency",
  "code_json": "https://api.anyplot.ai/specs/heatmap-adjacency/muix/code",
  "spec_json": "https://api.anyplot.ai/specs/heatmap-adjacency",
  "render_light_png": "https://storage.googleapis.com/anyplot-images/plots/heatmap-adjacency/javascript/muix/plot-light.png",
  "render_dark_png": "https://storage.googleapis.com/anyplot-images/plots/heatmap-adjacency/javascript/muix/plot-dark.png",
  "interactive_light_html": "https://storage.googleapis.com/anyplot-images/plots/heatmap-adjacency/javascript/muix/plot-light.html",
  "interactive_dark_html": "https://storage.googleapis.com/anyplot-images/plots/heatmap-adjacency/javascript/muix/plot-dark.html",
  "quality_score": 95.0,
  "license": "MIT",
  "guide": "https://anyplot.ai/llms.txt"
}
Part of Network Adjacency Matrix Heatmap on anyplot.ai.