The same plot in 14 other libraries — JavaScript: D3.js, Apache ECharts, Highcharts, MUI X Charts; Python: Altair, Bokeh, lets-plot, Matplotlib, Plotly, plotnine, Pygal, Seaborn; R: ggplot2; Julia: Makie.jl. Compare all 15 side by side: Basic Calendar Heatmap in Python, R, Julia and JavaScript.
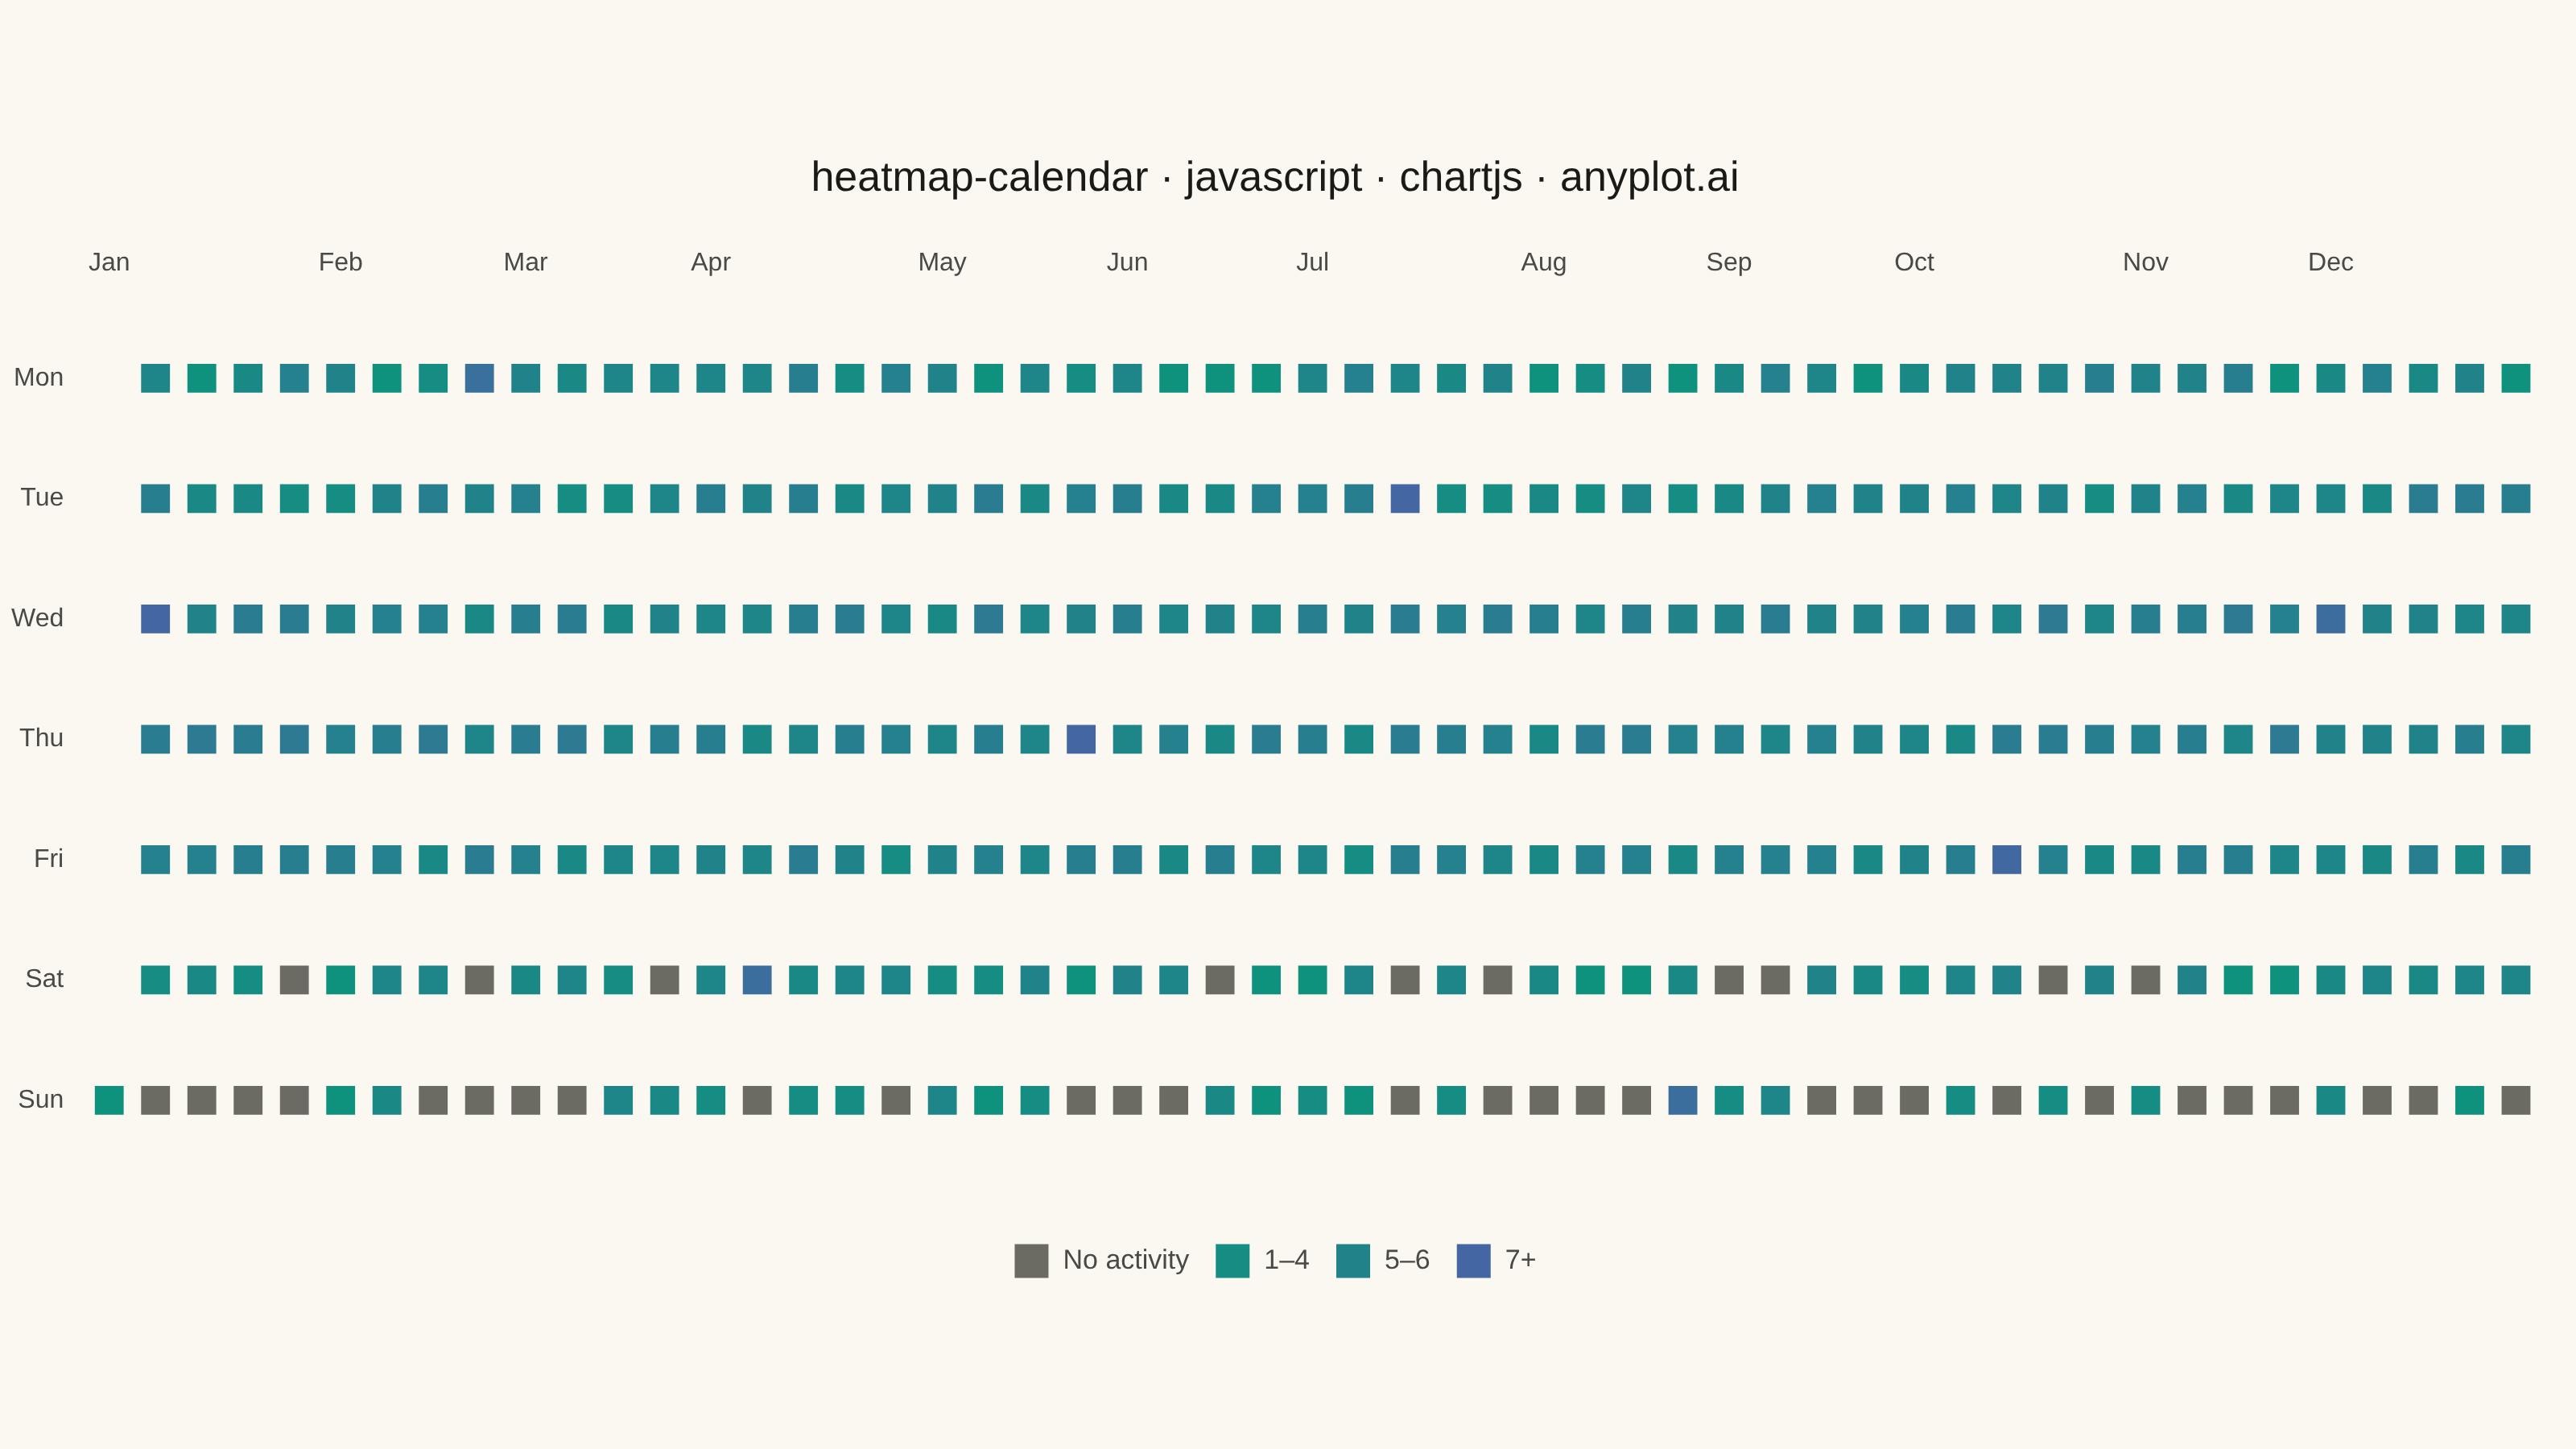
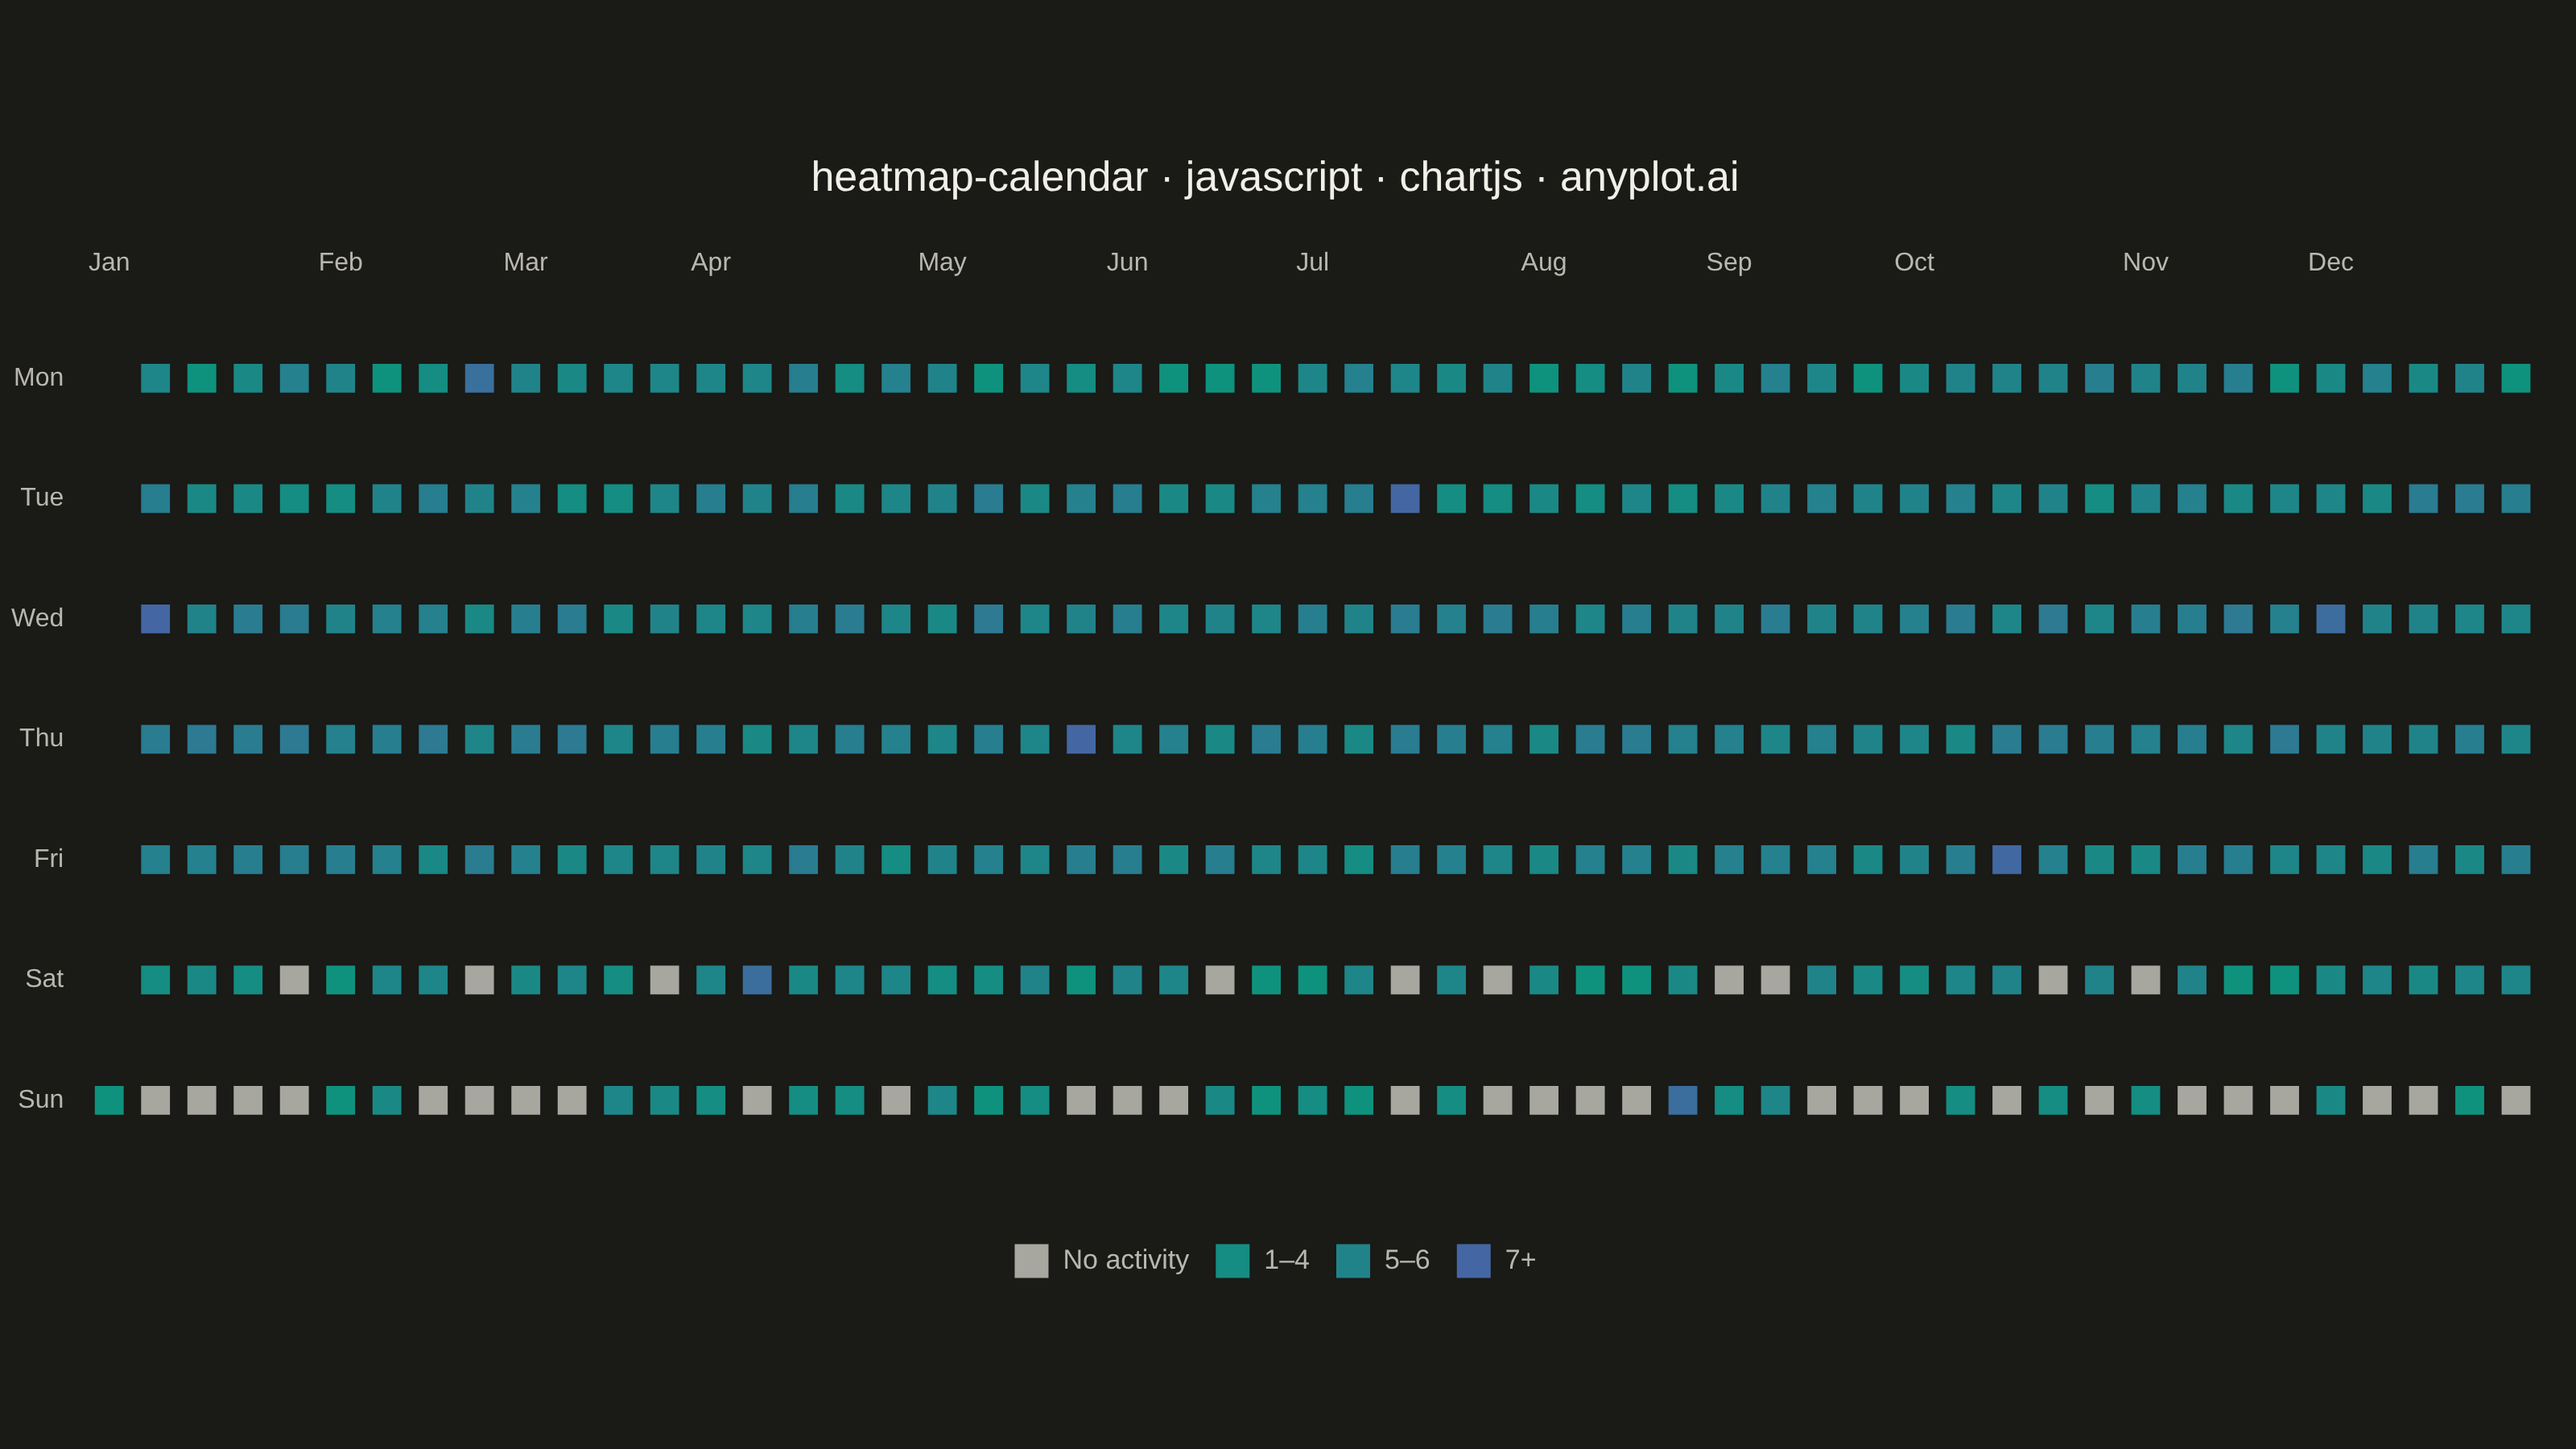
A calendar heatmap visualizes time-series data on a calendar grid, where each day is represented as a cell and color intensity indicates the value magnitude. The layout follows a calendar structure with days as cells, weekdays as rows, weeks as columns, and months as labeled sections along the top. This visualization excels at revealing daily patterns, seasonal trends, and temporal anomalies over extended time periods.
// anyplot.ai
// heatmap-calendar: Basic Calendar Heatmap
// Library: chartjs 4.4.7 | JavaScript 22.23.1
// Quality: 80/100 | Updated: 2026-07-24

//# anyplot-orientation: landscape
const t = window.ANYPLOT_TOKENS;
// Semantic "muted" anchor (other/rest/no-activity) — theme-adaptive, not part
// of window.ANYPLOT_TOKENS, so it's derived here per prompts/default-style-guide.md.
const MUTED = t.theme === "dark" ? "#A8A79F" : "#6B6A63";

// --- Data (in-memory, deterministic) ----------------------------------------
// Daily coding-commit counts across a full year, GitHub-contribution-graph style.
let seed = 42;
function nextRandom() {
  seed = (seed * 1103515245 + 12345) & 0x7fffffff;
  return seed / 0x7fffffff;
}

const YEAR = 2023;
const startDate = new Date(Date.UTC(YEAR, 0, 1));
const startWeekday = (startDate.getUTCDay() + 6) % 7; // Monday = 0 ... Sunday = 6
const weekdayLabels = ["Mon", "Tue", "Wed", "Thu", "Fri", "Sat", "Sun"];
const monthLabels = [
  "Jan", "Feb", "Mar", "Apr", "May", "Jun",
  "Jul", "Aug", "Sep", "Oct", "Nov", "Dec",
];
const weekdayBaseline = [4, 5, 6, 6, 5, 2, 1]; // Mon..Sun commit baseline

const days = [];
for (let i = 0; i < 365; i++) {
  const date = new Date(startDate.getTime() + i * 86400000);
  const weekday = (date.getUTCDay() + 6) % 7;
  const week = Math.floor((i + startWeekday) / 7);
  let value = Math.round(weekdayBaseline[weekday] + (nextRandom() - 0.5) * 6);
  if (i % 47 === 3) value += 14; // occasional hackathon burst
  value = Math.max(0, value);
  days.push({ date, week, weekday, value });
}
const weekCount = days[days.length - 1].week + 1;

// --- Month tick positions (first week each month first appears) ------------
const monthTicks = [];
const seenMonths = new Set();
for (const day of days) {
  const monthKey = day.date.getUTCMonth();
  if (!seenMonths.has(monthKey)) {
    seenMonths.add(monthKey);
    monthTicks.push({ week: day.week, label: monthLabels[monthKey] });
  }
}
const monthLabelAt = Object.fromEntries(monthTicks.map((m) => [m.week, m.label]));

// --- Sequential color mapping (Imprint imprint_seq: brand green -> blue) ---
function hexToRgb(hex) {
  const n = parseInt(hex.slice(1), 16);
  return [(n >> 16) & 255, (n >> 8) & 255, n & 255];
}
function rgbToHex([r, g, b]) {
  return (
    "#" +
    [r, g, b].map((v) => Math.round(v).toString(16).padStart(2, "0")).join("")
  );
}
const [seqR1, seqG1, seqB1] = hexToRgb(t.seq[0]);
const [seqR2, seqG2, seqB2] = hexToRgb(t.seq[1]);
function seqColor(frac) {
  return rgbToHex([
    seqR1 + (seqR2 - seqR1) * frac,
    seqG1 + (seqG2 - seqG1) * frac,
    seqB1 + (seqB2 - seqB1) * frac,
  ]);
}

const maxValue = Math.max(...days.map((d) => d.value));
function colorForValue(value) {
  if (value === 0) return MUTED;
  return seqColor(Math.min(1, Math.sqrt(value / maxValue)));
}

// --- Legend bins (data-driven, matches the sequential scale) ---------------
const nonZeroSorted = days
  .map((d) => d.value)
  .filter((v) => v > 0)
  .sort((a, b) => a - b);
const quantile = (p) => nonZeroSorted[Math.floor(p * (nonZeroSorted.length - 1))];
const q1 = quantile(0.33);
const q2 = quantile(0.66);
const legendBins = [
  { label: "No activity", color: MUTED },
  { label: `1–${q1}`, color: colorForValue(Math.max(1, Math.round(q1 / 2))) },
  { label: `${q1 + 1}–${q2}`, color: colorForValue(Math.round((q1 + q2) / 2)) },
  { label: `${q2 + 1}+`, color: colorForValue(maxValue) },
];

// --- Compact-grid layout plugin ---------------------------------------------
// Chart.js gives the y scale the *entire* leftover chartArea height
// (chartArea.bottom - chartArea.top) no matter how few data rows it holds —
// with only 7 weekday rows and 53 columns, shrinking all the way down to
// bare square cells (px-per-row == px-per-week) leaves the grid a thin,
// isolated island in a mostly-empty canvas. Right after layout:
//  1. Grow the row pitch well past the bare square-cell height so the grid
//     consumes most of the reclaimed vertical space -- cells stay square
//     (sized by column width in the pointRadius callback below) but rows
//     get generous breathing room between them -- then pull the legend up
//     to sit close under the grid instead of pinned to the canvas bottom.
//  2. Re-center the whole title/grid/legend block vertically in the canvas,
//     so the composition reads as an intentionally spacious layout rather
//     than a small block adrift in empty space.
const compactGrid = {
  id: "compactGrid",
  afterLayout(chart) {
    const { x, y } = chart.scales;
    const legend = chart.legend;
    const title = chart.titleBlock;
    if (!x || !y) return;
    const pxPerWeek = Math.abs(x.getPixelForValue(1) - x.getPixelForValue(0));
    const squareHeight = (y.max - y.min) * pxPerWeek; // bare square-cell height
    const available = y.bottom - y.top; // full leftover space before shrink
    const gridHeight = Math.min(available * 0.72, squareHeight * 2.6);

    y.top += 6; // small breathing room under the month labels
    y.bottom = y.top + gridHeight;
    chart.chartArea.top = y.top;
    chart.chartArea.bottom = y.bottom;
    // top/bottom alone don't affect pixel conversion — LinearScale caches
    // _startPixel/_length in configure() during layout, so it must be
    // re-run for the new box to actually move the drawn points/ticks.
    y.configure();

    if (legend) {
      const legendHeight = legend.bottom - legend.top;
      legend.top = y.bottom + 28;
      legend.bottom = legend.top + legendHeight;
    }

    if (title && legend) {
      const blockTop = title.top;
      const blockBottom = legend.bottom;
      const shiftDown = (chart.height - (blockBottom - blockTop)) / 2 - blockTop;
      if (shiftDown > 0) {
        title.top += shiftDown;
        title.bottom += shiftDown;
        x.top += shiftDown;
        x.bottom += shiftDown;
        y.top += shiftDown;
        y.bottom += shiftDown;
        chart.chartArea.top += shiftDown;
        chart.chartArea.bottom += shiftDown;
        legend.top += shiftDown;
        legend.bottom += shiftDown;
        y.configure();
      }
    }
  },
};

// --- Mount -------------------------------------------------------------------
const canvas = document.createElement("canvas");
document.getElementById("container").appendChild(canvas);

// --- Chart ---------------------------------------------------------------
const dateFormatter = new Intl.DateTimeFormat("en-US", {
  month: "short",
  day: "numeric",
  year: "numeric",
  timeZone: "UTC",
});

new Chart(canvas, {
  type: "scatter",
  plugins: [compactGrid],
  data: {
    datasets: [
      {
        label: "Commits",
        data: days.map((d) => ({ x: d.week, y: d.weekday, v: d.value, date: d.date })),
        showLine: false,
        pointStyle: "rect",
        pointBackgroundColor: (ctx) => colorForValue(ctx.raw.v),
        pointBorderColor: t.pageBg,
        pointBorderWidth: 1,
        pointRadius: (ctx) => {
          const scale = ctx.chart.scales;
          if (!scale.x || !scale.y) return 8;
          const pxPerWeek = Math.abs(scale.x.getPixelForValue(1) - scale.x.getPixelForValue(0));
          const pxPerDay = Math.abs(scale.y.getPixelForValue(1) - scale.y.getPixelForValue(0));
          return Math.max(3, Math.min(pxPerWeek, pxPerDay) / 2 - 1);
        },
      },
    ],
  },
  options: {
    responsive: true,
    maintainAspectRatio: false,
    animation: false,
    layout: { padding: { top: 4, right: 20, bottom: 4, left: 4 } },
    plugins: {
      title: {
        display: true,
        text: "heatmap-calendar · javascript · chartjs · anyplot.ai",
        color: t.ink,
        font: { size: 26, weight: "500" },
        padding: { bottom: 24 },
      },
      legend: {
        display: true,
        position: "bottom",
        onClick: () => {},
        labels: {
          color: t.inkSoft,
          font: { size: 17 },
          boxWidth: 22,
          boxHeight: 22,
          padding: 16,
          generateLabels: () =>
            // A subtle page-background stroke (matching the cell borders)
            // sharpens the visual step between adjacent same-hue bins.
            // Chart.js's legend draw step reads `legendItem.fontColor` (not
            // `options.labels.color`) for the text fillStyle, so custom
            // generateLabels() must set it explicitly or the text falls
            // back to an uninitialized near-black canvas fillStyle.
            legendBins.map((bin) => ({
              text: bin.label,
              fillStyle: bin.color,
              fontColor: t.inkSoft,
              strokeStyle: t.pageBg,
              lineWidth: 1,
            })),
        },
      },
      tooltip: {
        callbacks: {
          title: () => "",
          label: (ctx) => `${dateFormatter.format(ctx.raw.date)}: ${ctx.raw.v} commits`,
        },
      },
    },
    scales: {
      x: {
        type: "linear",
        position: "top",
        min: -0.6,
        max: weekCount - 0.4,
        afterBuildTicks: (axis) => {
          axis.ticks = monthTicks.map((m) => ({ value: m.week }));
        },
        ticks: {
          callback: (value) => monthLabelAt[value] ?? "",
          color: t.inkSoft,
          font: { size: 16 },
        },
        grid: { display: false },
        border: { display: false },
      },
      y: {
        type: "linear",
        reverse: true,
        min: -0.6,
        max: 6.6,
        afterBuildTicks: (axis) => {
          axis.ticks = weekdayLabels.map((_, i) => ({ value: i }));
        },
        ticks: {
          callback: (value) => weekdayLabels[value] ?? "",
          color: t.inkSoft,
          font: { size: 16 },
        },
        grid: { display: false },
        border: { display: false },
      },
    },
  },
});
Runnable source as JSON, for any HTTP client: https://api.anyplot.ai/specs/heatmap-calendar/chartjs/code. Any spec id and library id listed in llms-full.txt fit the same URL shape; every URL below is complete and callable.
{
  "spec_id": "heatmap-calendar",
  "language": "javascript",
  "library": "chartjs",
  "page": "https://anyplot.ai/heatmap-calendar/javascript/chartjs",
  "hub": "https://anyplot.ai/heatmap-calendar",
  "code_json": "https://api.anyplot.ai/specs/heatmap-calendar/chartjs/code",
  "spec_json": "https://api.anyplot.ai/specs/heatmap-calendar",
  "render_light_png": "https://storage.googleapis.com/anyplot-images/plots/heatmap-calendar/javascript/chartjs/plot-light.png",
  "render_dark_png": "https://storage.googleapis.com/anyplot-images/plots/heatmap-calendar/javascript/chartjs/plot-dark.png",
  "interactive_light_html": "https://storage.googleapis.com/anyplot-images/plots/heatmap-calendar/javascript/chartjs/plot-light.html",
  "interactive_dark_html": "https://storage.googleapis.com/anyplot-images/plots/heatmap-calendar/javascript/chartjs/plot-dark.html",
  "quality_score": 80.0,
  "license": "MIT",
  "guide": "https://anyplot.ai/llms.txt"
}
Part of Basic Calendar Heatmap on anyplot.ai.