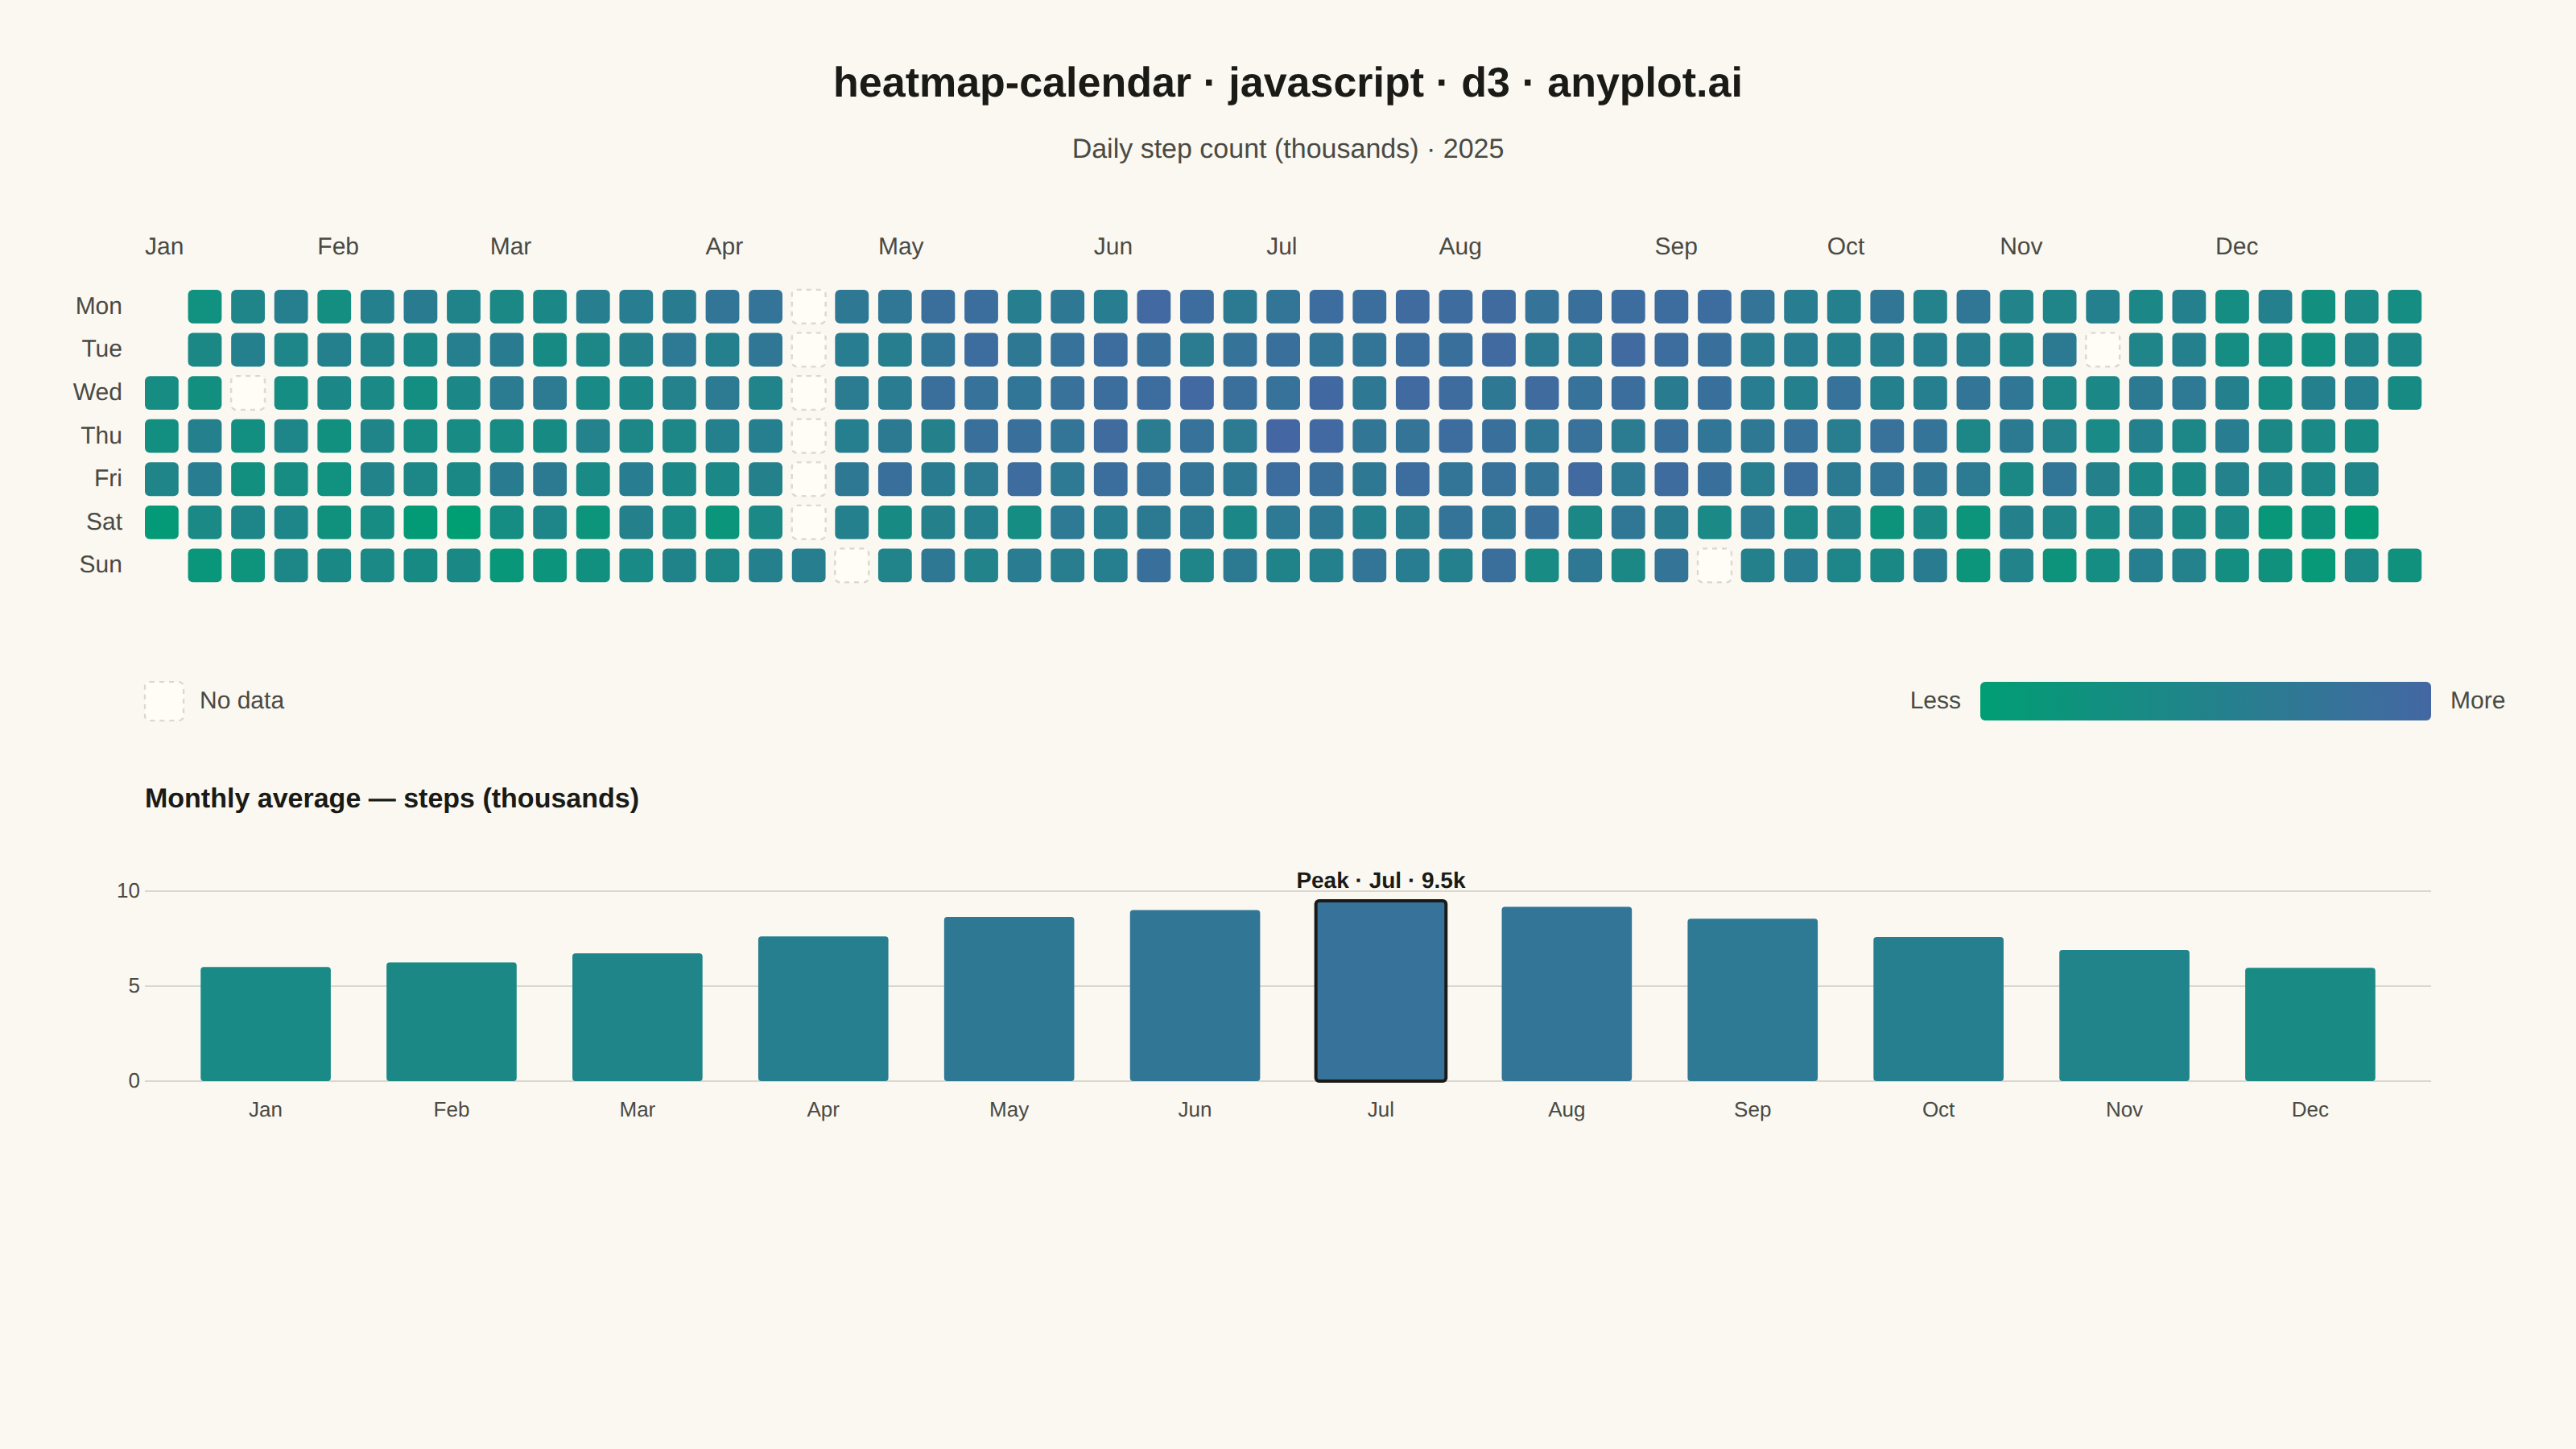
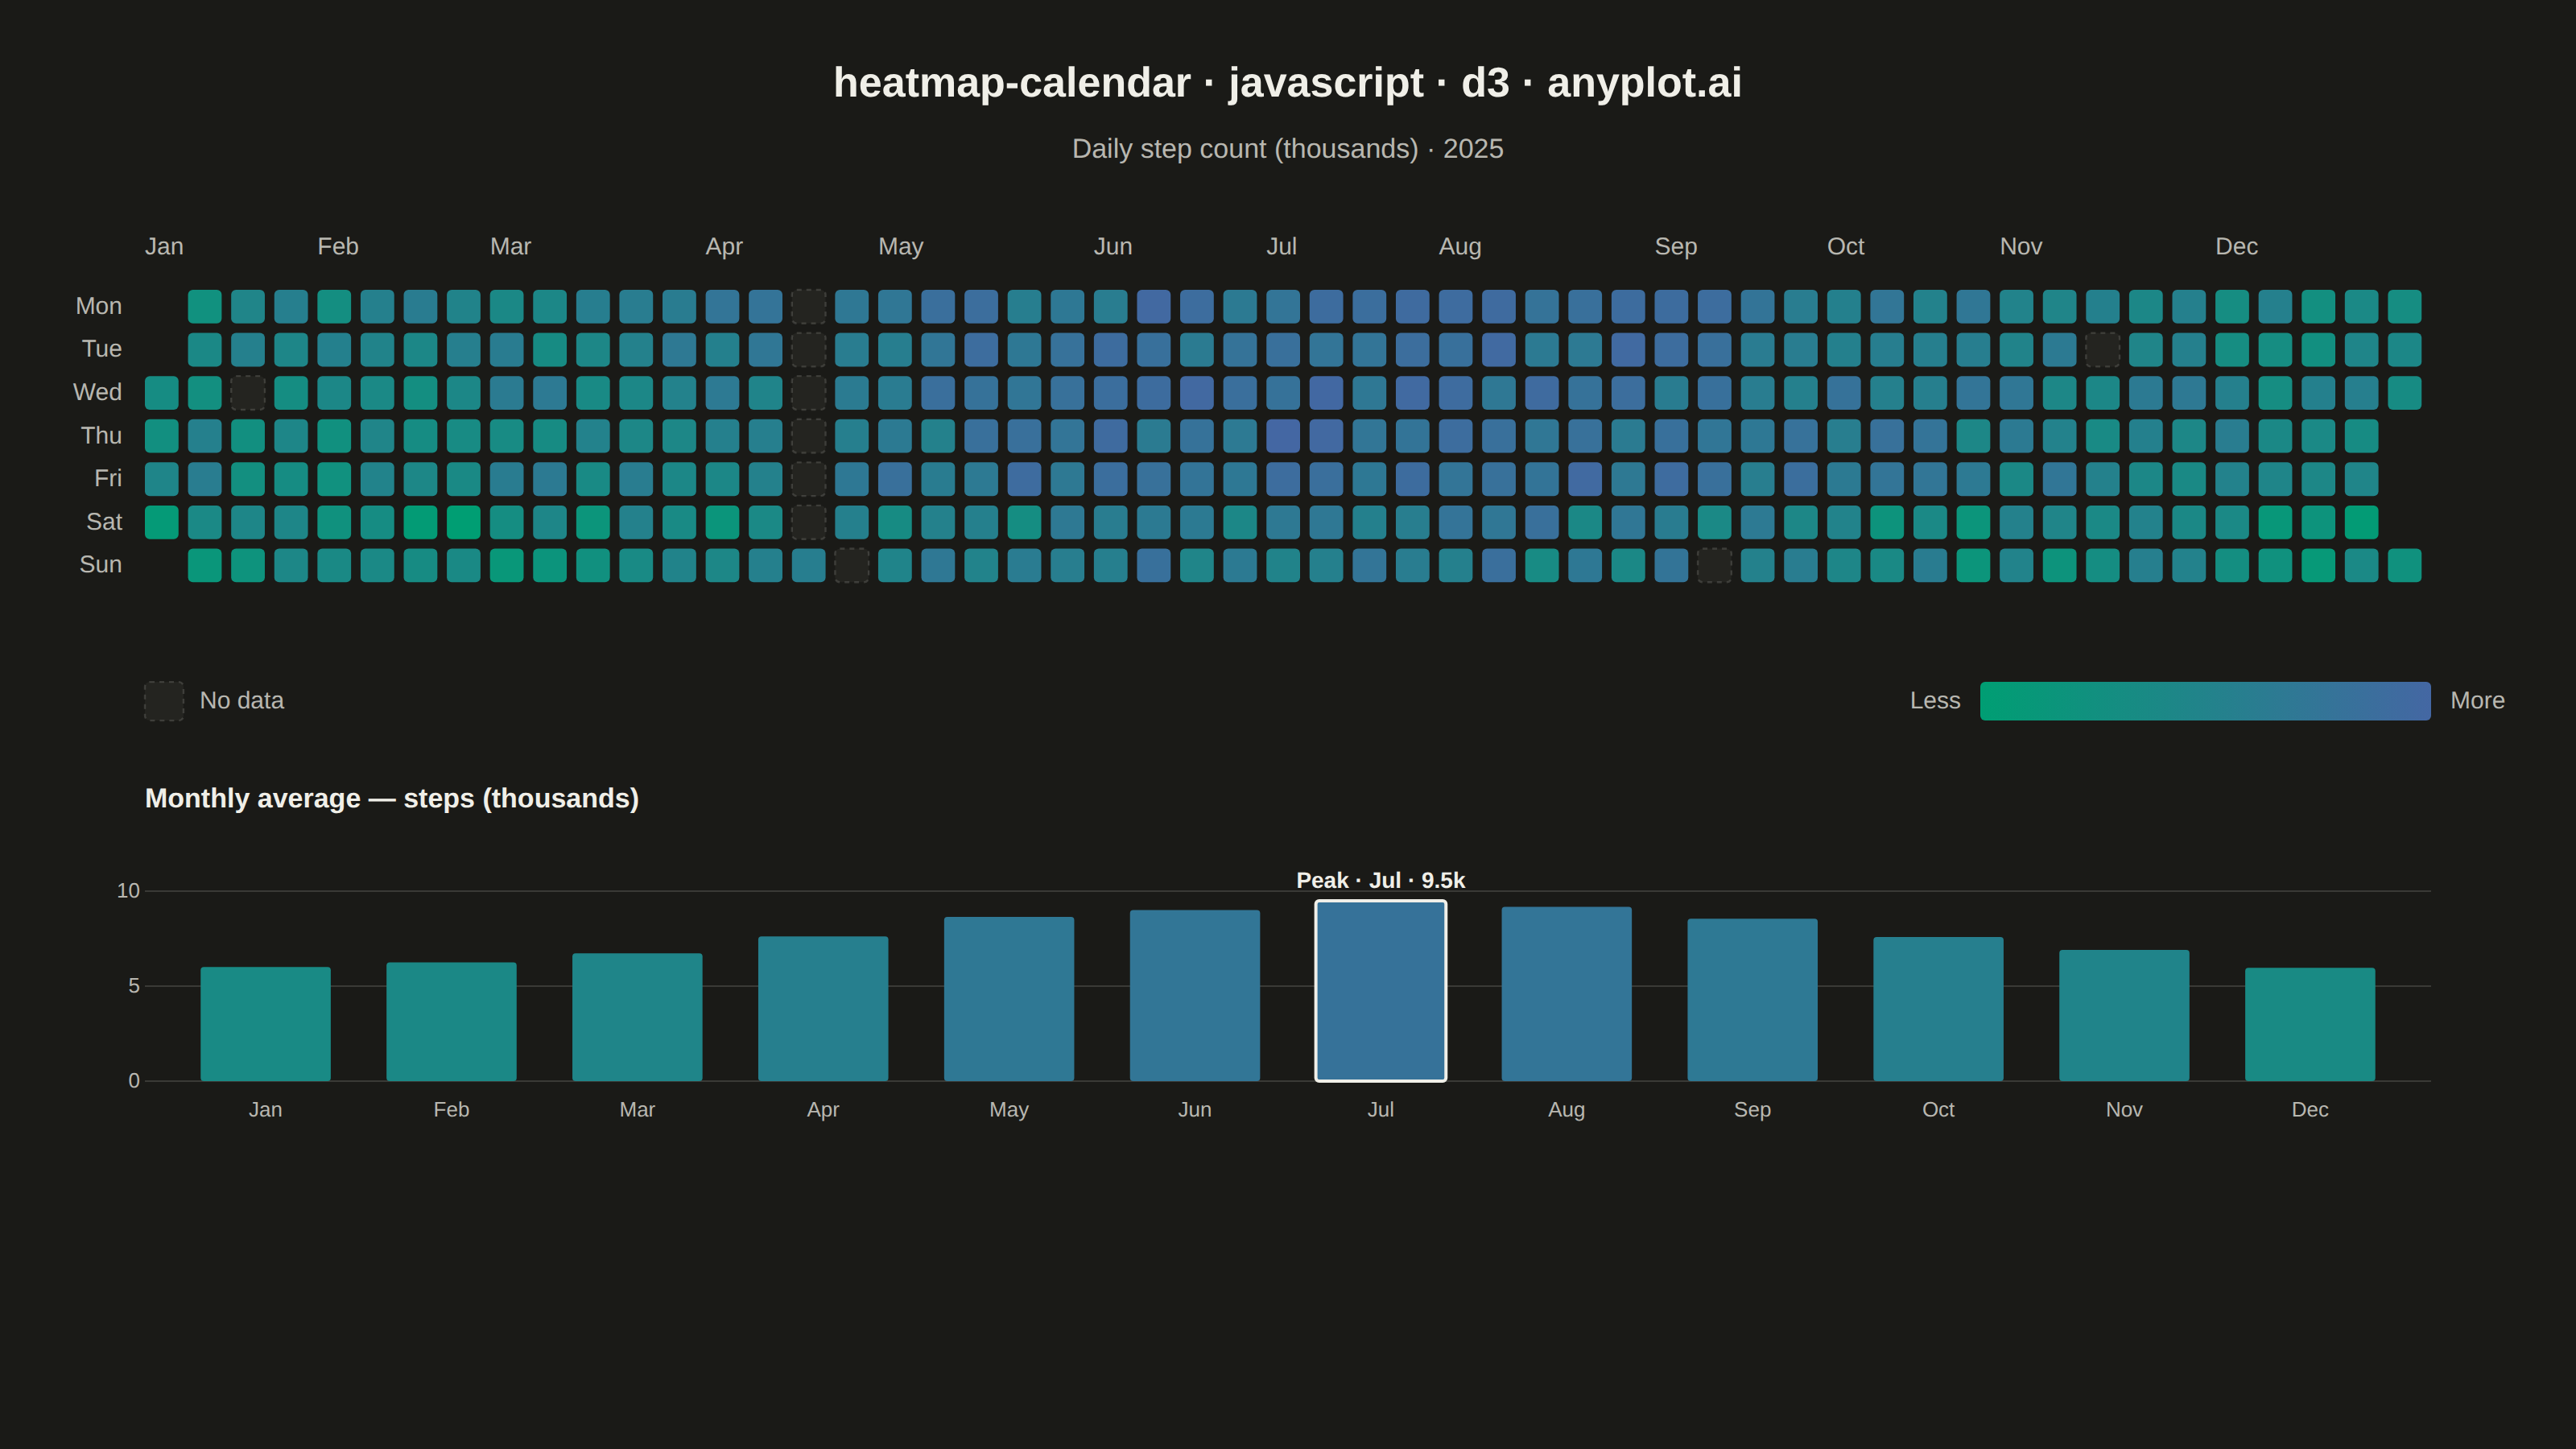
The same plot in 14 other libraries — JavaScript: Chart.js, Apache ECharts, Highcharts, MUI X Charts; Python: Altair, Bokeh, lets-plot, Matplotlib, Plotly, plotnine, Pygal, Seaborn; R: ggplot2; Julia: Makie.jl. Compare all 15 side by side: Basic Calendar Heatmap in Python, R, Julia and JavaScript.
A calendar heatmap visualizes time-series data on a calendar grid, where each day is represented as a cell and color intensity indicates the value magnitude. The layout follows a calendar structure with days as cells, weekdays as rows, weeks as columns, and months as labeled sections along the top. This visualization excels at revealing daily patterns, seasonal trends, and temporal anomalies over extended time periods.
// anyplot.ai
// heatmap-calendar: Basic Calendar Heatmap
// Library: d3 7.9.0 | JavaScript 22.23.1
// Quality: 93/100 | Created: 2026-07-23

const t = window.ANYPLOT_TOKENS;
const { width, height } = window.ANYPLOT_SIZE;

// --- Tiny fixed-seed LCG (no seeded RNG in the browser) --------------------
let seed = 42;
const rand = () => {
  seed = (seed * 1664525 + 1013904223) % 4294967296;
  return seed / 4294967296;
};

// --- Data: daily step count (thousands) for 2025, with a handful of gaps ---
// where the tracker wasn't worn — a realistic "missing data" scenario.
const YEAR = 2025;
const yearStart = new Date(Date.UTC(YEAR, 0, 1));
const yearEnd = new Date(Date.UTC(YEAR + 1, 0, 1));
const monthName = d3.utcFormat("%b");

const isMissing = (date) => {
  const m = date.getUTCMonth();
  const d = date.getUTCDate();
  return (m === 3 && d >= 14 && d <= 20) || (m === 0 && d === 15) || (m === 8 && d === 7) || (m === 10 && d === 11);
};

// d3-time idiom for calendar-view layouts: Sunday-boundary week count gives the
// column, (getUTCDay()+6)%7 remaps Sunday=0 to a Monday-first row index.
const days = d3.utcDays(yearStart, yearEnd).map((date) => {
  const dayOfYear = d3.utcDay.count(yearStart, date);
  const isWeekend = date.getUTCDay() === 0 || date.getUTCDay() === 6;

  const seasonal = 1.7 * Math.sin((2 * Math.PI * (dayOfYear - 105)) / 365);
  const weekdayAdj = isWeekend ? -0.6 : 1.1;
  const noiseAmp = isWeekend ? 4.2 : 3.0;
  const noise = (rand() - 0.5) * noiseAmp;
  const value = Math.max(0.6, 7.0 + seasonal + weekdayAdj + noise);

  return {
    date,
    row: (date.getUTCDay() + 6) % 7, // 0=Mon .. 6=Sun
    col: d3.utcSunday.count(yearStart, date),
    value: isMissing(date) ? null : Math.round(value * 10) / 10,
  };
});
const numWeeks = d3.max(days, (d) => d.col) + 1;

const values = days.map((d) => d.value).filter((v) => v !== null);
const [minVal, maxVal] = d3.extent(values);

// --- Monthly averages (for the summary panel below the grid) --------------
const monthlyMeans = d3.rollup(
  days.filter((d) => d.value !== null),
  (v) => d3.mean(v, (d) => d.value),
  (d) => d.date.getUTCMonth(),
);
const monthly = d3.range(12).map((m) => ({ m, avg: monthlyMeans.get(m) ?? 0 }));
const peak = monthly.reduce((a, b) => (b.avg > a.avg ? b : a));

// --- Layout -----------------------------------------------------------------
const margin = { left: 90, right: 90 };
const iw = width - margin.left - margin.right;
const step = iw / numWeeks;
const cellSize = step * 0.78;

const titleY = 60;
const subtitleY = 98;
const monthLabelY = subtitleY + 60;
const gridTop = monthLabelY + 22;
const gridHeight = 7 * step;
const gridBottom = gridTop + gridHeight;

const legendY = gridBottom + 56;
const swatchSize = 24;
const legendBottom = legendY + swatchSize;

const sectionTitleY = legendBottom + 54;
const chartTop = sectionTitleY + 30;
const chartHeight = 140;
const chartBottom = chartTop + chartHeight;
const peakAnnotH = 22; // headroom above bars reserved for the "Peak" callout
const chartInnerTop = chartTop + peakAnnotH;
const xAxisLabelY = chartBottom + 22;

// --- SVG mount ------------------------------------------------------------
const svg = d3.select("#container").append("svg").attr("width", width).attr("height", height);

// --- Sequential color scale: Imprint seq (brand green → blue) -------------
const colorScale = d3.scaleSequential(d3.interpolateRgbBasis(t.seq)).domain([minVal, maxVal]);

// --- Calendar grid ----------------------------------------------------------
const g = svg.append("g").attr("transform", `translate(${margin.left},${gridTop})`);

g.selectAll(".cell")
  .data(days)
  .join("rect")
  .attr("class", "cell")
  .attr("x", (d) => d.col * step)
  .attr("y", (d) => d.row * step)
  .attr("width", cellSize)
  .attr("height", cellSize)
  .attr("rx", 3)
  .attr("fill", (d) => (d.value === null ? t.elevatedBg : colorScale(d.value)))
  .attr("stroke", (d) => (d.value === null ? t.grid : "none"))
  .attr("stroke-width", (d) => (d.value === null ? 1.2 : 0))
  .attr("stroke-dasharray", (d) => (d.value === null ? "3,3" : null));

// --- Weekday labels (y-axis, Mon..Sun) ---------------------------------
const weekdayNames = ["Mon", "Tue", "Wed", "Thu", "Fri", "Sat", "Sun"];
g.selectAll(".weekday-label")
  .data(weekdayNames)
  .join("text")
  .attr("class", "weekday-label")
  .attr("x", -14)
  .attr("y", (d, i) => i * step + cellSize / 2)
  .attr("text-anchor", "end")
  .attr("dominant-baseline", "central")
  .attr("fill", t.inkSoft)
  .style("font-size", "15px")
  .text((d) => d);

// --- Month labels (above the grid) --------------------------------------
const monthStarts = d3.range(12).map((m) => {
  const first = days.find((d) => d.date.getUTCMonth() === m && d.date.getUTCDate() === 1);
  return { name: monthName(Date.UTC(YEAR, m, 1)), col: first.col };
});

svg
  .selectAll(".month-label")
  .data(monthStarts)
  .join("text")
  .attr("class", "month-label")
  .attr("x", (d) => margin.left + d.col * step)
  .attr("y", monthLabelY)
  .attr("text-anchor", "start")
  .attr("fill", t.inkSoft)
  .style("font-size", "15px")
  .style("font-weight", "500")
  .text((d) => d.name);

// --- Legend: "no data" swatch + sequential gradient bar --------------------
svg
  .append("rect")
  .attr("x", margin.left)
  .attr("y", legendY)
  .attr("width", swatchSize)
  .attr("height", swatchSize)
  .attr("rx", 3)
  .attr("fill", t.elevatedBg)
  .attr("stroke", t.grid)
  .attr("stroke-width", 1.2)
  .attr("stroke-dasharray", "3,3");

svg
  .append("text")
  .attr("x", margin.left + swatchSize + 10)
  .attr("y", legendY + swatchSize / 2)
  .attr("dominant-baseline", "central")
  .attr("fill", t.inkSoft)
  .style("font-size", "15px")
  .text("No data");

const barW = 280;
const barH = swatchSize;
const barX = margin.left + iw - barW;

const defs = svg.append("defs");
const grad = defs
  .append("linearGradient")
  .attr("id", "calendar-seq")
  .attr("x1", "0%")
  .attr("y1", "0%")
  .attr("x2", "100%")
  .attr("y2", "0%");
[0, 25, 50, 75, 100].forEach((p) => {
  grad.append("stop").attr("offset", `${p}%`).attr("stop-color", colorScale(minVal + (p / 100) * (maxVal - minVal)));
});

svg
  .append("rect")
  .attr("x", barX)
  .attr("y", legendY)
  .attr("width", barW)
  .attr("height", barH)
  .attr("rx", 3)
  .attr("fill", "url(#calendar-seq)");

svg
  .append("text")
  .attr("x", barX - 12)
  .attr("y", legendY + barH / 2)
  .attr("text-anchor", "end")
  .attr("dominant-baseline", "central")
  .attr("fill", t.inkSoft)
  .style("font-size", "15px")
  .text("Less");

svg
  .append("text")
  .attr("x", barX + barW + 12)
  .attr("y", legendY + barH / 2)
  .attr("text-anchor", "start")
  .attr("dominant-baseline", "central")
  .attr("fill", t.inkSoft)
  .style("font-size", "15px")
  .text("More");

// --- Monthly average summary panel (below the legend) ---------------------
svg
  .append("text")
  .attr("x", margin.left)
  .attr("y", sectionTitleY)
  .attr("fill", t.ink)
  .style("font-size", "17px")
  .style("font-weight", "600")
  .text("Monthly average — steps (thousands)");

const monthX = d3.scaleBand().domain(d3.range(12)).range([0, iw]).padding(0.3);
const monthY = d3.scaleLinear().domain([0, d3.max(monthly, (d) => d.avg)]).nice().range([chartBottom, chartInnerTop]);

const chartG = svg.append("g").attr("transform", `translate(${margin.left},0)`);

chartG
  .append("g")
  .call(d3.axisLeft(monthY).ticks(3).tickSize(-iw))
  .call((axis) => axis.select(".domain").remove())
  .call((axis) => axis.selectAll(".tick line").attr("stroke", t.grid))
  .call((axis) => axis.selectAll(".tick text").attr("fill", t.inkSoft).style("font-size", "13px"));

chartG
  .selectAll(".month-bar")
  .data(monthly)
  .join("rect")
  .attr("class", "month-bar")
  .attr("x", (d) => monthX(d.m))
  .attr("y", (d) => monthY(d.avg))
  .attr("width", monthX.bandwidth())
  .attr("height", (d) => chartBottom - monthY(d.avg))
  .attr("rx", 2)
  .attr("fill", (d) => colorScale(d.avg))
  .attr("stroke", (d) => (d.m === peak.m ? t.ink : "none"))
  .attr("stroke-width", (d) => (d.m === peak.m ? 2 : 0));

chartG
  .selectAll(".month-tick")
  .data(monthly)
  .join("text")
  .attr("class", "month-tick")
  .attr("x", (d) => monthX(d.m) + monthX.bandwidth() / 2)
  .attr("y", xAxisLabelY)
  .attr("text-anchor", "middle")
  .attr("fill", t.inkSoft)
  .style("font-size", "13px")
  .text((d) => monthName(Date.UTC(YEAR, d.m, 1)));

// Focal-point annotation: call out the seasonal peak month.
chartG
  .append("text")
  .attr("x", monthX(peak.m) + monthX.bandwidth() / 2)
  .attr("y", monthY(peak.avg) - 8)
  .attr("text-anchor", "middle")
  .attr("fill", t.ink)
  .style("font-size", "14px")
  .style("font-weight", "600")
  .text(`Peak · ${monthName(Date.UTC(YEAR, peak.m, 1))} · ${peak.avg.toFixed(1)}k`);

// --- Title & subtitle -------------------------------------------------------
svg
  .append("text")
  .attr("x", width / 2)
  .attr("y", titleY)
  .attr("text-anchor", "middle")
  .attr("fill", t.ink)
  .style("font-size", "26px")
  .style("font-weight", "600")
  .text("heatmap-calendar · javascript · d3 · anyplot.ai");

svg
  .append("text")
  .attr("x", width / 2)
  .attr("y", subtitleY)
  .attr("text-anchor", "middle")
  .attr("fill", t.inkSoft)
  .style("font-size", "17px")
  .style("font-weight", "500")
  .text("Daily step count (thousands) · 2025");
Runnable source as JSON, for any HTTP client: https://api.anyplot.ai/specs/heatmap-calendar/d3/code. Any spec id and library id listed in llms-full.txt fit the same URL shape; every URL below is complete and callable.
{
  "spec_id": "heatmap-calendar",
  "language": "javascript",
  "library": "d3",
  "page": "https://anyplot.ai/heatmap-calendar/javascript/d3",
  "hub": "https://anyplot.ai/heatmap-calendar",
  "code_json": "https://api.anyplot.ai/specs/heatmap-calendar/d3/code",
  "spec_json": "https://api.anyplot.ai/specs/heatmap-calendar",
  "render_light_png": "https://storage.googleapis.com/anyplot-images/plots/heatmap-calendar/javascript/d3/plot-light.png",
  "render_dark_png": "https://storage.googleapis.com/anyplot-images/plots/heatmap-calendar/javascript/d3/plot-dark.png",
  "interactive_light_html": "https://storage.googleapis.com/anyplot-images/plots/heatmap-calendar/javascript/d3/plot-light.html",
  "interactive_dark_html": "https://storage.googleapis.com/anyplot-images/plots/heatmap-calendar/javascript/d3/plot-dark.html",
  "quality_score": 93.0,
  "license": "MIT",
  "guide": "https://anyplot.ai/llms.txt"
}
Part of Basic Calendar Heatmap on anyplot.ai.