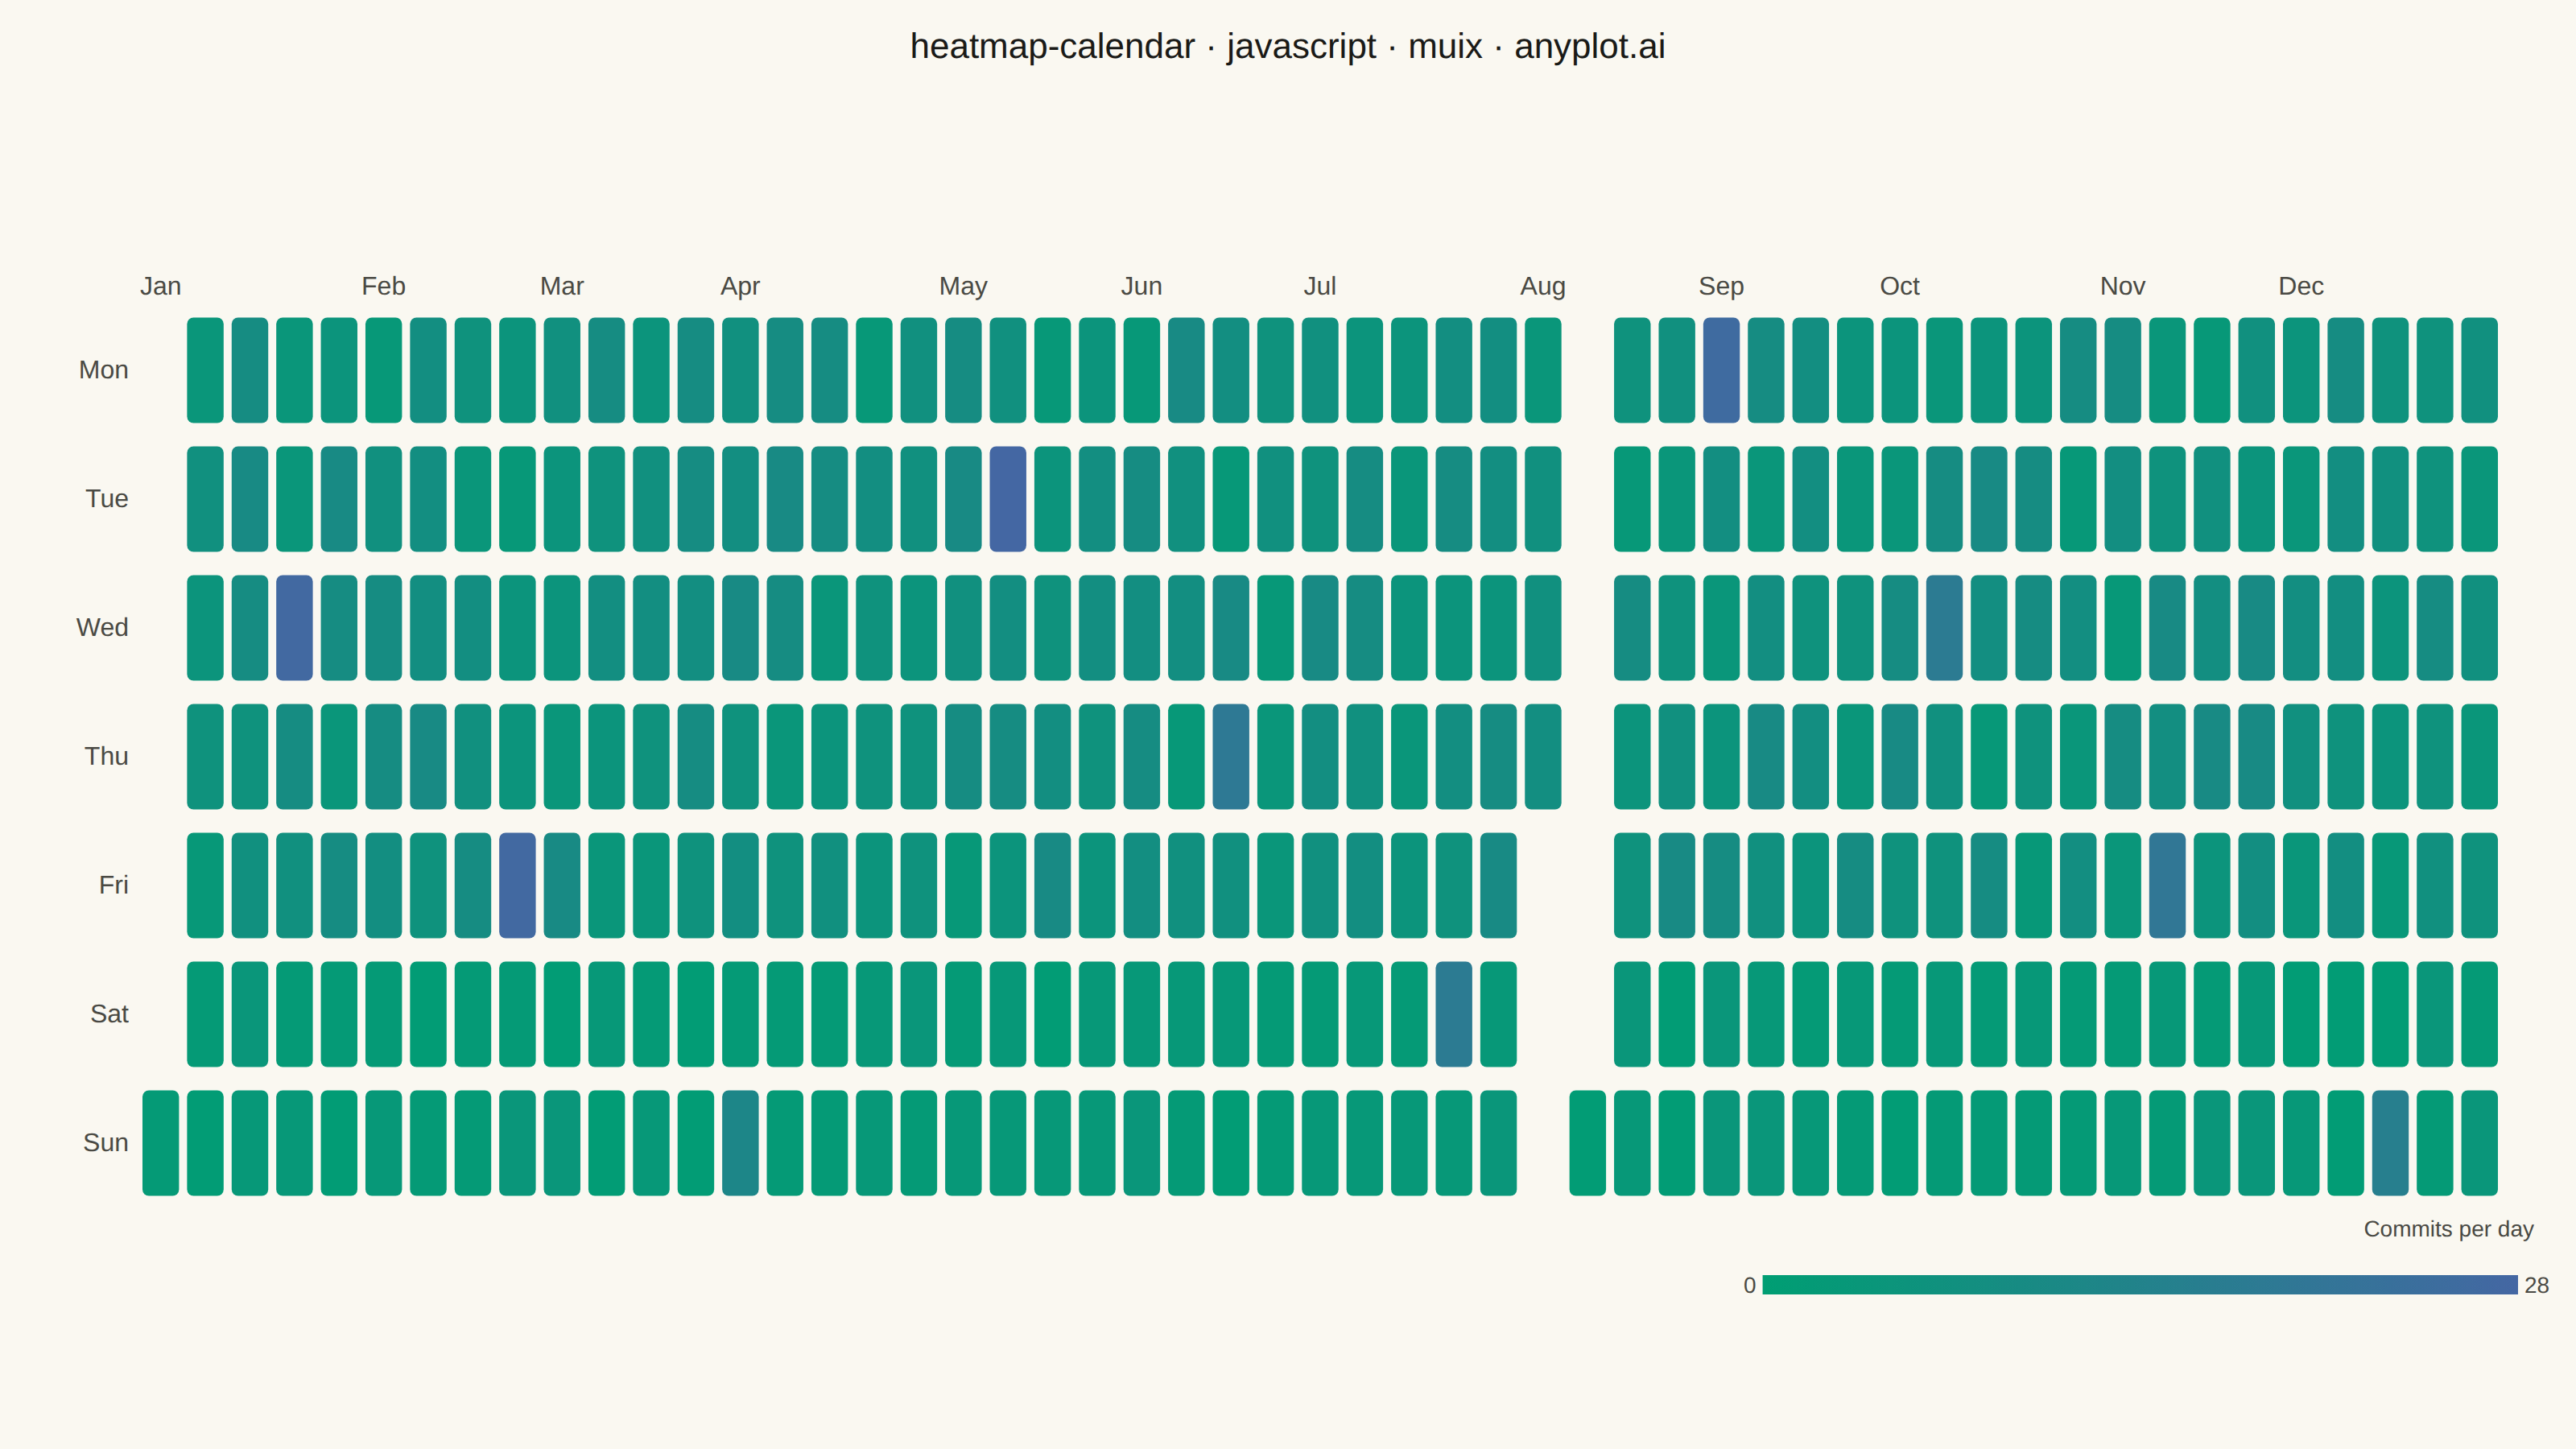
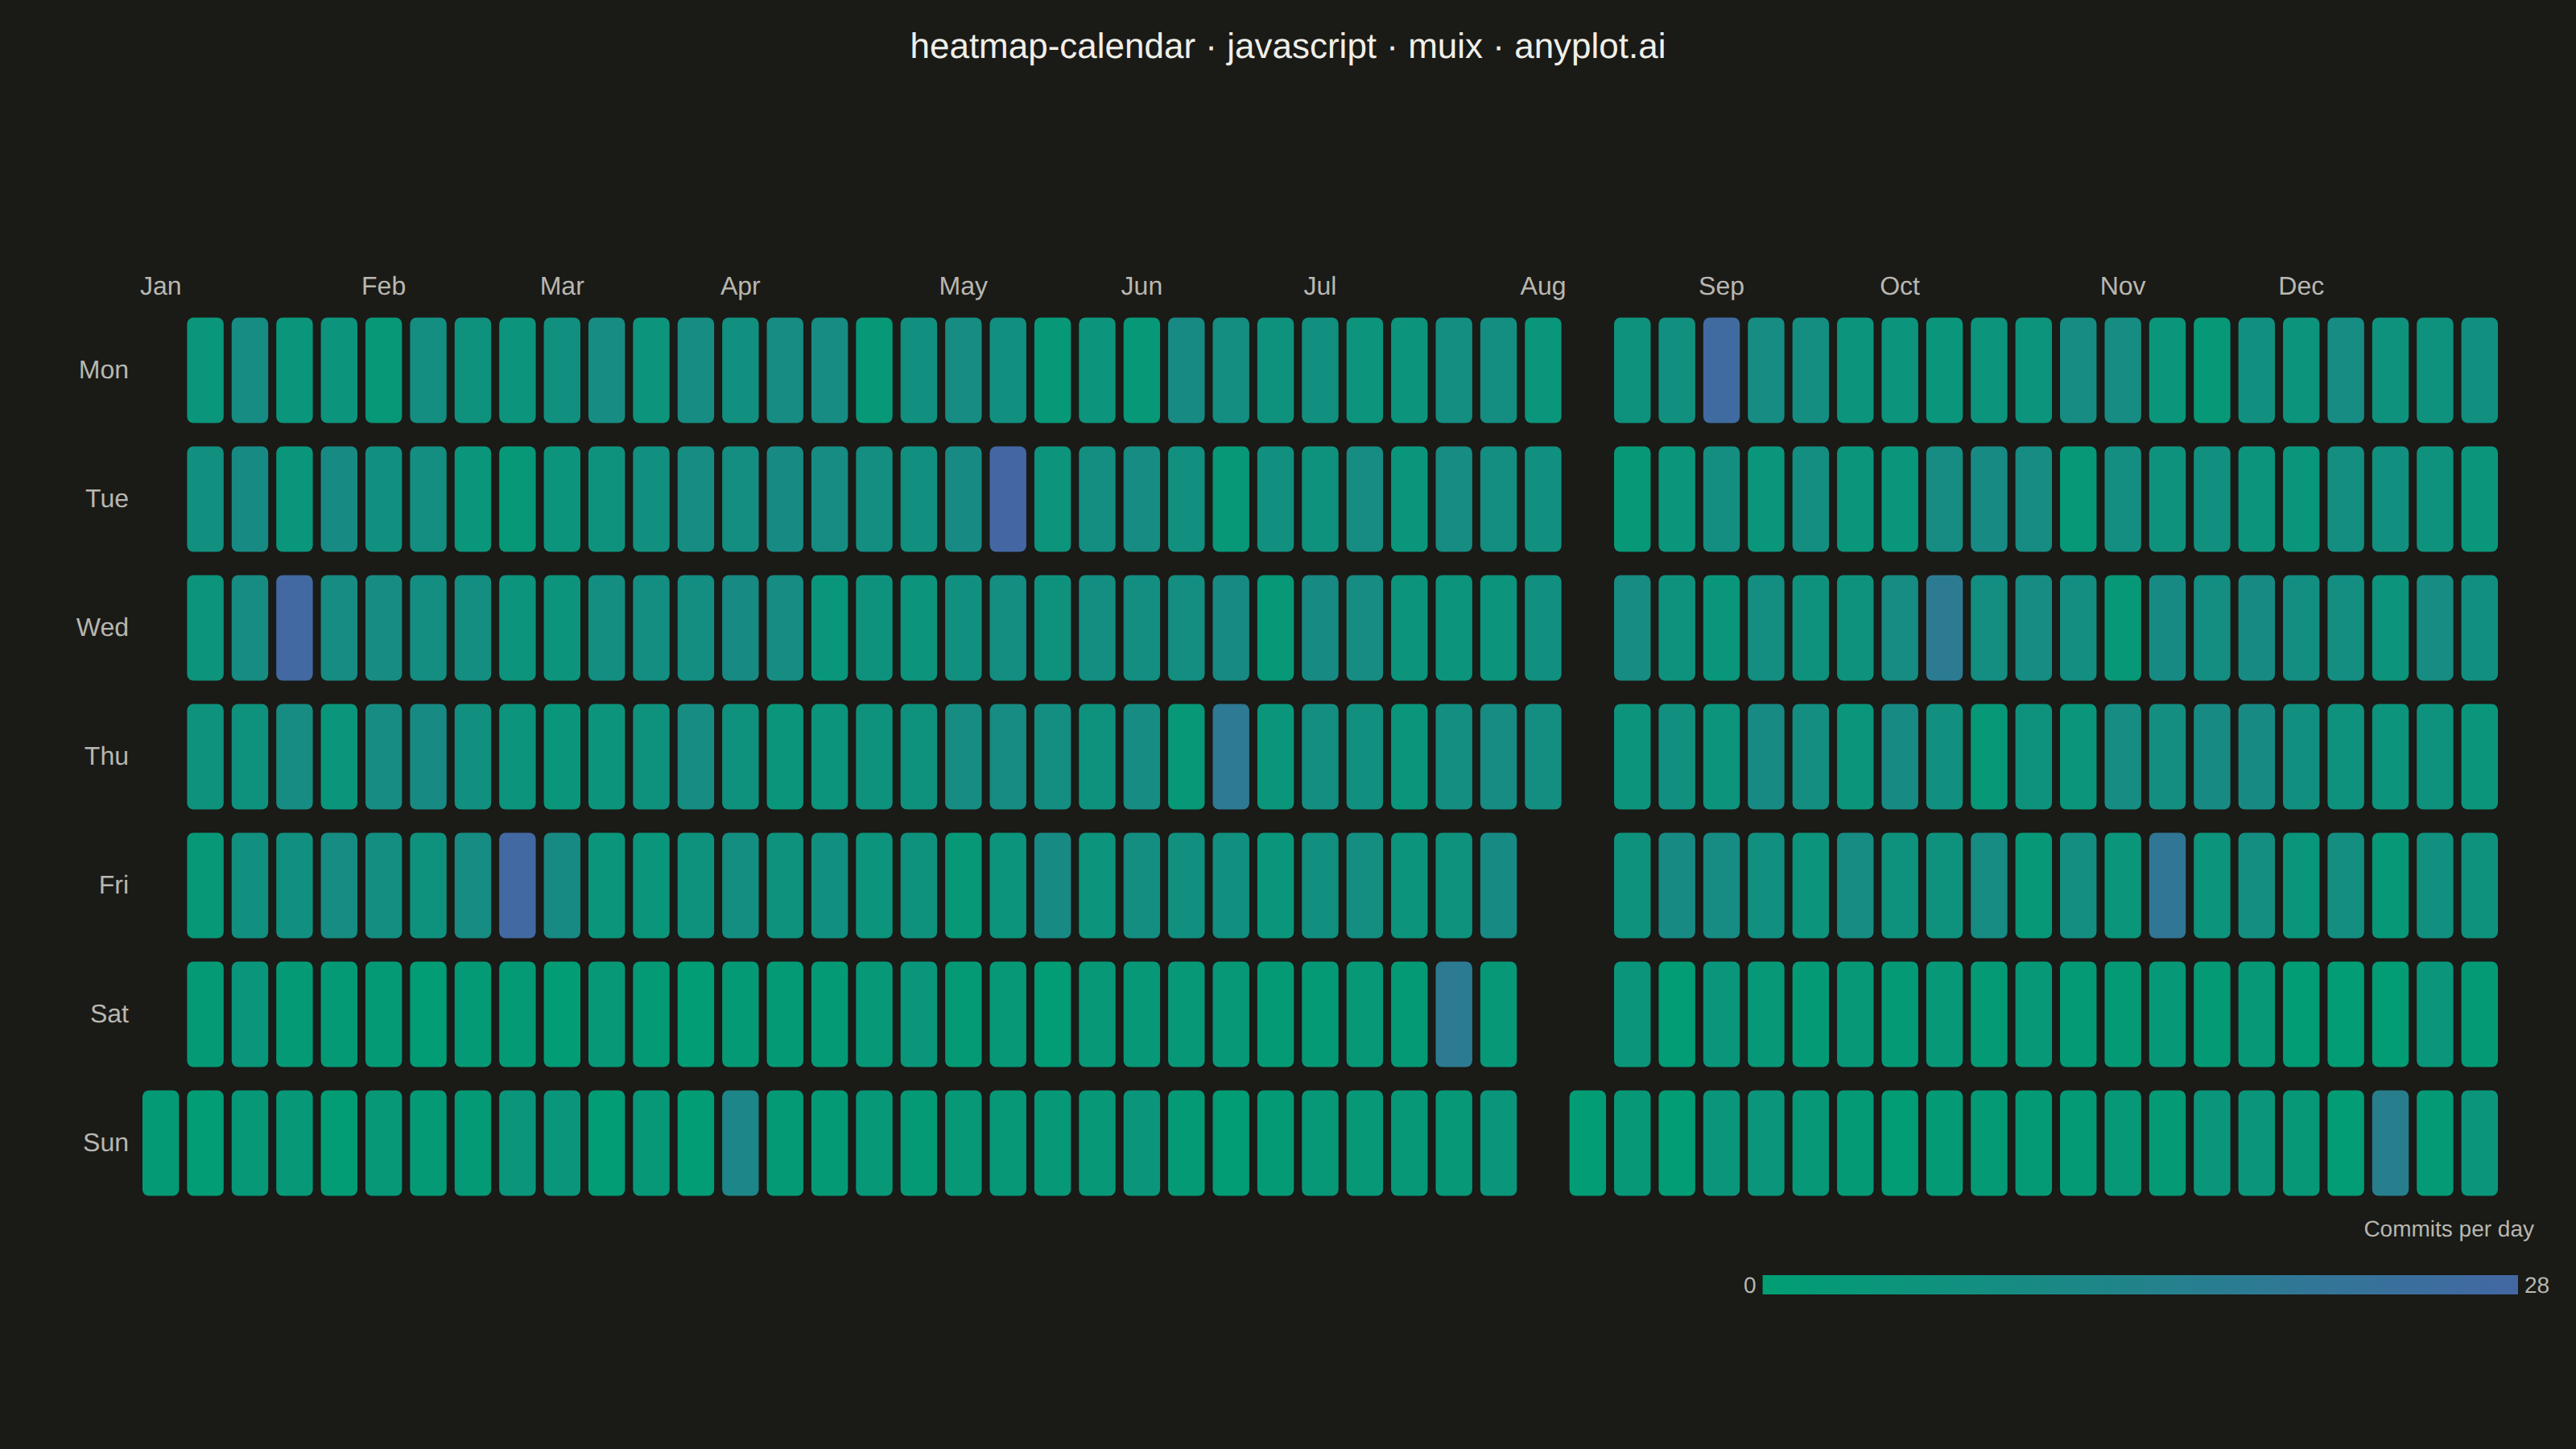
The same plot in 14 other libraries — JavaScript: Chart.js, D3.js, Apache ECharts, Highcharts; Python: Altair, Bokeh, lets-plot, Matplotlib, Plotly, plotnine, Pygal, Seaborn; R: ggplot2; Julia: Makie.jl. Compare all 15 side by side: Basic Calendar Heatmap in Python, R, Julia and JavaScript.
A calendar heatmap visualizes time-series data on a calendar grid, where each day is represented as a cell and color intensity indicates the value magnitude. The layout follows a calendar structure with days as cells, weekdays as rows, weeks as columns, and months as labeled sections along the top. This visualization excels at revealing daily patterns, seasonal trends, and temporal anomalies over extended time periods.
// anyplot.ai
// heatmap-calendar: Basic Calendar Heatmap
// Library: muix 7.29.1 | JavaScript 22.23.1
// Quality: 92/100 | Created: 2026-07-23

import Box from "@mui/material/Box";
import Typography from "@mui/material/Typography";
import { ScatterChart } from "@mui/x-charts/ScatterChart";
import { ContinuousColorLegend } from "@mui/x-charts/ChartsLegend";
import { ChartsText } from "@mui/x-charts/ChartsText";

const t = window.ANYPLOT_TOKENS;

// Deterministic LCG — reproducible daily activity without a seeded global RNG
function makeLcg(seed) {
  let s = seed >>> 0;
  return () => {
    s = (Math.imul(s, 1664525) + 1013904223) >>> 0;
    return s / 4294967296;
  };
}
const rng = makeLcg(42);

const WEEKDAY_LABELS = ["Mon", "Tue", "Wed", "Thu", "Fri", "Sat", "Sun"];
const MONTH_LABELS = [
  "Jan", "Feb", "Mar", "Apr", "May", "Jun",
  "Jul", "Aug", "Sep", "Oct", "Nov", "Dec",
];

// One full year of daily coding activity (GitHub-style contribution counts).
// A 9-day trip in August has no commits at all — those dates are simply
// omitted from the series, leaving the calendar cell empty (neutral).
const YEAR = 2023;
const TOTAL_DAYS = 365;
const VACATION_START_DAY = 215; // day-of-year index (0-based), ~early August
const VACATION_LENGTH = 9;

const firstDay = new Date(YEAR, 0, 1);
const firstWeekdayIdx = (firstDay.getDay() + 6) % 7; // Mon=0 .. Sun=6

const points = [];
const monthLabelByWeek = new Map();
let lastMonth = -1;
let maxValue = 0;

for (let i = 0; i < TOTAL_DAYS; i += 1) {
  const date = new Date(YEAR, 0, 1 + i);
  const weekdayIdx = (date.getDay() + 6) % 7;
  const weekIndex = Math.floor((i + firstWeekdayIdx) / 7);
  const month = date.getMonth();

  if (month !== lastMonth) {
    if (!monthLabelByWeek.has(weekIndex)) {
      monthLabelByWeek.set(weekIndex, MONTH_LABELS[month]);
    }
    lastMonth = month;
  }

  const onVacation = i >= VACATION_START_DAY && i < VACATION_START_DAY + VACATION_LENGTH;
  if (onVacation) continue;

  const isWeekend = weekdayIdx >= 5;
  let commits = isWeekend ? 1 + rng() * 3 : 3 + rng() * 7;
  if (i % 37 === 17) commits += 10 + rng() * 8; // occasional release-day spike
  commits = Math.round(commits);

  maxValue = Math.max(maxValue, commits);
  points.push({
    id: `d${i}`,
    x: weekIndex,
    y: WEEKDAY_LABELS[weekdayIdx],
    z: commits,
  });
}

const weekCount = Math.max(...points.map((p) => p.x)) + 1;
const weekIndices = Array.from({ length: weekCount }, (_, i) => i);

// Custom marker: rounded rectangle cells (calendar days) instead of the
// default circles, sized from the band scales so they tile the week/weekday
// grid with a small gap between neighbours (from each axis's categoryGapRatio).
function SquareCell(props) {
  const { series, xScale, yScale, colorGetter, color } = props;
  const xIsBand = typeof xScale.bandwidth === "function";
  const yIsBand = typeof yScale.bandwidth === "function";
  const cellW = xIsBand ? xScale.bandwidth() : 10;
  const cellH = yIsBand ? yScale.bandwidth() : 10;

  return (
    <g>
      {series.data.map((pt, i) => {
        const cx = (xScale(pt.x) ?? 0) + (xIsBand ? cellW / 2 : 0);
        const cy = (yScale(pt.y) ?? 0) + (yIsBand ? cellH / 2 : 0);
        return (
          <rect
            key={pt.id}
            x={cx - cellW / 2}
            y={cy - cellH / 2}
            width={cellW}
            height={cellH}
            rx={Math.min(4, cellW * 0.18)}
            fill={colorGetter ? colorGetter(i) : color}
          />
        );
      })}
    </g>
  );
}

export default function Chart() {
  const { width, height } = window.ANYPLOT_SIZE;
  const titleHeight = 56;

  // 53 weeks x 7 weekdays is a much wider grid than the 16:9 mount, so a
  // literal square cell would leave most of the canvas empty. Instead give
  // the grid a deliberate, moderately tall row height (a "brick" cell rather
  // than a pixel-perfect square) that consumes most of the space below the
  // title, so the calendar+legend block fills the canvas tightly instead of
  // floating in a taller centered box.
  const LEFT_MARGIN = 68;
  const RIGHT_MARGIN = 28;
  const GAP_RATIO = 0.18;
  const TOP_MARGIN = 40;
  const GRID_HEIGHT = 560;
  const LEGEND_SPACE = 56;
  const chartInnerHeight = TOP_MARGIN + GRID_HEIGHT + LEGEND_SPACE;
  // ContinuousColorLegend right-aligns flush to the chart's own width (not
  // the margin box), so its max-value label can kiss the true canvas edge —
  // give the chart a slightly narrower width than the mount so that label
  // always has breathing room.
  const LEGEND_EDGE_BUFFER = 36;
  const chartWidth = width - LEGEND_EDGE_BUFFER;

  return (
    <Box sx={{ width, height, bgcolor: t.pageBg, display: "flex", flexDirection: "column" }}>
      <Typography
        sx={{
          color: t.ink,
          fontSize: 22,
          fontWeight: 500,
          textAlign: "center",
          lineHeight: 1.2,
          pt: "16px",
          height: titleHeight,
          fontFamily: "inherit",
        }}
      >
        heatmap-calendar · javascript · muix · anyplot.ai
      </Typography>
      <Box sx={{ flex: 1, display: "flex", alignItems: "center", justifyContent: "flex-start" }}>
        <ScatterChart
          width={chartWidth}
          height={chartInnerHeight}
          skipAnimation
          disableVoronoi
          series={[
            {
              id: "activity",
              type: "scatter",
              data: points,
              label: "Commits per day",
              xAxisId: "week",
              yAxisId: "weekday",
              zAxisId: "activity",
            },
          ]}
          xAxis={[
            { id: "week", scaleType: "band", data: weekIndices, categoryGapRatio: GAP_RATIO },
            {
              id: "month",
              scaleType: "band",
              data: weekIndices,
              categoryGapRatio: GAP_RATIO,
              valueFormatter: (weekIdx) => monthLabelByWeek.get(weekIdx) ?? "",
              tickLabelStyle: { fontSize: 16, fill: t.inkSoft },
              disableTicks: true,
              disableLine: true,
            },
          ]}
          yAxis={[
            {
              id: "weekday",
              scaleType: "band",
              data: WEEKDAY_LABELS,
              categoryGapRatio: GAP_RATIO,
              tickLabelStyle: { fontSize: 16, fill: t.inkSoft },
              disableTicks: true,
              disableLine: true,
            },
          ]}
          zAxis={[
            {
              id: "activity",
              min: 0,
              max: maxValue,
              colorMap: { type: "continuous", min: 0, max: maxValue, color: [t.seq[0], t.seq[1]] },
            },
          ]}
          topAxis="month"
          bottomAxis={null}
          leftAxis="weekday"
          rightAxis={null}
          margin={{ top: TOP_MARGIN, right: RIGHT_MARGIN, bottom: LEGEND_SPACE, left: LEFT_MARGIN }}
          slots={{ scatter: SquareCell }}
          slotProps={{ legend: { hidden: true } }}
        >
          <ChartsText
            text="Commits per day"
            x={chartWidth - 8}
            y={chartInnerHeight - LEGEND_SPACE + 8}
            style={{
              fontSize: 14,
              fill: t.inkSoft,
              fontFamily: "inherit",
              textAnchor: "end",
              dominantBaseline: "hanging",
            }}
          />
          <ContinuousColorLegend
            axisId="activity"
            axisDirection="z"
            position={{ horizontal: "right", vertical: "bottom" }}
            direction="row"
            length="30%"
            thickness={12}
            labelStyle={{ fontSize: 14, fill: t.inkSoft, fontFamily: "inherit" }}
          />
        </ScatterChart>
      </Box>
    </Box>
  );
}
Runnable source as JSON, for any HTTP client: https://api.anyplot.ai/specs/heatmap-calendar/muix/code. Any spec id and library id listed in llms-full.txt fit the same URL shape; every URL below is complete and callable.
{
  "spec_id": "heatmap-calendar",
  "language": "javascript",
  "library": "muix",
  "page": "https://anyplot.ai/heatmap-calendar/javascript/muix",
  "hub": "https://anyplot.ai/heatmap-calendar",
  "code_json": "https://api.anyplot.ai/specs/heatmap-calendar/muix/code",
  "spec_json": "https://api.anyplot.ai/specs/heatmap-calendar",
  "render_light_png": "https://storage.googleapis.com/anyplot-images/plots/heatmap-calendar/javascript/muix/plot-light.png",
  "render_dark_png": "https://storage.googleapis.com/anyplot-images/plots/heatmap-calendar/javascript/muix/plot-dark.png",
  "interactive_light_html": "https://storage.googleapis.com/anyplot-images/plots/heatmap-calendar/javascript/muix/plot-light.html",
  "interactive_dark_html": "https://storage.googleapis.com/anyplot-images/plots/heatmap-calendar/javascript/muix/plot-dark.html",
  "quality_score": 92.0,
  "license": "MIT",
  "guide": "https://anyplot.ai/llms.txt"
}
Part of Basic Calendar Heatmap on anyplot.ai.