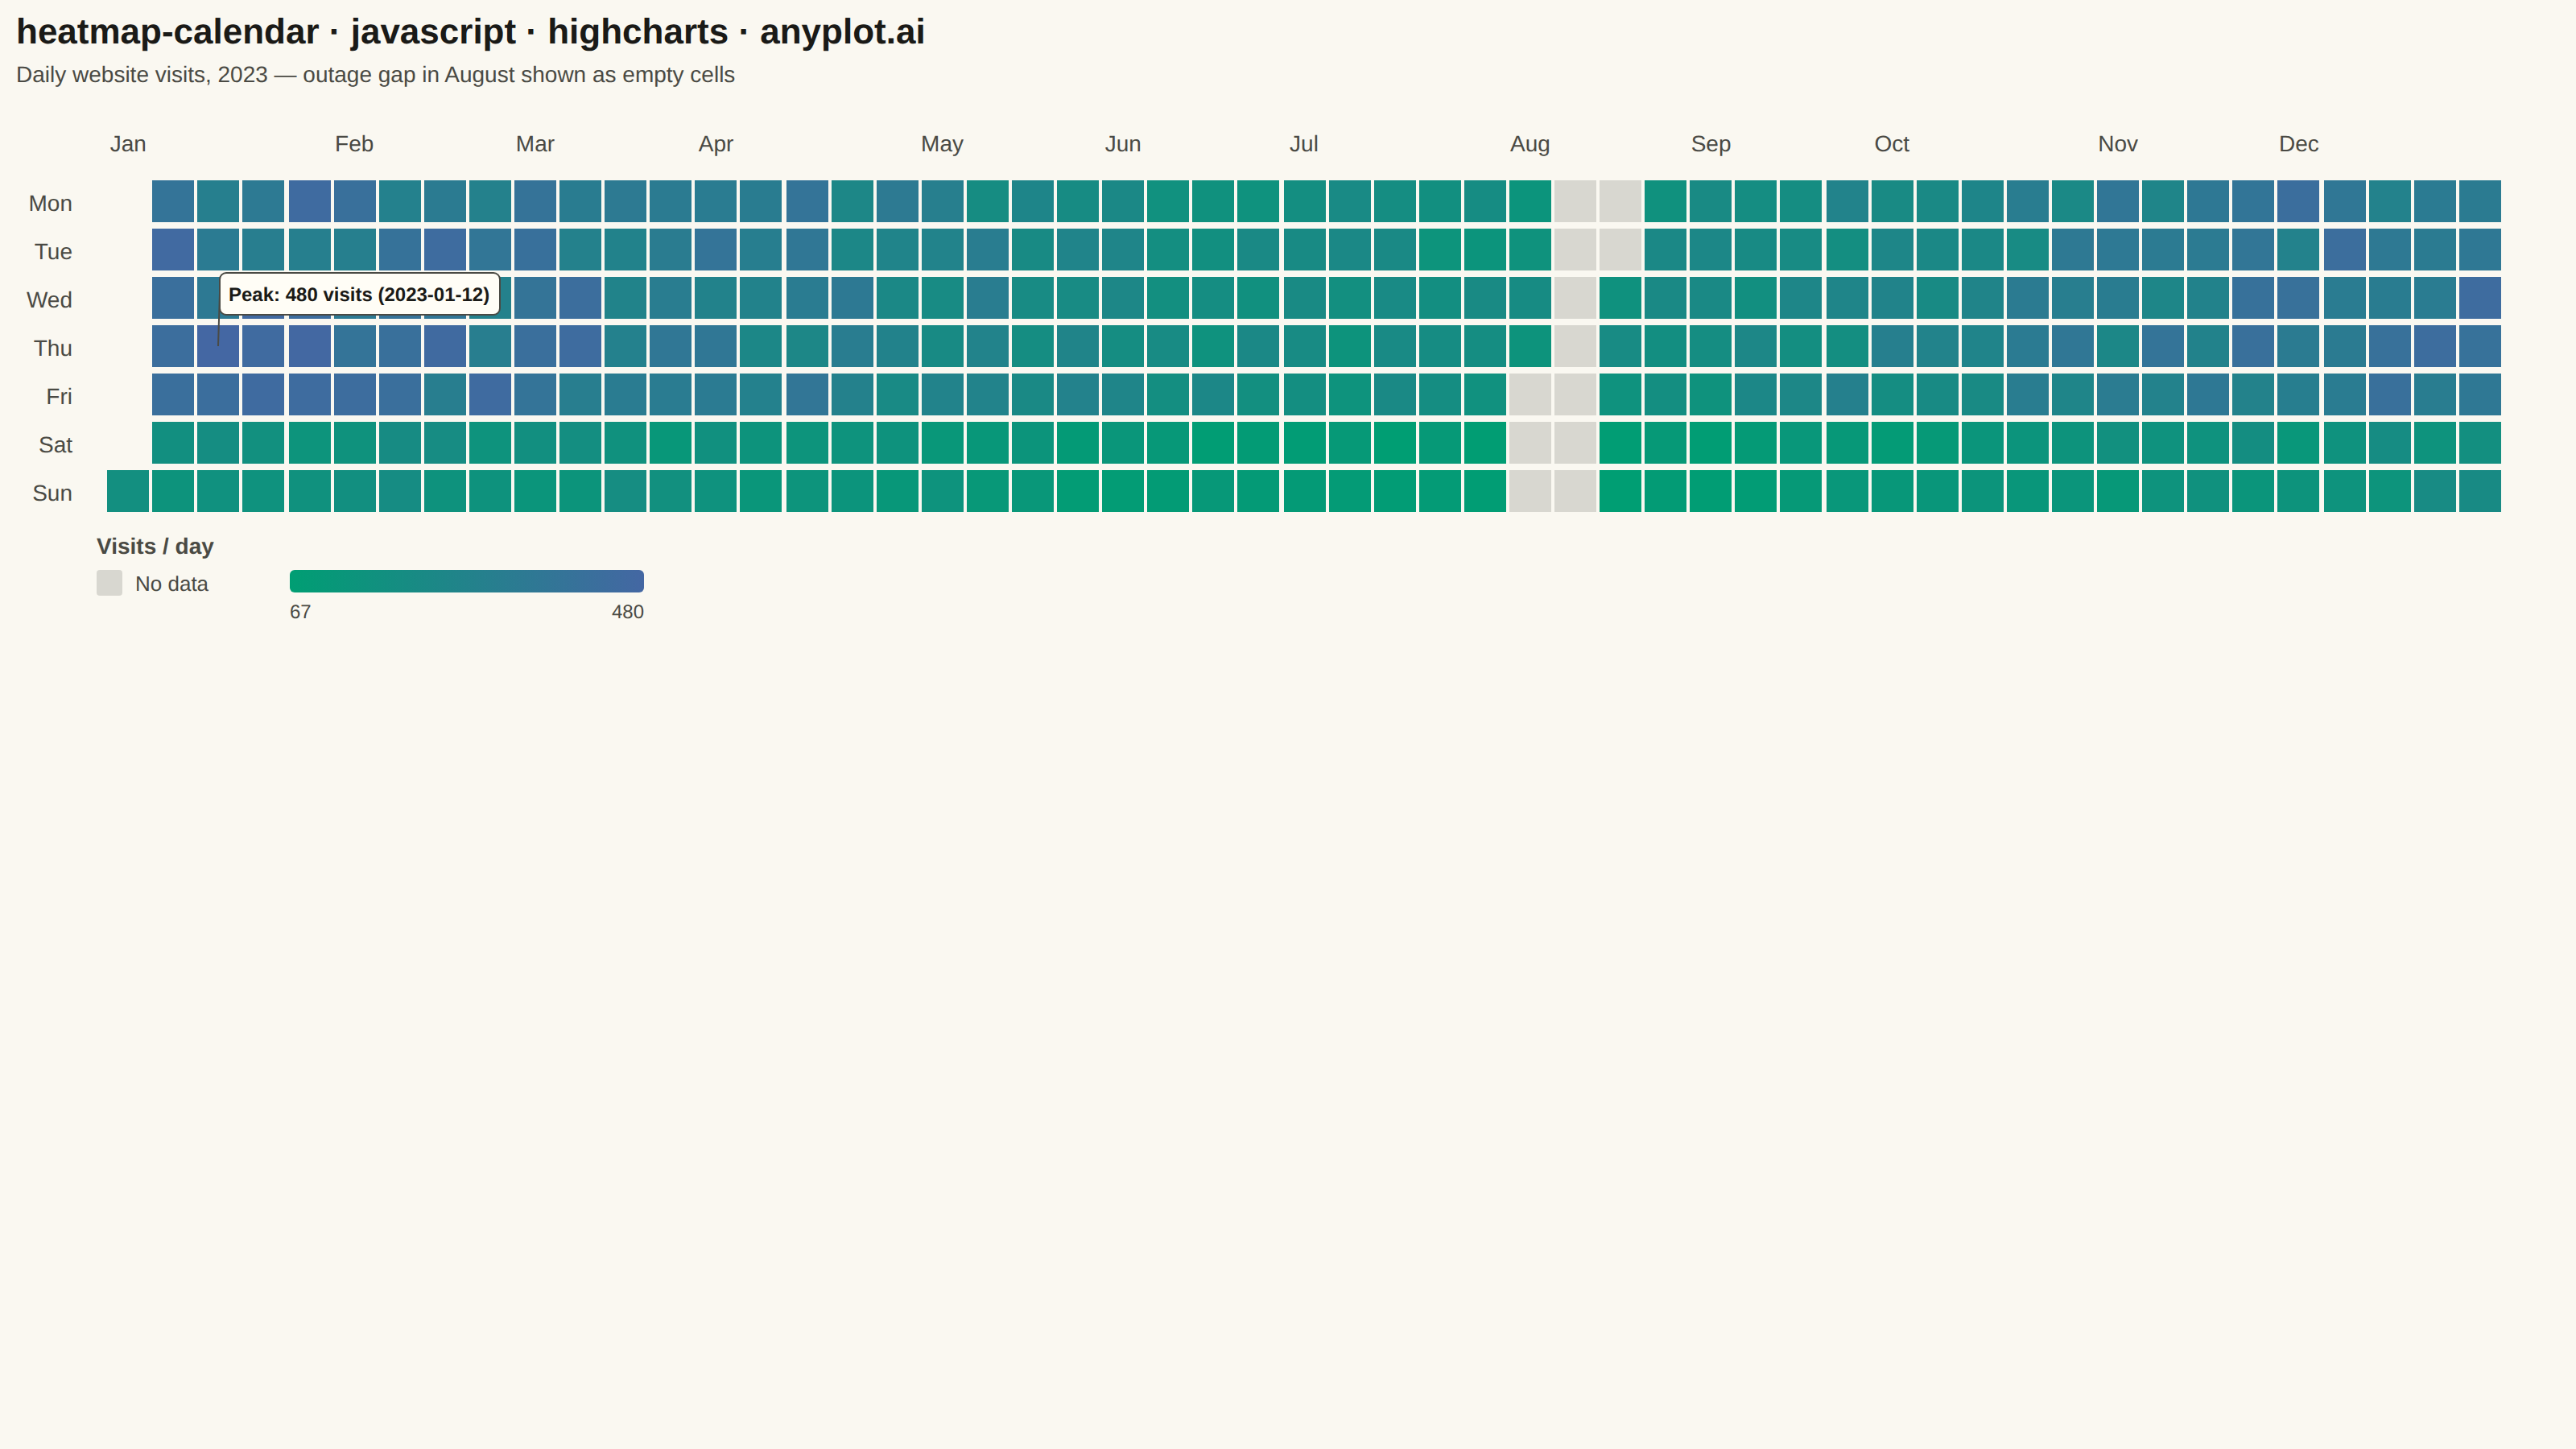
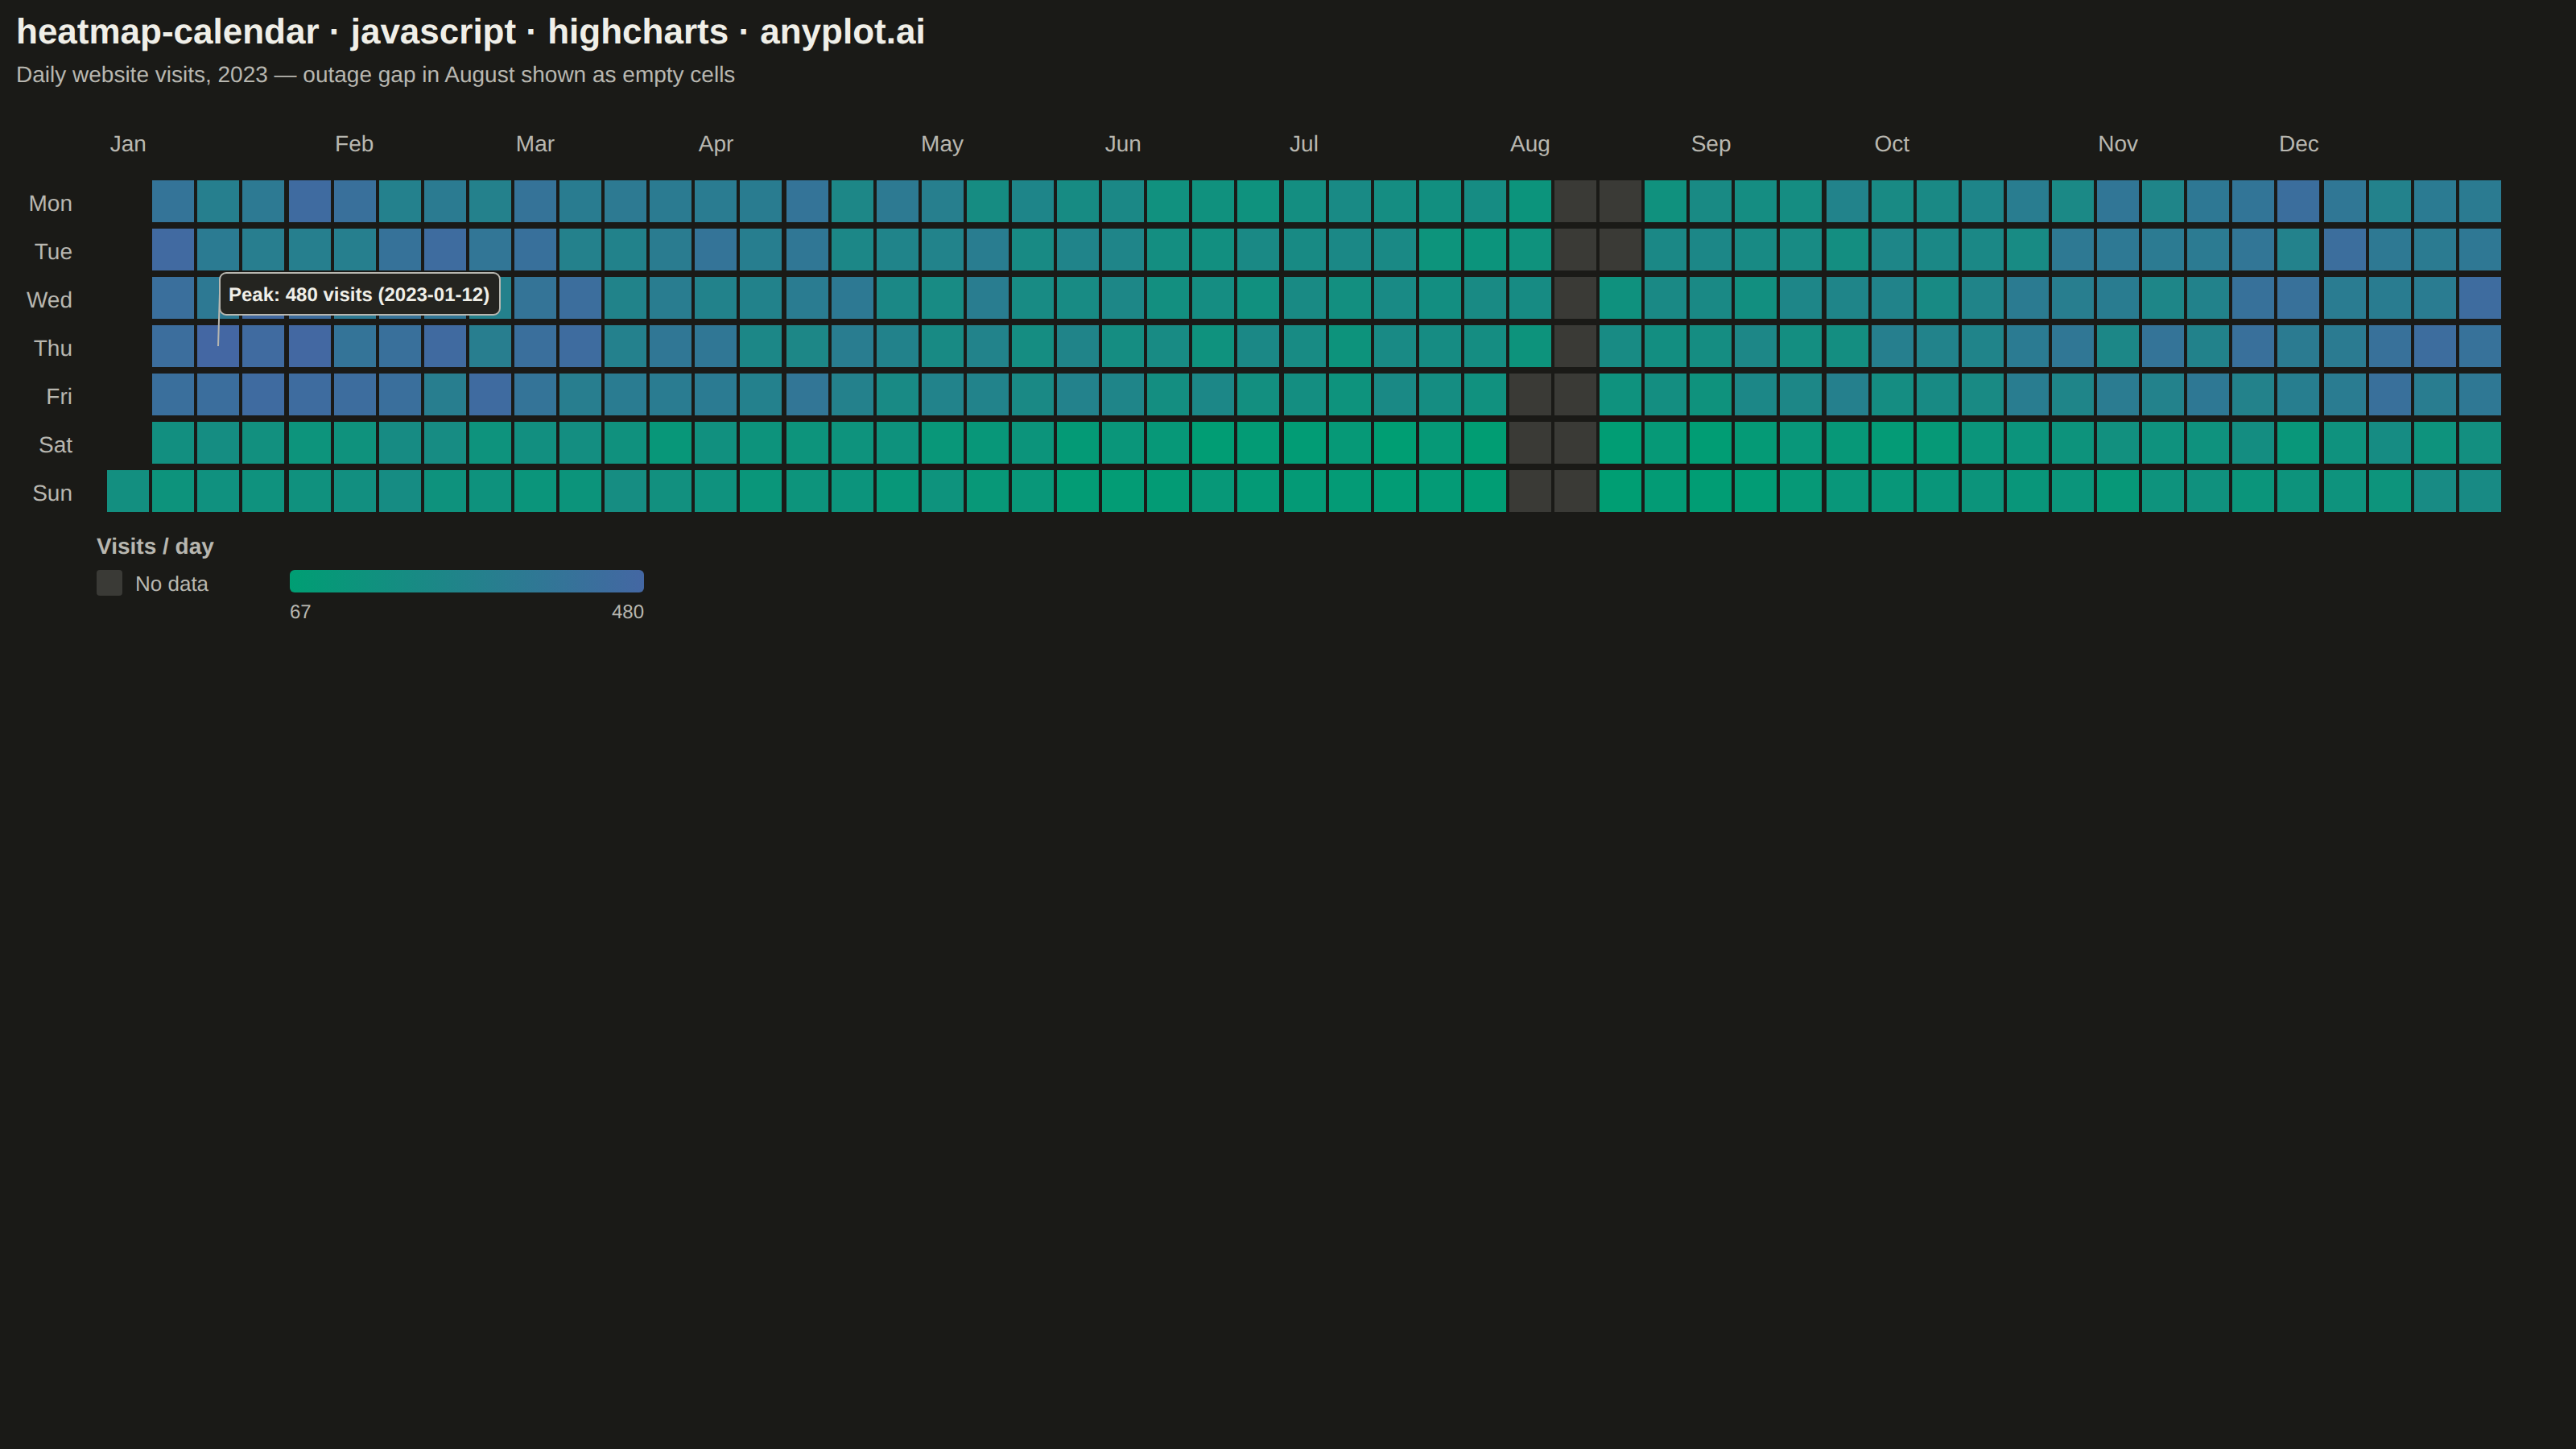
The same plot in 14 other libraries — JavaScript: Chart.js, D3.js, Apache ECharts, MUI X Charts; Python: Altair, Bokeh, lets-plot, Matplotlib, Plotly, plotnine, Pygal, Seaborn; R: ggplot2; Julia: Makie.jl. Compare all 15 side by side: Basic Calendar Heatmap in Python, R, Julia and JavaScript.
A calendar heatmap visualizes time-series data on a calendar grid, where each day is represented as a cell and color intensity indicates the value magnitude. The layout follows a calendar structure with days as cells, weekdays as rows, weeks as columns, and months as labeled sections along the top. This visualization excels at revealing daily patterns, seasonal trends, and temporal anomalies over extended time periods.
// anyplot.ai
// heatmap-calendar: Basic Calendar Heatmap
// Library: highcharts 12.6.0 | JavaScript 22.23.1
// Quality: 86/100 | Created: 2026-07-23

const t = window.ANYPLOT_TOKENS;

// --- Data (in-memory, deterministic) ----------------------------------------
// Daily website visits for 2023, with a weekly seasonality (weekday traffic
// higher than weekend) plus a data-collection outage in August (missing dates).
let lcgState = 42;
function nextRandom() {
  lcgState = (lcgState * 1103515245 + 12345) % 2147483648;
  return lcgState / 2147483648;
}

const WEEKDAY_LABELS = ["Mon", "Tue", "Wed", "Thu", "Fri", "Sat", "Sun"];
const MONTH_LABELS = [
  "Jan", "Feb", "Mar", "Apr", "May", "Jun",
  "Jul", "Aug", "Sep", "Oct", "Nov", "Dec",
];
const START = Date.UTC(2023, 0, 1); // Jan 1 2023 — a Sunday
const DAY_MS = 24 * 60 * 60 * 1000;
const TOTAL_DAYS = 365;
// Monday-indexed weekday (0=Mon..6=Sun) of the first day, so weeks align to
// Monday-start columns matching the Mon-Sun y-axis labels.
const firstMondayIndex = (new Date(START).getUTCDay() + 6) % 7;

// The core Highcharts bundle has no heatmap/colorAxis-mapping module (see
// prompts/library/highcharts.md), so each cell's fill is computed by hand —
// a linear interpolation across the two-stop imprint_seq gradient.
function hexToRgb(hex) {
  const n = parseInt(hex.slice(1), 16);
  return [(n >> 16) & 255, (n >> 8) & 255, n & 255];
}
const seqLow = hexToRgb(t.seq[0]);
const seqHigh = hexToRgb(t.seq[1]);
function valueToColor(value, min, max) {
  const frac = max > min ? (value - min) / (max - min) : 0;
  const rgb = seqLow.map((c, i) => Math.round(c + (seqHigh[i] - c) * frac));
  return `rgb(${rgb[0]},${rgb[1]},${rgb[2]})`;
}

const cells = [];
const missingCells = [];
let minVisits = Infinity;
let maxVisits = -Infinity;

for (let i = 0; i < TOTAL_DAYS; i++) {
  const date = new Date(START + i * DAY_MS);
  const mondayIndex = (date.getUTCDay() + 6) % 7; // 0=Mon .. 6=Sun
  const weekIndex = Math.floor((i + firstMondayIndex) / 7);

  // Simulated data-collection outage: 12 days in mid-August with no records.
  const isOutage = i >= 215 && i < 227;

  if (isOutage) {
    missingCells.push({ x: weekIndex, y: mondayIndex });
    continue;
  }

  const weekdayBoost = mondayIndex < 5 ? 1.3 : 0.6; // weekdays busier than weekends
  const seasonal = 1 + 0.35 * Math.sin((i / TOTAL_DAYS) * 2 * Math.PI + 1.2);
  const noise = 0.75 + nextRandom() * 0.5;
  const visits = Math.round(220 * weekdayBoost * seasonal * noise);

  minVisits = Math.min(minVisits, visits);
  maxVisits = Math.max(maxVisits, visits);
  cells.push({ x: weekIndex, y: mondayIndex, value: visits, date: date.toISOString().slice(0, 10) });
}
cells.forEach((c) => {
  c.color = valueToColor(c.value, minVisits, maxVisits);
});

const weekCount = Math.floor((TOTAL_DAYS - 1 + firstMondayIndex) / 7) + 1;

// Tick position (week index) for the first day of each month, for the top axis.
const monthTicks = [];
for (let m = 0; m < 12; m++) {
  const first = Date.UTC(2023, m, 1);
  const daysSinceStart = Math.round((first - START) / DAY_MS);
  const mondayIndex = (new Date(first).getUTCDay() + 6) % 7;
  const weekIndex = Math.floor((daysSinceStart + firstMondayIndex) / 7);
  monthTicks.push({ value: weekIndex, label: MONTH_LABELS[m] });
}

// Peak day — called out with a renderer-drawn callout (see drawPeakCallout),
// since core Highcharts has no annotations module.
const peakCell = cells.reduce((best, c) => (c.value > best.value ? c : best), cells[0]);

// Tight vertical band: 7 rows at ~30px pitch, matching the ~28px week-column
// pitch, so cells read as square rather than stretched across the canvas.
const MARGIN_TOP = 110;
const BAND_HEIGHT = 210;
const MARGIN_BOTTOM = 900 - MARGIN_TOP - BAND_HEIGHT;

// --- Chart -------------------------------------------------------------------
const title = "heatmap-calendar · javascript · highcharts · anyplot.ai";

// The core Highcharts bundle has no annotations/colorAxis module, so the
// gradient legend bar and the peak-day callout are drawn with the SVG
// renderer directly against the built chart — an idiom specific to
// Highcharts' rendering engine rather than a generic scatter overlay.
function drawColorLegend(chart) {
  const r = chart.renderer;
  const x0 = chart.plotLeft;
  const y0 = chart.plotTop + chart.plotHeight + 34;
  const barWidth = 220;
  const barHeight = 14;

  r.text("Visits / day", x0, y0 - 10)
    .css({ color: t.inkSoft, fontSize: "14px", fontWeight: "600" })
    .add();

  r.rect(x0, y0, 16, 16, 2).attr({ fill: t.grid, "stroke-width": 0 }).add();
  r.text("No data", x0 + 24, y0 + 13)
    .css({ color: t.inkSoft, fontSize: "13px" })
    .add();

  const gx = x0 + 120;
  r.rect(gx, y0, barWidth, barHeight, 3)
    .attr({
      fill: {
        linearGradient: { x1: 0, y1: 0, x2: 1, y2: 0 },
        stops: [
          [0, t.seq[0]],
          [1, t.seq[1]],
        ],
      },
      "stroke-width": 0,
    })
    .add();
  r.text(String(minVisits), gx, y0 + barHeight + 16)
    .css({ color: t.inkSoft, fontSize: "12px" })
    .add();
  r.text(String(maxVisits), gx + barWidth - 20, y0 + barHeight + 16)
    .css({ color: t.inkSoft, fontSize: "12px" })
    .add();
}

function drawPeakCallout(chart) {
  const px = chart.xAxis[0].toPixels(peakCell.x, false);
  const py = chart.yAxis[0].toPixels(peakCell.y, false);
  const below = peakCell.y <= 1; // keep clear of the month-label axis on top rows
  const labelY = below ? py + 46 : py - 46;

  chart.renderer
    .label(`Peak: ${peakCell.value} visits (${peakCell.date})`, px, labelY, "callout", px, py)
    .attr({
      fill: t.elevatedBg,
      stroke: t.inkSoft,
      "stroke-width": 1,
      padding: 6,
      r: 4,
      zIndex: 6,
    })
    .css({ color: t.ink, fontSize: "12px", fontWeight: "600" })
    .add();
}

Highcharts.chart(
  "container",
  {
    chart: {
      type: "scatter",
      backgroundColor: "transparent",
      animation: false,
      style: { fontFamily: "inherit" },
      marginLeft: 60,
      marginRight: 40,
      marginTop: MARGIN_TOP,
      marginBottom: MARGIN_BOTTOM,
    },
    credits: { enabled: false },
    colors: t.palette,
    title: {
      text: title,
      align: "left",
      style: { color: t.ink, fontSize: "22px", fontWeight: "600" },
    },
    subtitle: {
      text: "Daily website visits, 2023 — outage gap in August shown as empty cells",
      align: "left",
      style: { color: t.inkSoft, fontSize: "14px" },
    },
    xAxis: {
      min: -0.7,
      max: weekCount - 0.3,
      startOnTick: false,
      endOnTick: false,
      lineWidth: 0,
      gridLineWidth: 0,
      tickWidth: 0,
      opposite: true,
      tickPositions: monthTicks.map((m) => m.value),
      labels: {
        style: { color: t.inkSoft, fontSize: "14px" },
        formatter() {
          const tick = monthTicks.find((m) => m.value === this.value);
          return tick ? tick.label : "";
        },
      },
    },
    yAxis: {
      title: { text: null },
      min: -0.5,
      max: 6.5,
      startOnTick: false,
      endOnTick: false,
      tickPositions: [0, 1, 2, 3, 4, 5, 6],
      reversed: true,
      lineWidth: 0,
      gridLineWidth: 0,
      tickWidth: 0,
      labels: {
        style: { color: t.inkSoft, fontSize: "14px" },
        formatter() {
          return WEEKDAY_LABELS[this.value] ?? "";
        },
      },
    },
    legend: { enabled: false },
    tooltip: { enabled: false },
    plotOptions: {
      series: { animation: false, enableMouseTracking: false },
      scatter: {
        marker: { symbol: "square", radius: 13, states: { hover: { enabled: false } } },
      },
    },
    series: [
      { name: "Visits", data: cells, showInLegend: false },
      { name: "No data", data: missingCells, color: t.grid, showInLegend: false },
    ],
  },
  function (chart) {
    drawColorLegend(chart);
    drawPeakCallout(chart);
  }
);
Runnable source as JSON, for any HTTP client: https://api.anyplot.ai/specs/heatmap-calendar/highcharts/code. Any spec id and library id listed in llms-full.txt fit the same URL shape; every URL below is complete and callable.
{
  "spec_id": "heatmap-calendar",
  "language": "javascript",
  "library": "highcharts",
  "page": "https://anyplot.ai/heatmap-calendar/javascript/highcharts",
  "hub": "https://anyplot.ai/heatmap-calendar",
  "code_json": "https://api.anyplot.ai/specs/heatmap-calendar/highcharts/code",
  "spec_json": "https://api.anyplot.ai/specs/heatmap-calendar",
  "render_light_png": "https://storage.googleapis.com/anyplot-images/plots/heatmap-calendar/javascript/highcharts/plot-light.png",
  "render_dark_png": "https://storage.googleapis.com/anyplot-images/plots/heatmap-calendar/javascript/highcharts/plot-dark.png",
  "interactive_light_html": "https://storage.googleapis.com/anyplot-images/plots/heatmap-calendar/javascript/highcharts/plot-light.html",
  "interactive_dark_html": "https://storage.googleapis.com/anyplot-images/plots/heatmap-calendar/javascript/highcharts/plot-dark.html",
  "quality_score": 86.0,
  "license": "MIT",
  "guide": "https://anyplot.ai/llms.txt"
}
Part of Basic Calendar Heatmap on anyplot.ai.