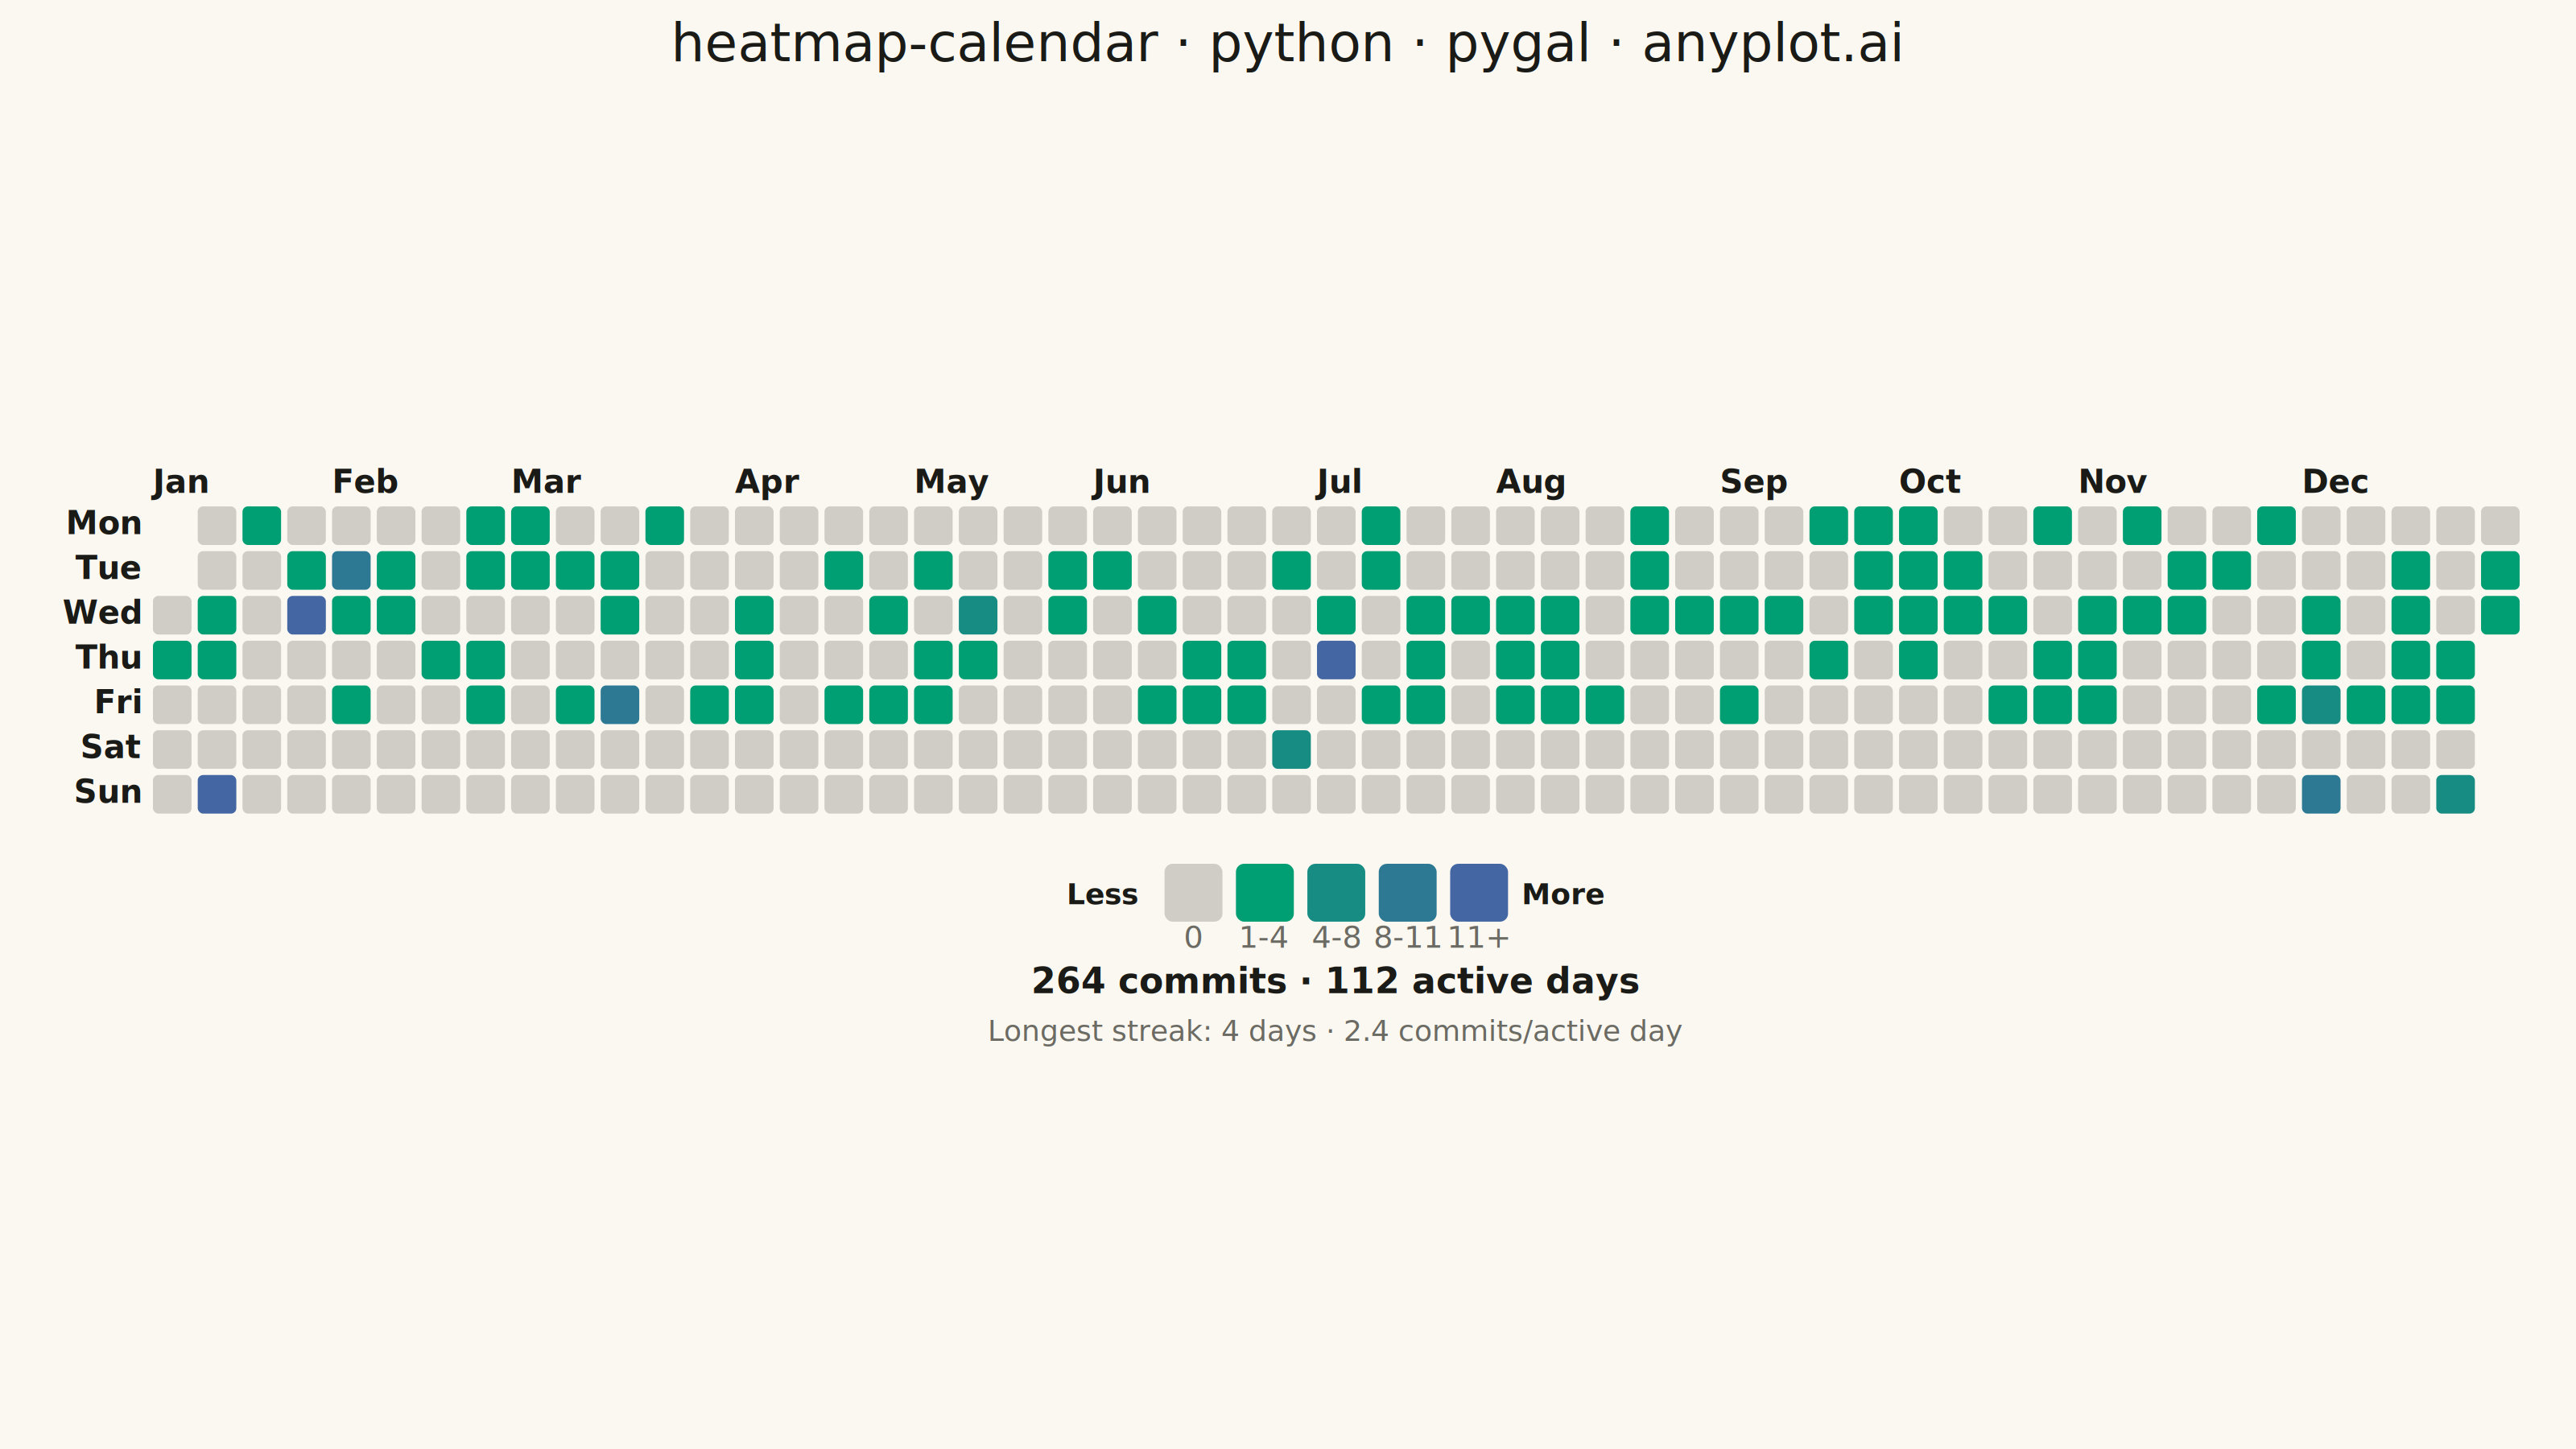
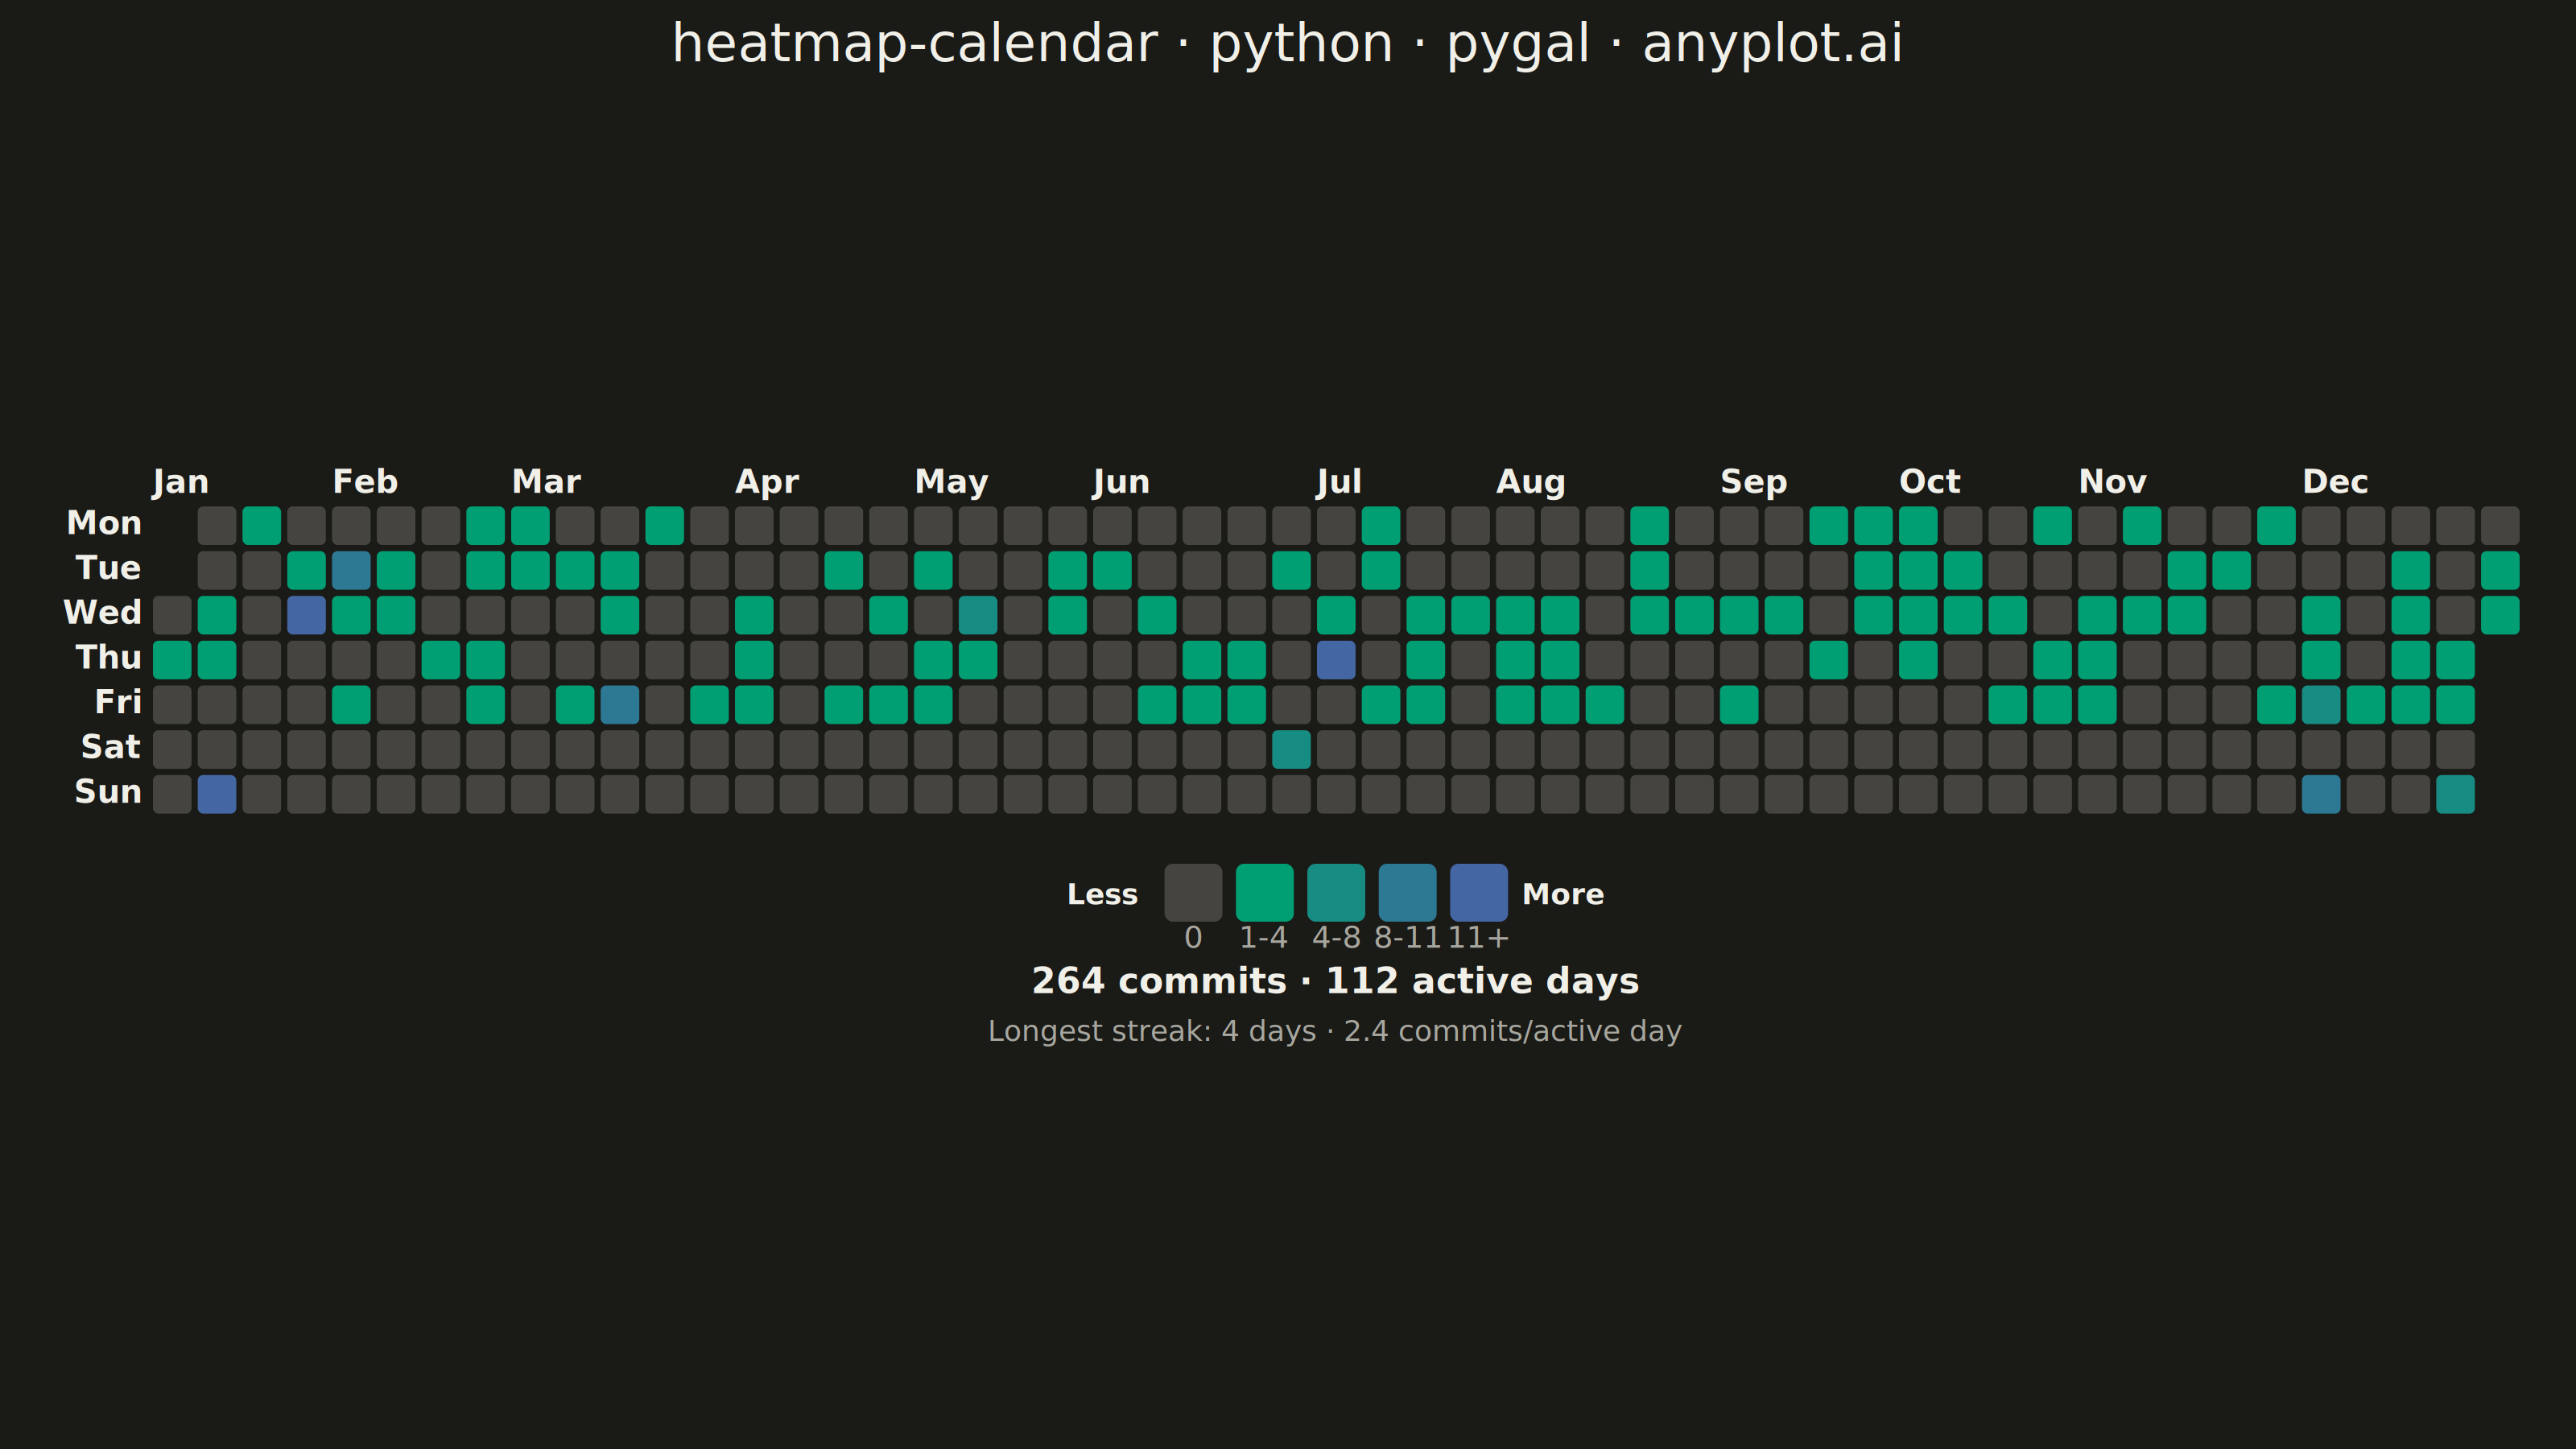
A calendar heatmap visualizes time-series data on a calendar grid, where each day is represented as a cell and color intensity indicates the value magnitude. The layout follows a calendar structure with days as cells, weeks as rows, and months as columns or sections. This visualization excels at revealing daily patterns, seasonal trends, and temporal anomalies over extended time periods.
""" anyplot.ai
heatmap-calendar: Basic Calendar Heatmap
Library: pygal 3.1.3 | Python 3.13.14
Quality: 89/100 | Updated: 2026-07-23
"""

import os
import sys
import xml.etree.ElementTree as ET
from datetime import datetime, timedelta


# This file is named pygal.py, so `import pygal` would resolve to it; drop the
# script's own directory from sys.path so the installed pygal package wins.
sys.path = [p for p in sys.path if os.path.abspath(p or ".") != os.path.dirname(os.path.abspath(__file__))]

import cairosvg
import numpy as np
import pygal
from pygal.style import Style


# Theme tokens
THEME = os.getenv("ANYPLOT_THEME", "light")
PAGE_BG = "#FAF8F1" if THEME == "light" else "#1A1A17"
INK = "#1A1A17" if THEME == "light" else "#F0EFE8"
INK_MUTED = "#6B6A63" if THEME == "light" else "#A8A79F"

# Data — daily coding activity (commits) across calendar year 2025
np.random.seed(42)
start_date = datetime(2025, 1, 1)
end_date = datetime(2025, 12, 31)
n_days = (end_date - start_date).days + 1
day_dates = [start_date + timedelta(days=i) for i in range(n_days)]
weekdays = np.array([d.weekday() for d in day_dates])

base = np.random.choice([0, 0, 1, 2, 3], size=n_days, p=[0.30, 0.20, 0.25, 0.15, 0.10])
spikes = np.random.randint(5, 15, size=n_days)
commits = np.where(weekdays >= 5, 0, base)
commits = np.where(np.random.random(n_days) < 0.05, spikes, commits)
commits = np.where(np.random.random(n_days) < 0.25, 0, commits)

active = commits[commits > 0]
lo, hi = int(active.min()), int(active.max())

# Imprint sequential colormap (brand green → blue) split into 4 activity bins
N_BINS = 4
brand_rgb = np.array([0x00, 0x9E, 0x73])
blue_rgb = np.array([0x44, 0x67, 0xA3])
bin_rgb = np.round(brand_rgb + (blue_rgb - brand_rgb) * np.linspace(0, 1, N_BINS)[:, None]).astype(int)
BIN_COLORS = [f"#{r:02X}{g:02X}{b:02X}" for r, g, b in bin_rgb]

# No-activity cells get a subtle neutral tint (blend of page background + muted ink)
bg_rgb = np.array([int(PAGE_BG[i : i + 2], 16) for i in (1, 3, 5)])
muted_rgb = np.array([int(INK_MUTED[i : i + 2], 16) for i in (1, 3, 5)])
empty_rgb = np.round(bg_rgb + (muted_rgb - bg_rgb) * 0.30).astype(int)
EMPTY_COLOR = f"#{empty_rgb[0]:02X}{empty_rgb[1]:02X}{empty_rgb[2]:02X}"

bin_idx = np.clip(((commits - lo) / max(hi - lo, 1) * N_BINS).astype(int), 0, N_BINS - 1)
cell_colors = [BIN_COLORS[b] if v > 0 else EMPTY_COLOR for v, b in zip(commits, bin_idx, strict=True)]

# Week column per day (Monday-start) + first week each month appears in
first_monday = start_date - timedelta(days=start_date.weekday())
week_idx = np.array([(d - first_monday).days // 7 for d in day_dates])
n_weeks = int(week_idx.max()) + 1

month_starts = {}
for d, w in zip(day_dates, week_idx, strict=True):
    if d.day <= 7:
        month_starts.setdefault((d.year, d.month), w)

# Longest streak of consecutive active days via run-length grouping
active_flag = (commits > 0).astype(int)
group_id = np.cumsum(np.diff(active_flag, prepend=0) != 0)
run_lengths = np.bincount(group_id[active_flag == 1])
longest_streak = int(run_lengths.max()) if run_lengths.size else 0

WEEKDAY_LABELS = ["Mon", "Tue", "Wed", "Thu", "Fri", "Sat", "Sun"]
MONTH_LABELS = ["Jan", "Feb", "Mar", "Apr", "May", "Jun", "Jul", "Aug", "Sep", "Oct", "Nov", "Dec"]

# Title with required language token (48 chars < 67-char baseline → default fontsize)
title = "heatmap-calendar · python · pygal · anyplot.ai"
title_font_size = 66

custom_style = Style(
    background=PAGE_BG,
    plot_background=PAGE_BG,
    foreground=INK,
    foreground_strong=INK,
    foreground_subtle=INK_MUTED,
    colors=("#009E73",),
    title_font_size=title_font_size,
    font_family="DejaVu Sans, Arial, sans-serif",
)

# Landscape canvas — canonical 3200×1800 for the wide 53-week grid
CANVAS_W, CANVAS_H = 3200, 1800

chart = pygal.Bar(
    width=CANVAS_W,
    height=CANVAS_H,
    style=custom_style,
    title=title,
    show_legend=False,
    show_x_labels=False,
    show_y_labels=False,
    show_x_guides=False,
    show_y_guides=False,
    margin=40,
    margin_top=150,
    no_data_text="",
)

# No data added — pygal renders title + background; render_tree() gives the SVG to extend
svg_root = chart.render_tree()

SVG_NS = "{http://www.w3.org/2000/svg}"
for plot_group in list(svg_root.iter(f"{SVG_NS}g")):
    cls = plot_group.attrib.get("class", "")
    if cls.startswith("plot"):
        plot_group.clear()
        plot_group.set("class", cls)

# Grid geometry — cell size is width-constrained by n_weeks columns
LEFT, RIGHT = 190, 70
avail_w = CANVAS_W - LEFT - RIGHT
gap_ratio = 0.16
cell = avail_w / (n_weeks + (n_weeks - 1) * gap_ratio)
gap = cell * gap_ratio
grid_w = n_weeks * cell + (n_weeks - 1) * gap
grid_h = 7 * cell + 6 * gap

fs = max(40, int(cell * 0.62))
fs_legend = max(36, int(cell * 0.56))
fs_stats = max(44, int(cell * 0.62))
legend_cell = cell * 1.5

# Vertically center the whole block (month row + grid + legend + stats) in the
# space below the chart's own title, so the previous title-to-grid gap collapses
# into an even top/bottom margin instead of one lopsided empty band.
month_row_h = cell * 1.05
legend_block_h = cell * 1.3 + legend_cell + fs_legend * 1.1
stats_block_h = cell * 1.0 + fs_stats * 1.35 * 2
block_h = month_row_h + grid_h + legend_block_h + stats_block_h

TOP, BOTTOM = 190, 60
vpad = max(30, (CANVAS_H - TOP - BOTTOM - block_h) / 2)

x0 = LEFT + (avail_w - grid_w) / 2
y0 = TOP + vpad + month_row_h

calendar = ET.SubElement(svg_root, "g", {"class": "calendar-heatmap"})
FONT = "DejaVu Sans, Arial, sans-serif"

# Weekday labels
for i, label in enumerate(WEEKDAY_LABELS):
    node = ET.SubElement(
        calendar,
        "text",
        {
            "x": str(x0 - gap * 2),
            "y": str(y0 + i * (cell + gap) + cell * 0.72),
            "text-anchor": "end",
            "fill": INK,
            "style": f"font-size:{fs}px;font-weight:bold;font-family:{FONT};",
        },
    )
    node.text = label

# Calendar cells
for w, wd, color, day, n in zip(week_idx, weekdays, cell_colors, day_dates, commits, strict=True):
    x = x0 + w * (cell + gap)
    y = y0 + wd * (cell + gap)
    cell_rect = ET.SubElement(
        calendar,
        "rect",
        {
            "x": str(x),
            "y": str(y),
            "width": str(cell),
            "height": str(cell),
            "rx": str(cell * 0.14),
            "ry": str(cell * 0.14),
            "fill": color,
        },
    )
    # pygal's reactive tooltip JS targets its own chart markup, not hand-drawn
    # SVG; a native <title> child gives every cell a browser hover tooltip.
    tooltip_node = ET.SubElement(cell_rect, "title")
    tooltip_node.text = f"{day.strftime('%b %d, %Y')}: {int(n)} commits"

# Month labels (skip any that would collide with the right edge)
right_bound = x0 + grid_w - cell * 2.2
for (_, month), w in month_starts.items():
    mx = x0 + w * (cell + gap)
    if mx > right_bound:
        continue
    node = ET.SubElement(
        calendar,
        "text",
        {
            "x": str(mx),
            "y": str(y0 - gap * 2.2),
            "fill": INK,
            "style": f"font-size:{fs}px;font-weight:bold;font-family:{FONT};",
        },
    )
    node.text = MONTH_LABELS[month - 1]

# Color scale legend
legend_gap = cell * 0.35
legend_colors = [EMPTY_COLOR, *BIN_COLORS]
edges = [round(lo + i * (hi - lo) / N_BINS) for i in range(N_BINS + 1)]
legend_labels = ["0"] + [f"{edges[i]}-{edges[i + 1]}" if i < N_BINS - 1 else f"{edges[i]}+" for i in range(N_BINS)]
lw_total = len(legend_colors) * legend_cell + (len(legend_colors) - 1) * legend_gap
lx = x0 + grid_w / 2 - lw_total / 2
ly = y0 + grid_h + cell * 1.3

less_node = ET.SubElement(
    calendar,
    "text",
    {
        "x": str(lx - legend_gap * 2),
        "y": str(ly + legend_cell * 0.7),
        "text-anchor": "end",
        "fill": INK,
        "style": f"font-size:{fs_legend}px;font-weight:bold;font-family:{FONT};",
    },
)
less_node.text = "Less"

more_node = ET.SubElement(
    calendar,
    "text",
    {
        "x": str(lx + len(legend_colors) * (legend_cell + legend_gap)),
        "y": str(ly + legend_cell * 0.7),
        "text-anchor": "start",
        "fill": INK,
        "style": f"font-size:{fs_legend}px;font-weight:bold;font-family:{FONT};",
    },
)
more_node.text = "More"

for i, (color, label) in enumerate(zip(legend_colors, legend_labels, strict=True)):
    bx = lx + i * (legend_cell + legend_gap)
    ET.SubElement(
        calendar,
        "rect",
        {
            "x": str(bx),
            "y": str(ly),
            "width": str(legend_cell),
            "height": str(legend_cell),
            "rx": str(legend_cell * 0.14),
            "ry": str(legend_cell * 0.14),
            "fill": color,
        },
    )
    label_node = ET.SubElement(
        calendar,
        "text",
        {
            "x": str(bx + legend_cell / 2),
            "y": str(ly + legend_cell + fs_legend * 0.9),
            "text-anchor": "middle",
            "fill": INK_MUTED,
            "style": f"font-size:{max(38, int(fs_legend * 0.78))}px;font-family:{FONT};",
        },
    )
    label_node.text = label

# Summary statistics
total_commits = int(commits.sum())
n_active_days = int((commits > 0).sum())
avg_per_active_day = total_commits / max(n_active_days, 1)
cx = x0 + grid_w / 2
stats_y = ly + legend_cell + fs_legend + cell * 1.1

headline_node = ET.SubElement(
    calendar,
    "text",
    {
        "x": str(cx),
        "y": str(stats_y),
        "text-anchor": "middle",
        "fill": INK,
        "style": f"font-size:{fs_stats}px;font-weight:bold;font-family:{FONT};",
    },
)
headline_node.text = f"{total_commits} commits · {n_active_days} active days"

detail_node = ET.SubElement(
    calendar,
    "text",
    {
        "x": str(cx),
        "y": str(stats_y + fs_stats * 1.35),
        "text-anchor": "middle",
        "fill": INK_MUTED,
        "style": f"font-size:{int(fs_stats * 0.82)}px;font-family:{FONT};",
    },
)
detail_node.text = f"Longest streak: {longest_streak} days · {avg_per_active_day:.1f} commits/active day"

# Save
svg_bytes = ET.tostring(svg_root, xml_declaration=True, encoding="utf-8")
cairosvg.svg2png(bytestring=svg_bytes, write_to=f"plot-{THEME}.png", output_width=CANVAS_W, output_height=CANVAS_H)

html_page = (
    f'<!DOCTYPE html><html><head><meta charset="utf-8">'
    f"<title>heatmap-calendar · python · pygal · anyplot.ai</title></head>"
    f'<body style="margin:0;background:{PAGE_BG};display:flex;'
    f'justify-content:center;align-items:center;min-height:100vh;">'
    f"{svg_bytes.decode('utf-8')}"
    f"</body></html>"
)
with open(f"plot-{THEME}.html", "w", encoding="utf-8") as f:
    f.write(html_page)
Runnable source as JSON, for any HTTP client: https://api.anyplot.ai/specs/heatmap-calendar/pygal/code. Any spec id and library id listed in llms-full.txt fit the same URL shape; every URL below is complete and callable.
{
  "spec_id": "heatmap-calendar",
  "language": "python",
  "library": "pygal",
  "page": "https://anyplot.ai/heatmap-calendar/python/pygal",
  "hub": "https://anyplot.ai/heatmap-calendar",
  "code_json": "https://api.anyplot.ai/specs/heatmap-calendar/pygal/code",
  "spec_json": "https://api.anyplot.ai/specs/heatmap-calendar",
  "render_light_png": "https://storage.googleapis.com/anyplot-images/plots/heatmap-calendar/python/pygal/plot-light.png",
  "render_dark_png": "https://storage.googleapis.com/anyplot-images/plots/heatmap-calendar/python/pygal/plot-dark.png",
  "interactive_light_html": "https://storage.googleapis.com/anyplot-images/plots/heatmap-calendar/python/pygal/plot-light.html",
  "interactive_dark_html": "https://storage.googleapis.com/anyplot-images/plots/heatmap-calendar/python/pygal/plot-dark.html",
  "quality_score": 89.0,
  "license": "MIT",
  "guide": "https://anyplot.ai/llms.txt"
}
Part of Basic Calendar Heatmap on anyplot.ai.