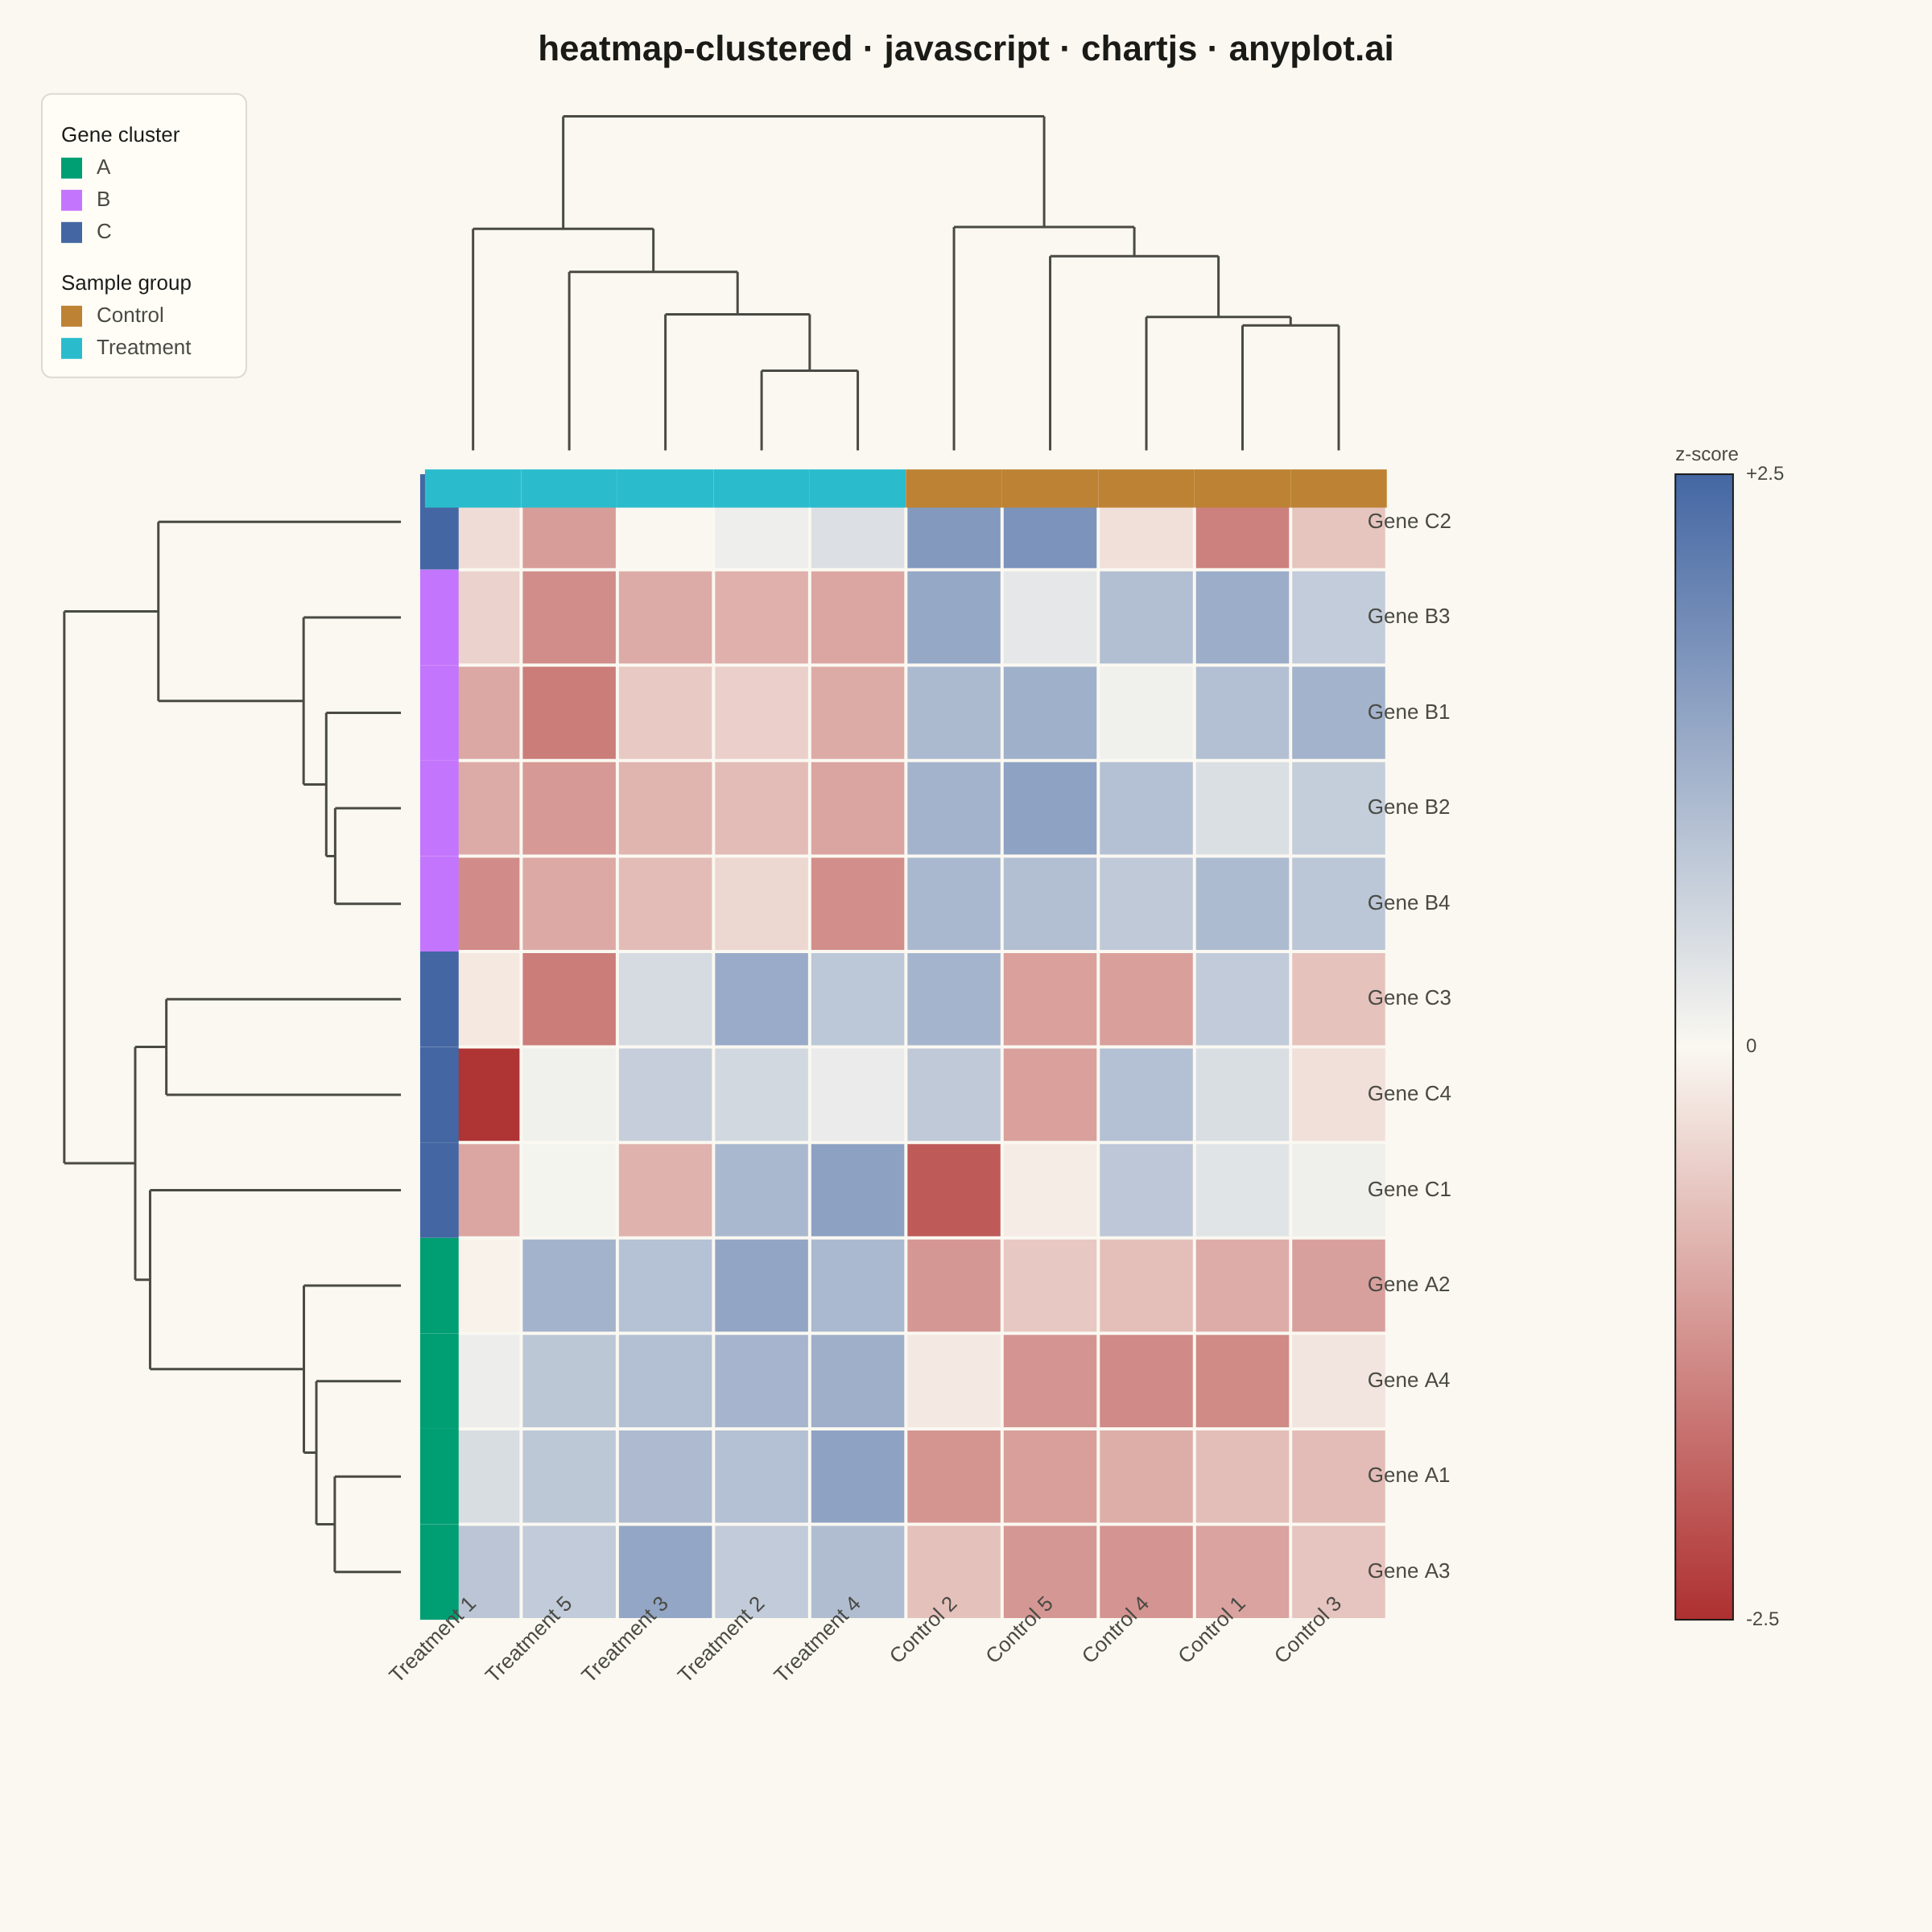
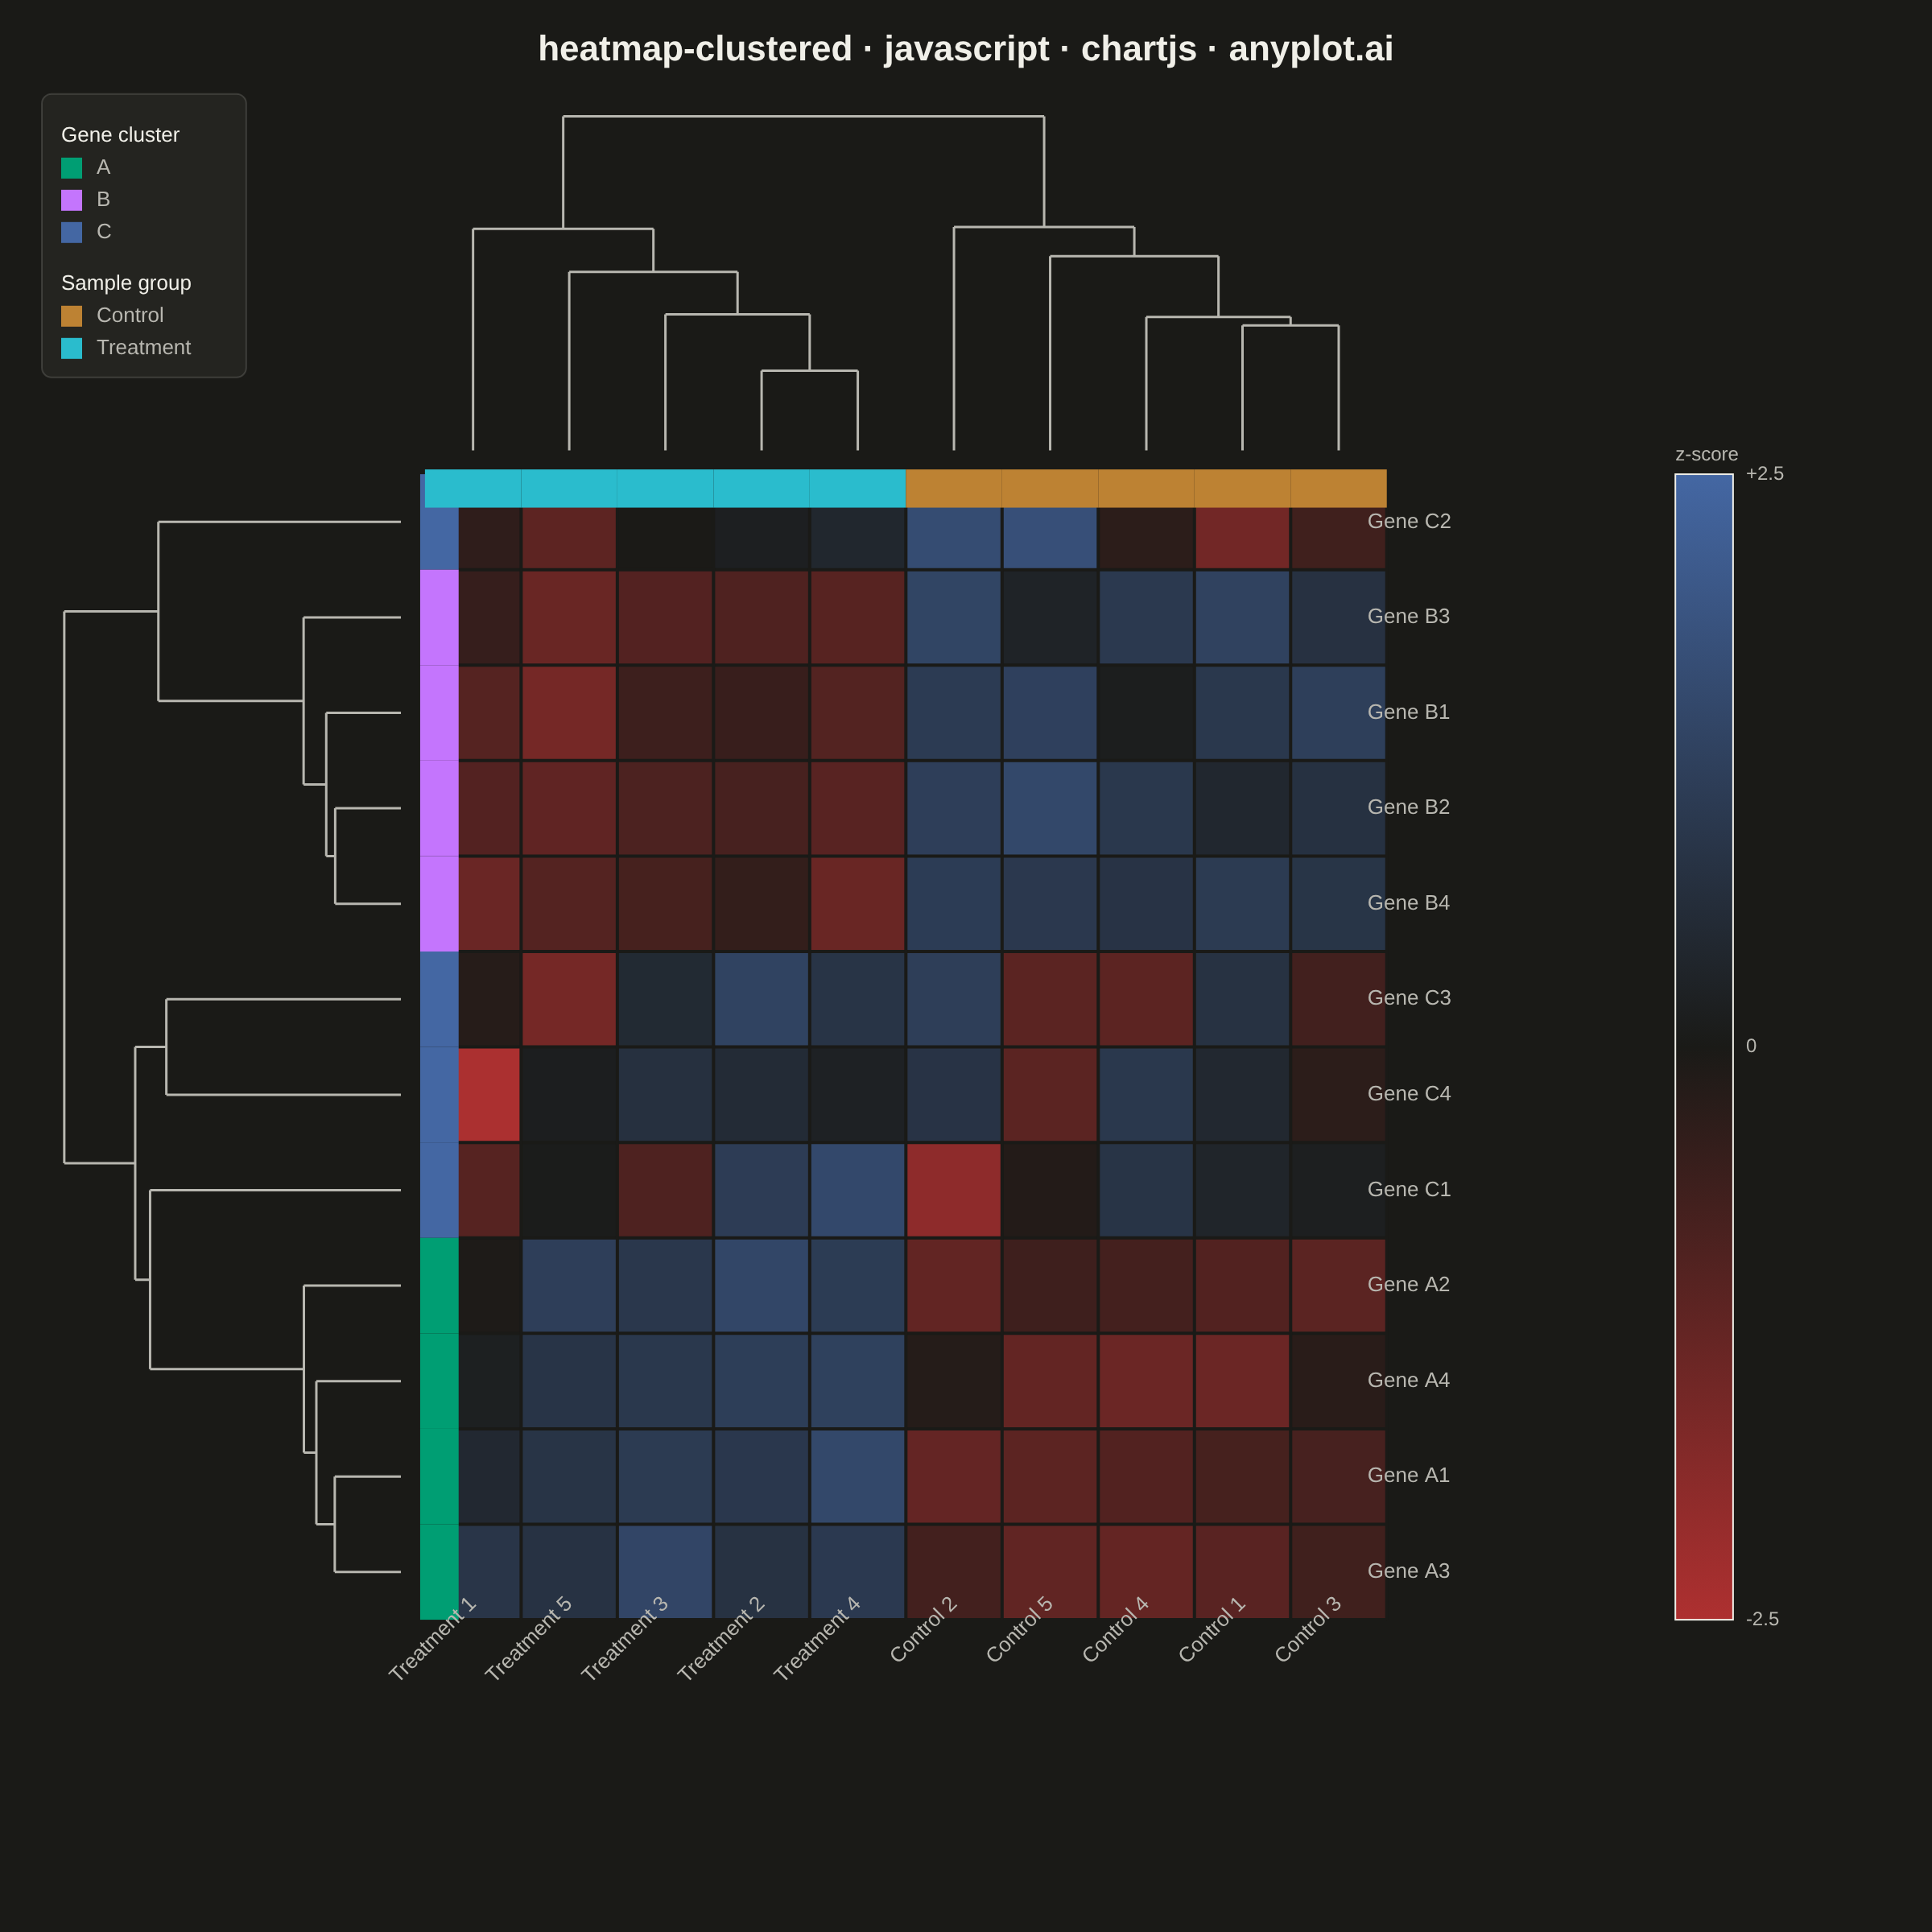
The same plot in 14 other libraries — JavaScript: D3.js, Apache ECharts, Highcharts, MUI X Charts; Python: Altair, Bokeh, lets-plot, Matplotlib, Plotly, plotnine, Pygal, Seaborn; R: ggplot2; Julia: Makie.jl. Compare all 15 side by side: Clustered Heatmap in Python, R, Julia and JavaScript.
A heatmap with hierarchical clustering dendrograms on both rows and columns, showing both data values and their hierarchical relationships. Rows and columns are automatically reordered based on clustering results to reveal natural groupings in the data. Essential for discovering patterns in high-dimensional data where similar observations or variables should be visually grouped together.
// anyplot.ai
// heatmap-clustered: Clustered Heatmap
// Library: chartjs 4.4.7 | JavaScript 22.23.2
// Quality: 90/100 | Created: 2026-09-05

//# anyplot-orientation: square
const t = window.ANYPLOT_TOKENS;

// --- Data: gene expression matrix (deterministic, fixed-seed LCG) ----------
const N_ROWS = 12; // genes
const N_COLS = 10; // samples
const GENE_GROUPS = ["A", "A", "A", "A", "B", "B", "B", "B", "C", "C", "C", "C"];
const SAMPLE_GROUPS = ["Control", "Control", "Control", "Control", "Control",
  "Treatment", "Treatment", "Treatment", "Treatment", "Treatment"];
const PATTERN = {
  A: { Control: -1.1, Treatment: 1.1 },
  B: { Control: 1.1, Treatment: -1.1 },
  C: { Control: 0, Treatment: 0 },
};

let lcgState = 42;
function rand() {
  lcgState = (lcgState * 1664525 + 1013904223) >>> 0;
  return lcgState / 4294967296;
}
function gauss() {
  const u1 = Math.max(rand(), 1e-9);
  const u2 = rand();
  return Math.sqrt(-2 * Math.log(u1)) * Math.cos(2 * Math.PI * u2);
}

const rawMatrix = [];
const rawRowLabels = [];
const groupCounters = { A: 0, B: 0, C: 0 };
for (let i = 0; i < N_ROWS; i++) {
  const group = GENE_GROUPS[i];
  groupCounters[group] += 1;
  rawRowLabels.push(`Gene ${group}${groupCounters[group]}`);
  const row = [];
  for (let j = 0; j < N_COLS; j++) {
    const sample = SAMPLE_GROUPS[j];
    const noiseScale = group === "C" ? 0.9 : 0.45;
    row.push(PATTERN[group][sample] + gauss() * noiseScale);
  }
  rawMatrix.push(row);
}
const sampleCounters = { Control: 0, Treatment: 0 };
const rawColLabels = SAMPLE_GROUPS.map((s) => {
  sampleCounters[s] += 1;
  return `${s} ${sampleCounters[s]}`;
});

// Per-row z-score standardization (subtract row mean, divide by row std) —
// the colorbar and tooltips report "z-score", so the values actually shown
// must be standardized, not the raw synthetic pattern.
function standardizeRows(m) {
  return m.map((row) => {
    const mean = row.reduce((s, v) => s + v, 0) / row.length;
    const variance = row.reduce((s, v) => s + (v - mean) ** 2, 0) / row.length;
    const std = Math.sqrt(variance) || 1;
    return row.map((v) => (v - mean) / std);
  });
}
const zMatrix = standardizeRows(rawMatrix);

// --- Hierarchical clustering (average-linkage / UPGMA, Euclidean) ---------
// UPGMA is used instead of Ward's method (the spec's suggested default): its
// merge-height update is a simple weighted average, which keeps the from-scratch
// clustering implementation compact and easy to verify, while still producing
// well-separated, valid dendrograms for this matrix.
function euclidean(a, b) {
  let sum = 0;
  for (let i = 0; i < a.length; i++) sum += (a[i] - b[i]) ** 2;
  return Math.sqrt(sum);
}

function hierarchicalClustering(vectors) {
  const n = vectors.length;
  const key = (a, b) => (a < b ? `${a},${b}` : `${b},${a}`);
  const dist = new Map();
  for (let i = 0; i < n; i++) {
    for (let j = i + 1; j < n; j++) dist.set(key(i, j), euclidean(vectors[i], vectors[j]));
  }
  const size = {};
  for (let i = 0; i < n; i++) size[i] = 1;
  const nodes = {};
  let active = Array.from({ length: n }, (_, i) => i);
  let nextId = n;
  while (active.length > 1) {
    let best = null;
    for (let i = 0; i < active.length; i++) {
      for (let j = i + 1; j < active.length; j++) {
        const a = active[i];
        const b = active[j];
        const d = dist.get(key(a, b));
        if (best === null || d < best.d) best = { a, b, d };
      }
    }
    const { a, b, d } = best;
    const id = nextId++;
    nodes[id] = { left: a, right: b, height: d };
    size[id] = size[a] + size[b];
    for (const c of active) {
      if (c === a || c === b) continue;
      const merged = (size[a] * dist.get(key(a, c)) + size[b] * dist.get(key(b, c))) / (size[a] + size[b]);
      dist.set(key(id, c), merged);
    }
    active = active.filter((c) => c !== a && c !== b);
    active.push(id);
  }
  const root = active[0];
  const order = [];
  (function leafOrder(id) {
    if (id < n) { order.push(id); return; }
    leafOrder(nodes[id].left);
    leafOrder(nodes[id].right);
  })(root);
  return { n, nodes, root, order };
}

// Walks a cluster tree into dendrogram line segments (null-separated, ready
// for a Chart.js `line` dataset). `toPoint(position, normalizedHeight)` maps
// leaf order + merge height onto plot coordinates.
function dendrogramSegments(clusterResult, toPoint) {
  const { n, nodes, root } = clusterResult;
  const maxHeight = nodes[root].height || 1;
  const orderIndex = new Array(n);
  clusterResult.order.forEach((leaf, i) => { orderIndex[leaf] = i; });
  const points = [];
  function walk(id) {
    if (id < n) return { pos: orderIndex[id], h: 0 };
    const node = nodes[id];
    const left = walk(node.left);
    const right = walk(node.right);
    const h = node.height / maxHeight;
    const gap = (after) => ({ x: after.x, y: null });
    let p = toPoint(left.pos, left.h);
    points.push(p, (p = toPoint(left.pos, h)), gap(p));
    points.push((p = toPoint(right.pos, right.h)), (p = toPoint(right.pos, h)), gap(p));
    points.push((p = toPoint(left.pos, h)), (p = toPoint(right.pos, h)), gap(p));
    return { pos: (left.pos + right.pos) / 2, h };
  }
  walk(root);
  return points;
}

const rowClusters = hierarchicalClustering(zMatrix);
const colClusters = hierarchicalClustering(zMatrix[0].map((_, j) => zMatrix.map((row) => row[j])));

const rowOrder = rowClusters.order;
const colOrder = colClusters.order;
const matrix = rowOrder.map((ri) => colOrder.map((ci) => zMatrix[ri][ci]));
const rowLabels = rowOrder.map((ri) => rawRowLabels[ri]);
const colLabels = colOrder.map((ci) => rawColLabels[ci]);
const rowGeneGroup = rowOrder.map((ri) => GENE_GROUPS[ri]);
const colSampleGroup = colOrder.map((ci) => SAMPLE_GROUPS[ci]);

let maxAbs = 0;
matrix.forEach((row) => row.forEach((v) => { maxAbs = Math.max(maxAbs, Math.abs(v)); }));
maxAbs = Math.ceil(maxAbs * 10) / 10;

// --- Layout (data-unit coordinates: columns 0..N_COLS-1, rows top-to-bottom) --
const ANNO_W = 0.4;
const ANNO_GAP = 0.15;
const DENDRO_GAP = 0.2;
const DENDRO_BAND = 3.5;
const ROW_LABEL_GAP = 0.3;
const ROW_LABEL_W = 2.6;
const CBAR_GAP = 0.6;
const CBAR_W = 0.6;
const CBAR_LABEL_W = 1.4;
const COL_LABEL_GAP = 0.3;
const COL_LABEL_H = 2.8;
const PAD = 0.3;

const topRowY = N_ROWS - 1; // y-value of row 0 (top row of the heatmap)
const rowAnnoLeft = -(ANNO_GAP + ANNO_W);
const rowAnnoRight = -ANNO_GAP;
const rowDendroLeafX = rowAnnoLeft - DENDRO_GAP;
const colAnnoBottom = topRowY + ANNO_GAP;
const colAnnoTop = colAnnoBottom + ANNO_W;
const colDendroLeafY = colAnnoTop + DENDRO_GAP;

const xMin = rowDendroLeafX - DENDRO_BAND - PAD;
const xMax = N_COLS - 1 + ROW_LABEL_GAP + ROW_LABEL_W + CBAR_GAP + CBAR_W + CBAR_LABEL_W + PAD;
const yMin = -(COL_LABEL_GAP + COL_LABEL_H + PAD);
const yMax = colDendroLeafY + DENDRO_BAND + PAD;

const colDendroPoints = dendrogramSegments(colClusters, (pos, h) => ({ x: pos, y: colDendroLeafY + h * DENDRO_BAND }));
const rowDendroPoints = dendrogramSegments(rowClusters, (pos, h) => ({ x: rowDendroLeafX - h * DENDRO_BAND, y: topRowY - pos }));

const cellPoints = [];
for (let i = 0; i < N_ROWS; i++) {
  for (let j = 0; j < N_COLS; j++) {
    cellPoints.push({ x: j, y: topRowY - i, v: matrix[i][j], row: rowLabels[i], col: colLabels[j] });
  }
}

const geneGroupColor = { A: t.palette[0], B: t.palette[1], C: t.palette[2] };
const sampleGroupColor = { Control: t.palette[3], Treatment: t.palette[5] };

// --- Diverging color scale (Imprint imprint_div, theme-adaptive midpoint) --
function hexToRgb(hex) {
  const n = parseInt(hex.slice(1), 16);
  return [(n >> 16) & 255, (n >> 8) & 255, n & 255];
}
function mixColor(c1, c2, ratio) {
  const [r1, g1, b1] = hexToRgb(c1);
  const [r2, g2, b2] = hexToRgb(c2);
  const mix = (a, b) => Math.round(a + (b - a) * ratio);
  return `rgb(${mix(r1, r2)}, ${mix(g1, g2)}, ${mix(b1, b2)})`;
}
function divergingColor(value) {
  const v = Math.max(-1, Math.min(1, value / maxAbs));
  return v < 0 ? mixColor(t.div[0], t.div[1], v + 1) : mixColor(t.div[1], t.div[2], v);
}

// --- Custom draw: heatmap cells, annotation bars, labels, colorbar, legend --
const clusteredHeatmapPlugin = {
  id: "clusteredHeatmap",
  afterDatasetsDraw(chart) {
    const { ctx, chartArea, scales } = chart;
    const px = (x) => scales.x.getPixelForValue(x);
    const py = (y) => scales.y.getPixelForValue(y);

    ctx.save();

    // Heatmap cells
    for (let i = 0; i < N_ROWS; i++) {
      const yTop = py(topRowY - i + 0.5);
      const yBottom = py(topRowY - i - 0.5);
      for (let j = 0; j < N_COLS; j++) {
        const xLeft = px(j - 0.5);
        const xRight = px(j + 0.5);
        ctx.fillStyle = divergingColor(matrix[i][j]);
        ctx.fillRect(Math.min(xLeft, xRight), Math.min(yTop, yBottom), Math.abs(xRight - xLeft), Math.abs(yBottom - yTop));
      }
    }

    // Cell separators (page-background gridlines)
    ctx.strokeStyle = t.pageBg;
    ctx.lineWidth = 2;
    for (let i = 0; i <= N_ROWS; i++) {
      const y = py(topRowY - i + 0.5);
      ctx.beginPath();
      ctx.moveTo(px(-0.5), y);
      ctx.lineTo(px(N_COLS - 0.5), y);
      ctx.stroke();
    }
    for (let j = 0; j <= N_COLS; j++) {
      const x = px(j - 0.5);
      ctx.beginPath();
      ctx.moveTo(x, py(topRowY + 0.5));
      ctx.lineTo(x, py(-0.5));
      ctx.stroke();
    }

    // Gene-group annotation strip (left of the heatmap)
    const rowAnnoX1 = px(rowAnnoLeft);
    const rowAnnoX2 = px(rowAnnoRight);
    for (let i = 0; i < N_ROWS; i++) {
      const yTop = py(topRowY - i + 0.5);
      const yBottom = py(topRowY - i - 0.5);
      ctx.fillStyle = geneGroupColor[rowGeneGroup[i]];
      ctx.fillRect(Math.min(rowAnnoX1, rowAnnoX2), Math.min(yTop, yBottom), Math.abs(rowAnnoX2 - rowAnnoX1), Math.abs(yBottom - yTop));
    }

    // Sample-group annotation strip (above the heatmap)
    const colAnnoY1 = py(colAnnoBottom);
    const colAnnoY2 = py(colAnnoTop);
    for (let j = 0; j < N_COLS; j++) {
      const xLeft = px(j - 0.5);
      const xRight = px(j + 0.5);
      ctx.fillStyle = sampleGroupColor[colSampleGroup[j]];
      ctx.fillRect(Math.min(xLeft, xRight), Math.min(colAnnoY1, colAnnoY2), Math.abs(xRight - xLeft), Math.abs(colAnnoY2 - colAnnoY1));
    }

    // Row (gene) labels
    ctx.fillStyle = t.inkSoft;
    ctx.font = "13px sans-serif";
    ctx.textAlign = "left";
    ctx.textBaseline = "middle";
    const rowLabelX = px(N_COLS - 1 + ROW_LABEL_GAP);
    for (let i = 0; i < N_ROWS; i++) ctx.fillText(rowLabels[i], rowLabelX, py(topRowY - i));

    // Column (sample) labels, rotated
    ctx.textAlign = "right";
    const colLabelY = py(-COL_LABEL_GAP);
    for (let j = 0; j < N_COLS; j++) {
      ctx.save();
      ctx.translate(px(j), colLabelY);
      ctx.rotate(-Math.PI / 4);
      ctx.fillText(colLabels[j], 0, 0);
      ctx.restore();
    }

    // Colorbar (z-score scale)
    const cbarBase = N_COLS - 1 + ROW_LABEL_GAP + ROW_LABEL_W + CBAR_GAP;
    const cbarX1 = px(cbarBase);
    const cbarX2 = px(cbarBase + CBAR_W);
    const cbarYTop = py(topRowY + 0.5);
    const cbarYBottom = py(-0.5);
    const gradient = ctx.createLinearGradient(0, cbarYTop, 0, cbarYBottom);
    gradient.addColorStop(0, t.div[2]);
    gradient.addColorStop(0.5, t.div[1]);
    gradient.addColorStop(1, t.div[0]);
    ctx.fillStyle = gradient;
    ctx.fillRect(Math.min(cbarX1, cbarX2), cbarYTop, Math.abs(cbarX2 - cbarX1), cbarYBottom - cbarYTop);
    ctx.strokeStyle = t.ink;
    ctx.lineWidth = 1;
    ctx.strokeRect(Math.min(cbarX1, cbarX2), cbarYTop, Math.abs(cbarX2 - cbarX1), cbarYBottom - cbarYTop);

    ctx.fillStyle = t.inkSoft;
    ctx.font = "12px sans-serif";
    ctx.textAlign = "left";
    ctx.textBaseline = "middle";
    const cbarLabelX = Math.max(cbarX1, cbarX2) + 8;
    ctx.fillText(`+${maxAbs.toFixed(1)}`, cbarLabelX, cbarYTop);
    ctx.fillText("0", cbarLabelX, (cbarYTop + cbarYBottom) / 2);
    ctx.fillText(`-${maxAbs.toFixed(1)}`, cbarLabelX, cbarYBottom);
    ctx.textBaseline = "bottom";
    ctx.fillText("z-score", Math.min(cbarX1, cbarX2), cbarYTop - 6);

    // Group legend (top-left corner, outside both dendrograms) — an elevated
    // panel with aligned swatch/label columns so it reads as one polished block.
    const swatchSize = 13;
    const swatchGap = 9;
    const rowStep = 20;
    const sectionGap = 12;
    const panelPad = 12;
    ctx.font = "13px sans-serif";
    const legendSections = [
      { header: "Gene cluster", rows: ["A", "B", "C"].map((g) => [g, geneGroupColor[g]]) },
      {
        header: "Sample group",
        rows: [["Control", sampleGroupColor.Control], ["Treatment", sampleGroupColor.Treatment]],
      },
    ];
    let maxTextWidth = 0;
    legendSections.forEach((section) => {
      maxTextWidth = Math.max(maxTextWidth, ctx.measureText(section.header).width);
      section.rows.forEach(([label]) => {
        maxTextWidth = Math.max(maxTextWidth, ctx.measureText(label).width);
      });
    });
    const panelW = panelPad * 2 + swatchSize + swatchGap + maxTextWidth;
    const panelH =
      panelPad * 2 +
      legendSections.reduce((sum, section) => sum + rowStep * (1 + section.rows.length), 0) +
      sectionGap * (legendSections.length - 1);
    const panelX = chartArea.left + 4;
    const panelY = chartArea.top + 4;

    ctx.fillStyle = t.elevatedBg;
    ctx.strokeStyle = t.grid;
    ctx.lineWidth = 1;
    ctx.beginPath();
    ctx.roundRect(panelX, panelY, panelW, panelH, 6);
    ctx.fill();
    ctx.stroke();

    ctx.textAlign = "left";
    ctx.textBaseline = "middle";
    const legendX = panelX + panelPad;
    let legendY = panelY + panelPad + rowStep * 0.7;
    legendSections.forEach((section, idx) => {
      ctx.fillStyle = t.ink;
      ctx.fillText(section.header, legendX, legendY);
      legendY += rowStep;
      section.rows.forEach(([label, color]) => {
        ctx.fillStyle = color;
        ctx.fillRect(legendX, legendY - swatchSize / 2, swatchSize, swatchSize);
        ctx.fillStyle = t.inkSoft;
        ctx.fillText(label, legendX + swatchSize + swatchGap, legendY);
        legendY += rowStep;
      });
      if (idx < legendSections.length - 1) legendY += sectionGap;
    });

    ctx.restore();
  },
};

// --- Mount + chart -----------------------------------------------------------
const canvas = document.createElement("canvas");
document.getElementById("container").appendChild(canvas);

const title = "heatmap-clustered · javascript · chartjs · anyplot.ai";
const titleFontSize = Math.round(22 * Math.min(1, 67 / title.length));

new Chart(canvas, {
  type: "scatter",
  data: {
    datasets: [
      {
        label: "Expression",
        data: cellPoints,
        pointRadius: 22,
        pointHoverRadius: 22,
        backgroundColor: "transparent",
        borderWidth: 0,
      },
      {
        type: "line",
        label: "Sample clustering",
        data: colDendroPoints,
        borderColor: t.inkSoft,
        borderWidth: 1.5,
        pointRadius: 0,
        fill: false,
        spanGaps: false,
        tension: 0,
      },
      {
        type: "line",
        label: "Gene clustering",
        data: rowDendroPoints,
        borderColor: t.inkSoft,
        borderWidth: 1.5,
        pointRadius: 0,
        fill: false,
        spanGaps: false,
        tension: 0,
      },
    ],
  },
  options: {
    responsive: true,
    maintainAspectRatio: false,
    animation: false,
    interaction: { mode: "nearest", intersect: true },
    layout: { padding: 8 },
    plugins: {
      title: { display: true, text: title, color: t.ink, font: { size: titleFontSize } },
      legend: { display: false },
      tooltip: {
        filter: (item) => item.datasetIndex === 0,
        callbacks: {
          title: (items) => `${items[0].raw.row} × ${items[0].raw.col}`,
          label: (item) => `z-score: ${item.raw.v.toFixed(2)}`,
        },
      },
    },
    scales: {
      x: { type: "linear", min: xMin, max: xMax, display: false, grid: { display: false } },
      y: { type: "linear", min: yMin, max: yMax, display: false, grid: { display: false } },
    },
  },
  plugins: [clusteredHeatmapPlugin],
});
Runnable source as JSON, for any HTTP client: https://api.anyplot.ai/specs/heatmap-clustered/chartjs/code. Any spec id and library id listed in llms-full.txt fit the same URL shape; every URL below is complete and callable.
{
  "spec_id": "heatmap-clustered",
  "language": "javascript",
  "library": "chartjs",
  "page": "https://anyplot.ai/heatmap-clustered/javascript/chartjs",
  "hub": "https://anyplot.ai/heatmap-clustered",
  "code_json": "https://api.anyplot.ai/specs/heatmap-clustered/chartjs/code",
  "spec_json": "https://api.anyplot.ai/specs/heatmap-clustered",
  "render_light_png": "https://storage.googleapis.com/anyplot-images/plots/heatmap-clustered/javascript/chartjs/plot-light.png",
  "render_dark_png": "https://storage.googleapis.com/anyplot-images/plots/heatmap-clustered/javascript/chartjs/plot-dark.png",
  "interactive_light_html": "https://storage.googleapis.com/anyplot-images/plots/heatmap-clustered/javascript/chartjs/plot-light.html",
  "interactive_dark_html": "https://storage.googleapis.com/anyplot-images/plots/heatmap-clustered/javascript/chartjs/plot-dark.html",
  "quality_score": 90.0,
  "license": "MIT",
  "guide": "https://anyplot.ai/llms.txt"
}
Part of Clustered Heatmap on anyplot.ai.