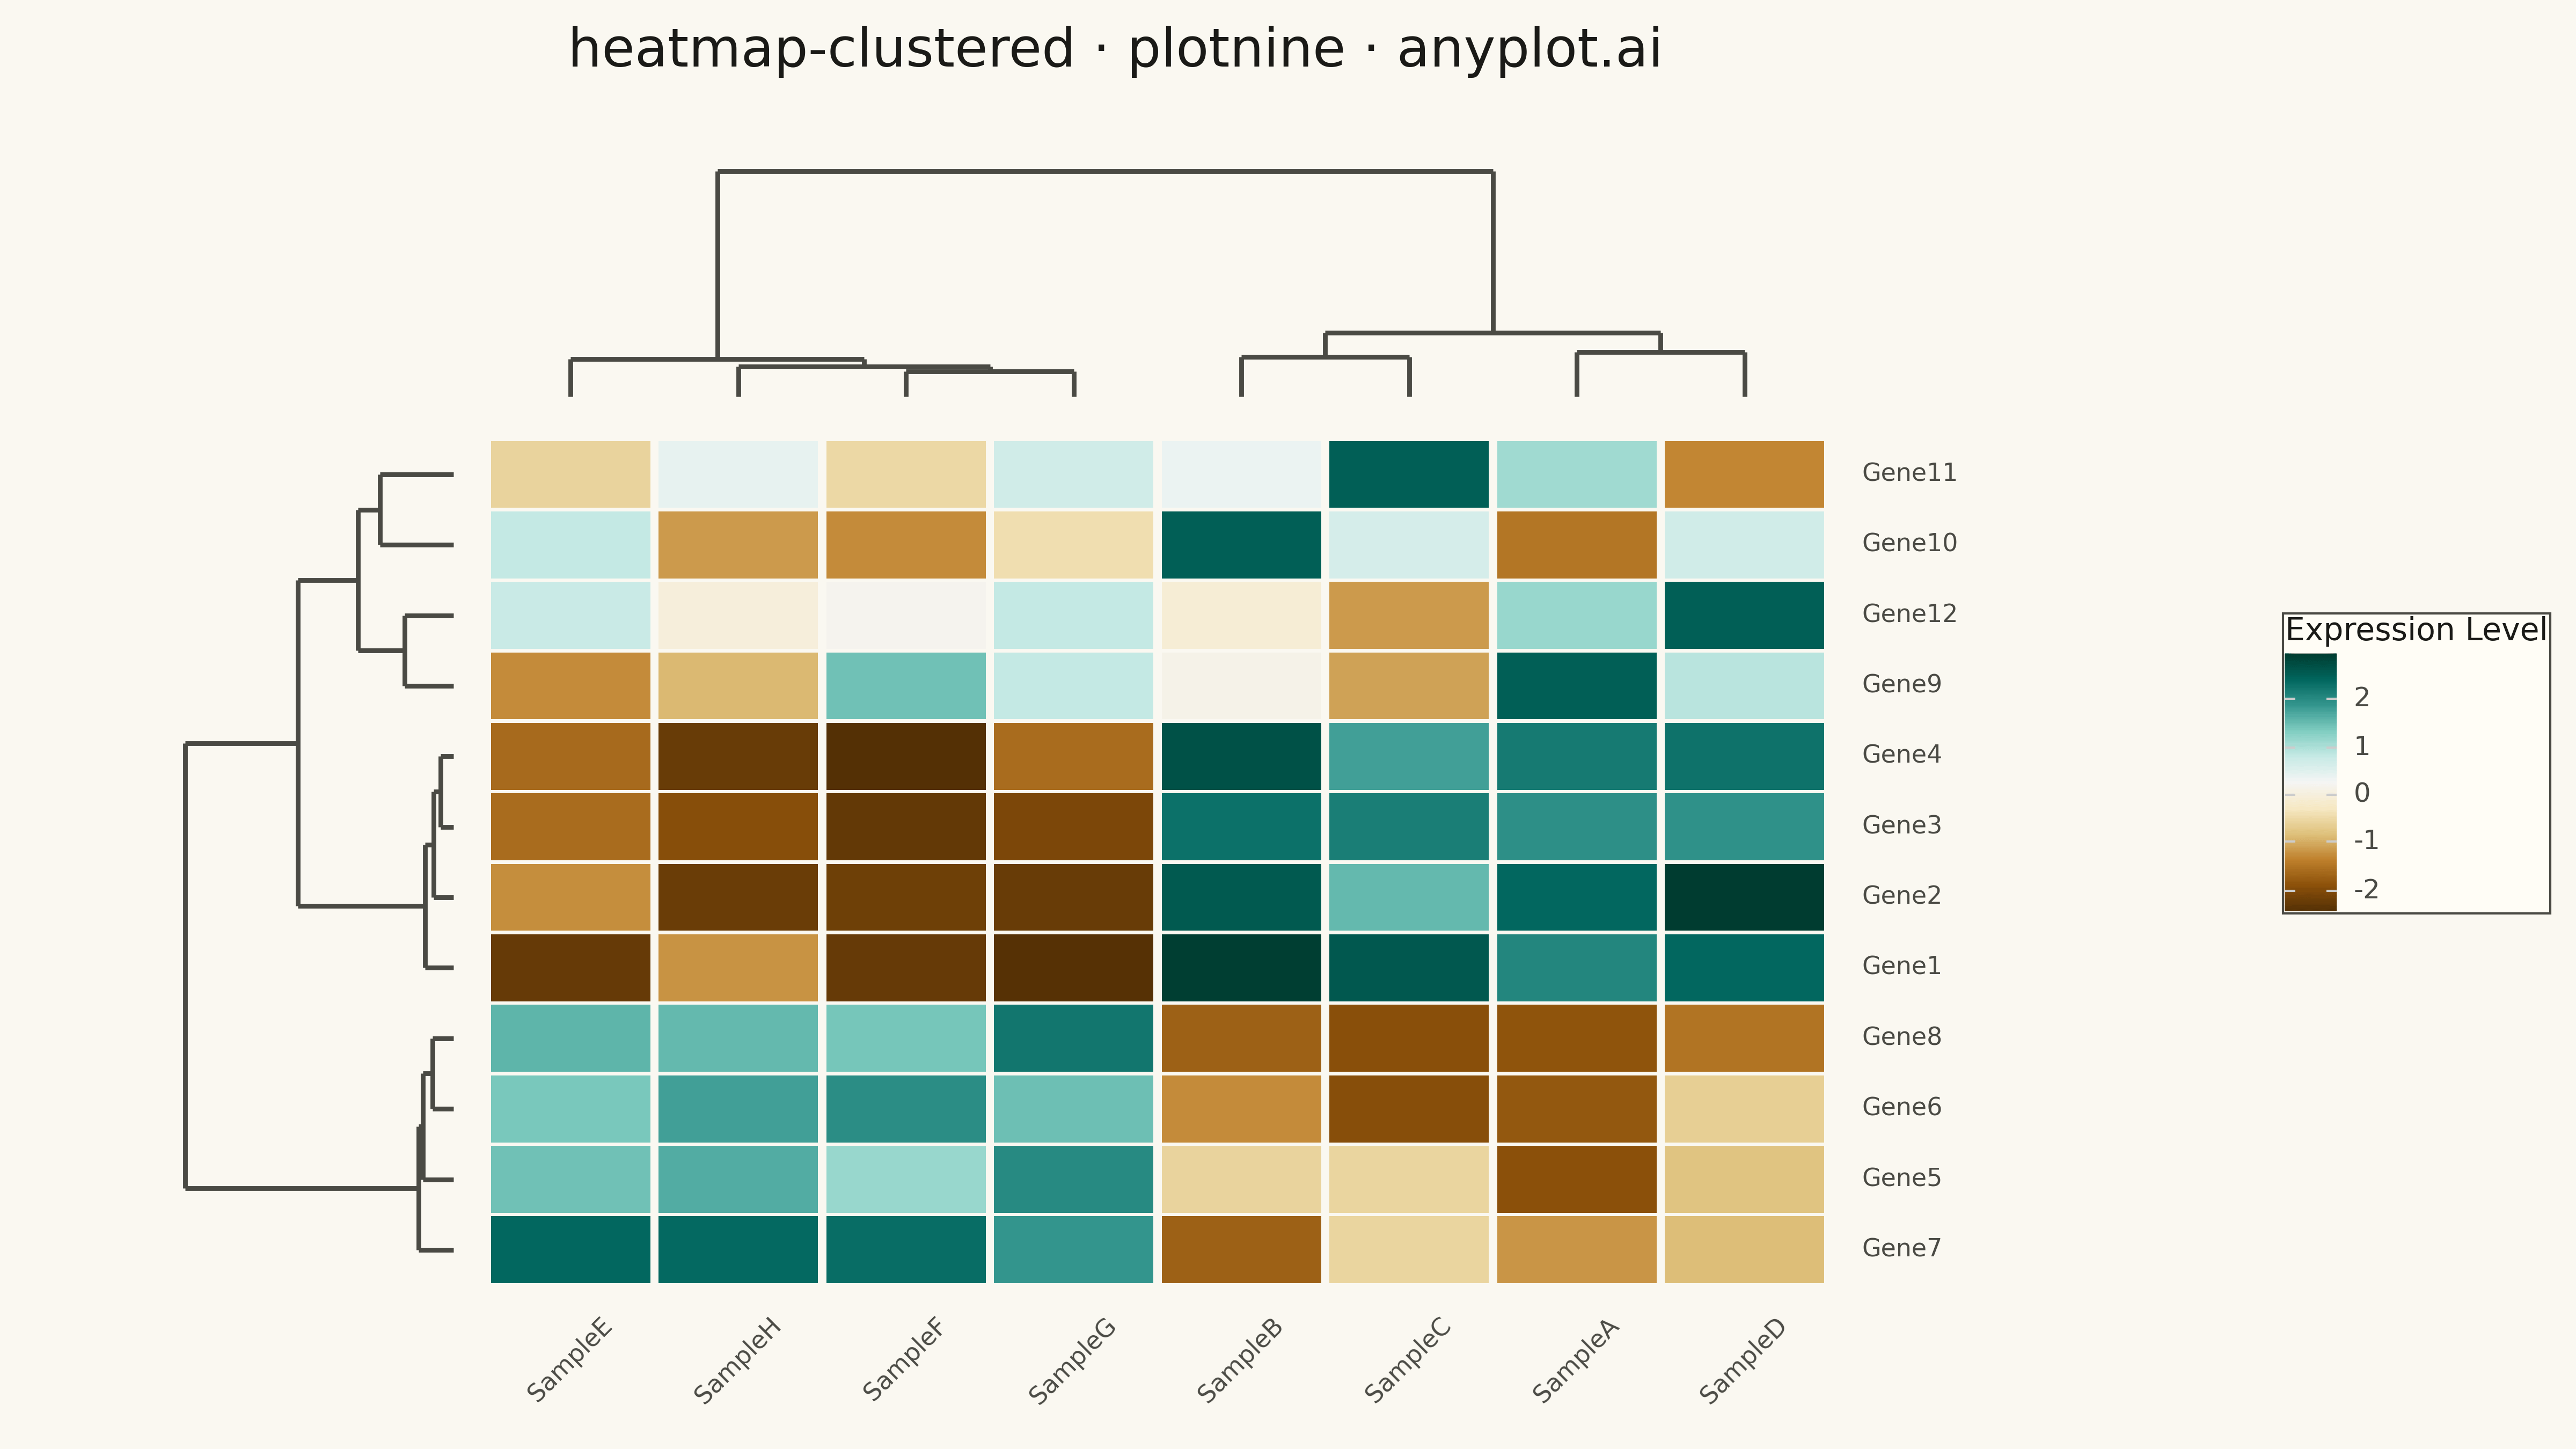
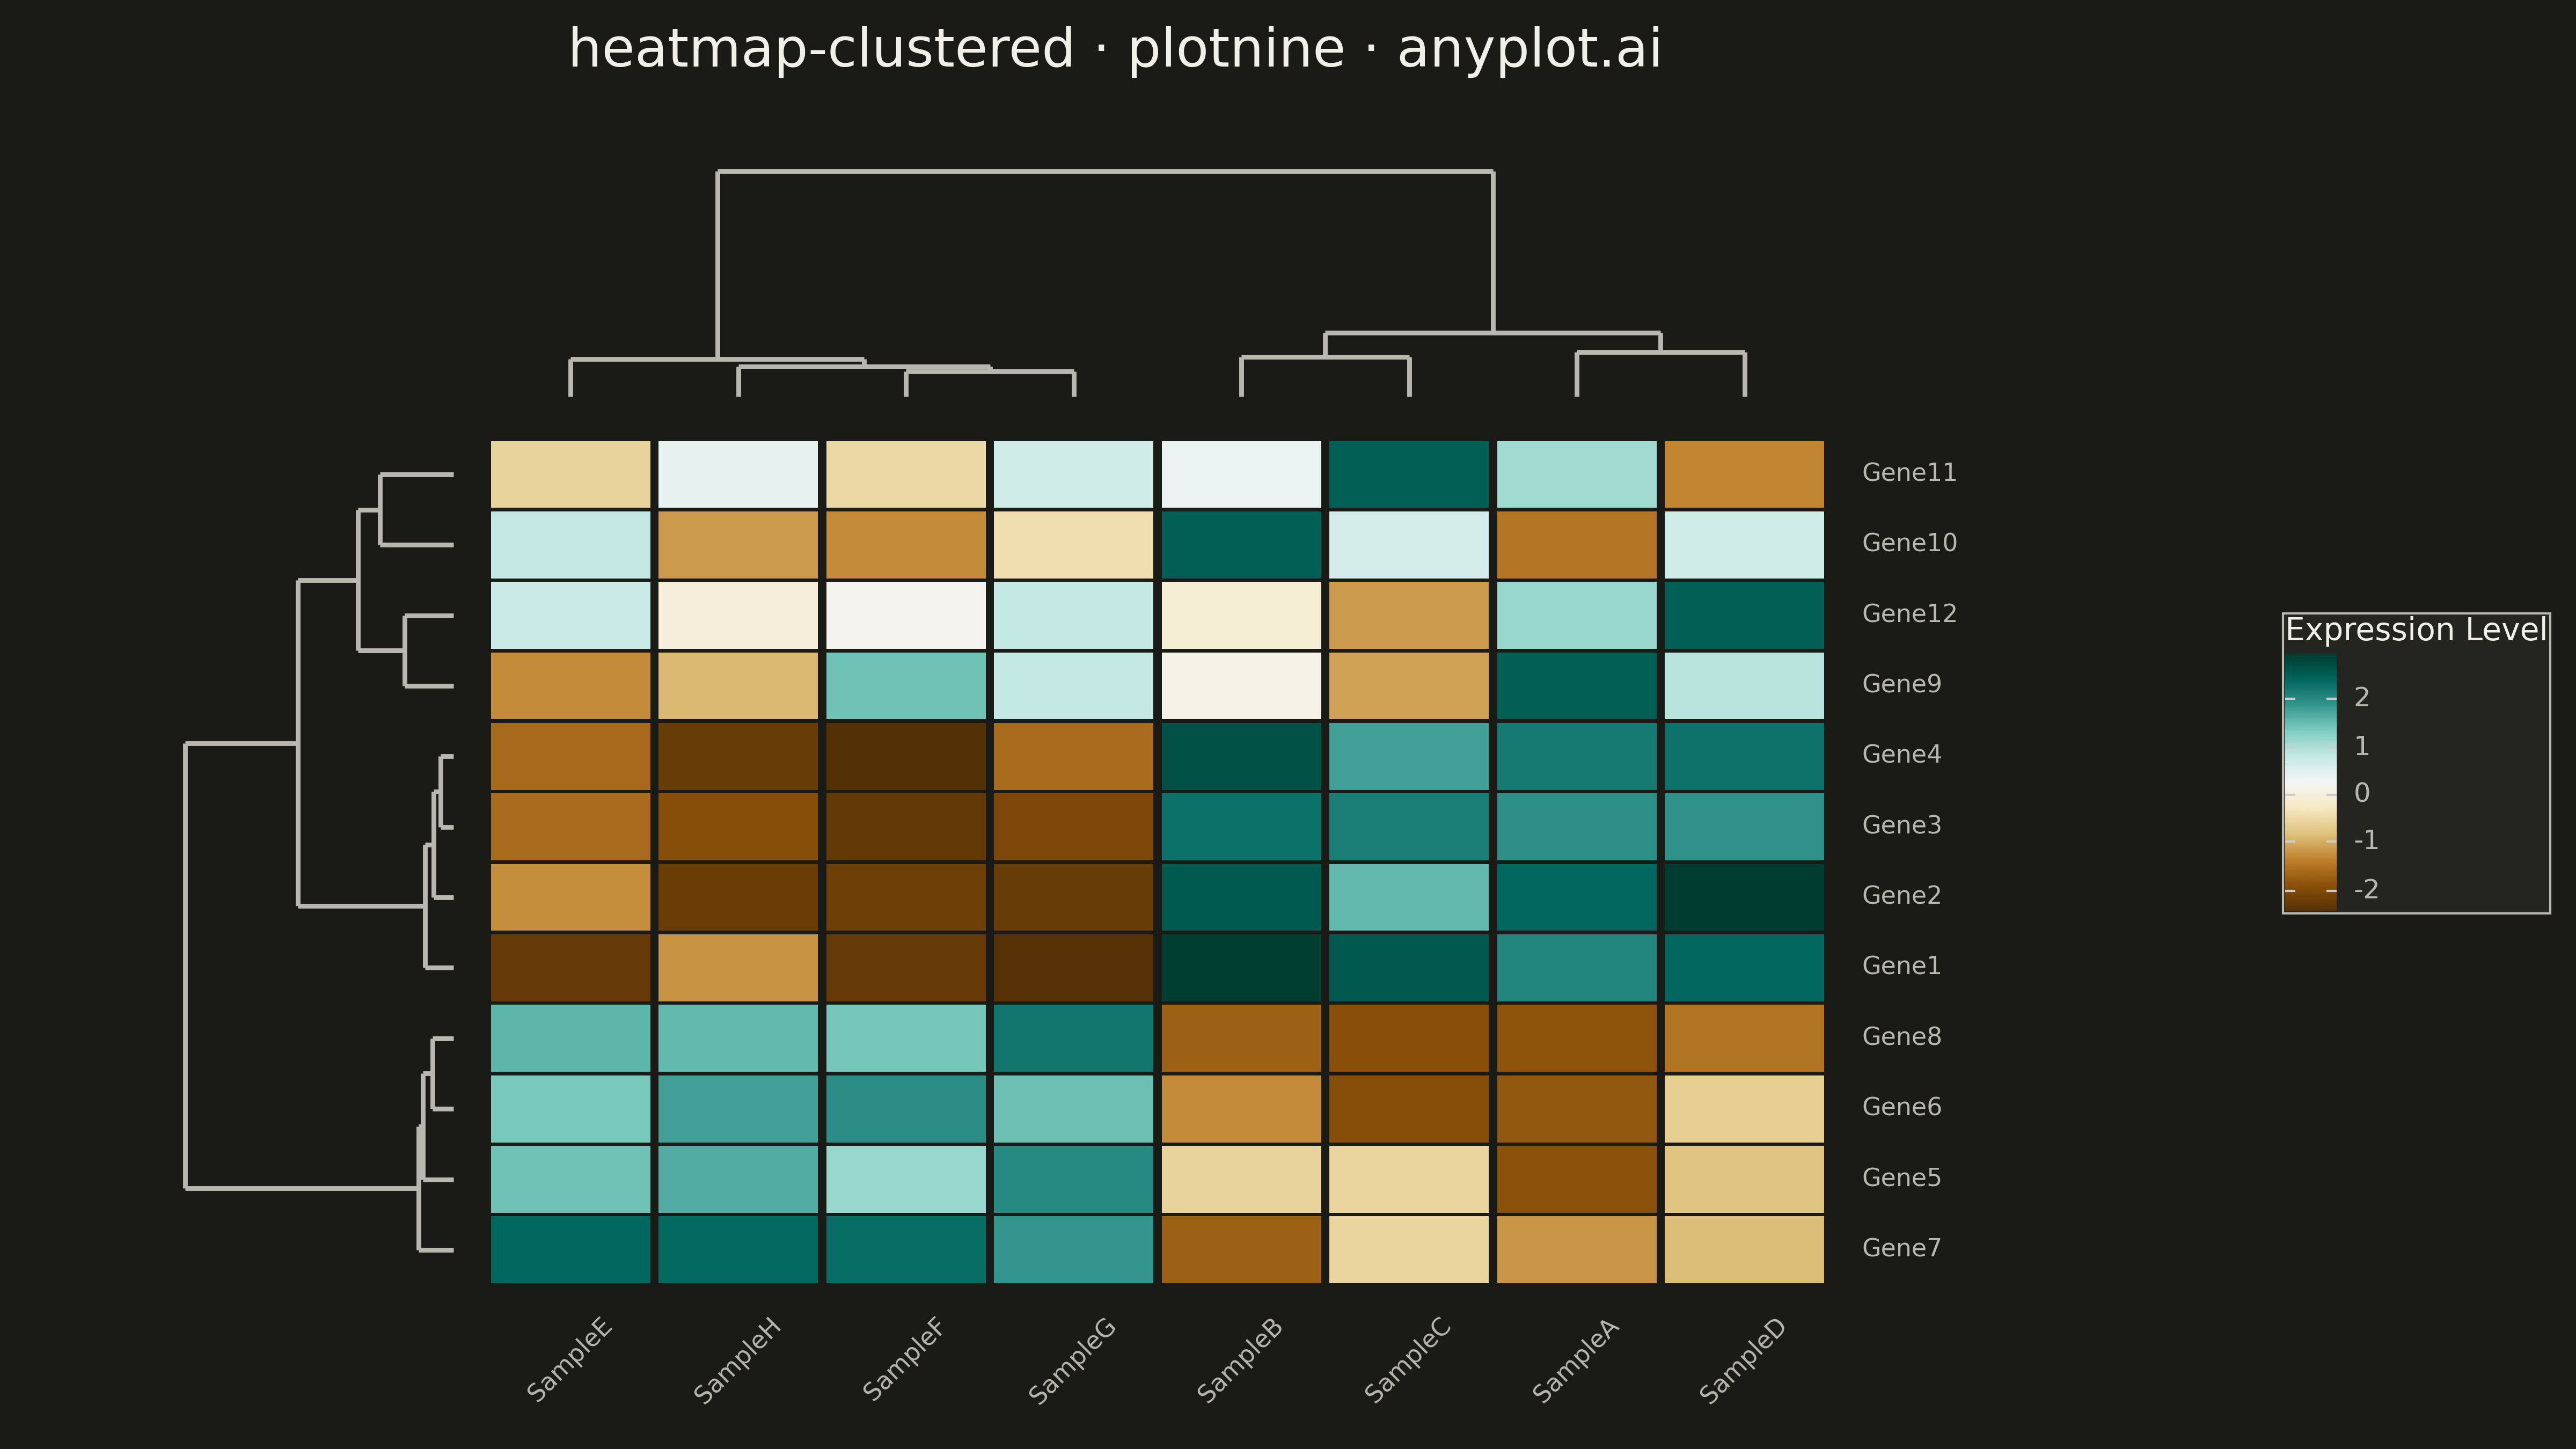
A heatmap with hierarchical clustering dendrograms on rows and/or columns, showing both data values and their hierarchical relationships. Rows and columns are automatically reordered based on clustering results to reveal natural groupings in the data. Essential for discovering patterns in high-dimensional data where similar observations or variables should be visually grouped together.
""" anyplot.ai
heatmap-clustered: Clustered Heatmap
Library: plotnine 0.15.4 | Python 3.13.13
Quality: 91/100 | Updated: 2026-05-09
"""

import os

import numpy as np
import pandas as pd
from plotnine import (
    aes,
    coord_cartesian,
    element_blank,
    element_rect,
    element_text,
    geom_segment,
    geom_text,
    geom_tile,
    ggplot,
    labs,
    scale_fill_cmap,
    scale_x_continuous,
    scale_y_continuous,
    theme,
    theme_minimal,
)
from scipy.cluster.hierarchy import dendrogram, linkage


# Theme tokens (see prompts/default-style-guide.md)
THEME = os.getenv("ANYPLOT_THEME", "light")
PAGE_BG = "#FAF8F1" if THEME == "light" else "#1A1A17"
ELEVATED_BG = "#FFFDF6" if THEME == "light" else "#242420"
INK = "#1A1A17" if THEME == "light" else "#F0EFE8"
INK_SOFT = "#4A4A44" if THEME == "light" else "#B8B7B0"

# Data - Gene expression data (12 genes x 8 samples)
np.random.seed(42)

n_genes = 12
n_samples = 8

# Gene names
gene_names = [f"Gene{i + 1}" for i in range(n_genes)]
sample_names = [f"Sample{chr(65 + i)}" for i in range(n_samples)]

# Create expression data with cluster structure
# Group 1: Genes 1-4 (co-expressed, upregulated in samples A-D)
# Group 2: Genes 5-8 (co-expressed, upregulated in samples E-H)
# Group 3: Genes 9-12 (variable expression)
expression = np.zeros((n_genes, n_samples))

# Cluster 1 genes - high in first half of samples
for i in range(4):
    expression[i, :4] = np.random.uniform(1.5, 3.0, 4)
    expression[i, 4:] = np.random.uniform(-2.5, -1.0, 4)

# Cluster 2 genes - high in second half of samples
for i in range(4, 8):
    expression[i, :4] = np.random.uniform(-2.0, -0.5, 4)
    expression[i, 4:] = np.random.uniform(1.0, 2.5, 4)

# Cluster 3 genes - mixed pattern
for i in range(8, 12):
    expression[i, :] = np.random.uniform(-1.5, 1.5, n_samples)
    expression[i, i % n_samples] = 2.5  # One strong signal per gene

# Perform hierarchical clustering on rows (genes) and columns (samples)
row_linkage = linkage(expression, method="ward")
col_linkage = linkage(expression.T, method="ward")

# Get dendrogram coordinates
row_dend = dendrogram(row_linkage, no_plot=True)
col_dend = dendrogram(col_linkage, no_plot=True)

# Reorder data according to clustering
row_order = row_dend["leaves"]
col_order = col_dend["leaves"]
reordered_expr = expression[row_order, :][:, col_order]
reordered_genes = [gene_names[i] for i in row_order]
reordered_samples = [sample_names[i] for i in col_order]

# Layout parameters
# Main heatmap: x from 20 to 100, y from 0 to 60
# Row dendrogram: x from 0 to 18, y from 0 to 60
# Col dendrogram: x from 20 to 100, y from 62 to 82
heatmap_x_start = 20
heatmap_x_end = 100
heatmap_y_start = 0
heatmap_y_end = 60
cell_width = (heatmap_x_end - heatmap_x_start) / n_samples
cell_height = (heatmap_y_end - heatmap_y_start) / n_genes

# Create heatmap tile data
tile_data = []
for i, gene in enumerate(reordered_genes):
    for j, sample in enumerate(reordered_samples):
        x_pos = heatmap_x_start + (j + 0.5) * cell_width
        y_pos = heatmap_y_start + (i + 0.5) * cell_height
        tile_data.append(
            {"x": x_pos, "y": y_pos, "value": round(reordered_expr[i, j], 2), "gene": gene, "sample": sample}
        )
tile_df = pd.DataFrame(tile_data)

# Create row dendrogram segments (on the left, rotated 90 degrees)
row_segments = []
max_row_dist = max(row_linkage[:, 2]) if len(row_linkage) > 0 else 1
dend_width = 16  # Width for row dendrogram

for xs, ys in zip(row_dend["icoord"], row_dend["dcoord"], strict=True):
    # In original dendrogram: x is leaf position, y is distance
    # We rotate: original x -> new y, original y -> new x (from right edge going left)
    for k in range(3):
        # Map original x positions (leaf positions) to y coordinates
        # Original x spans 5, 15, 25, ... for n leaves
        orig_x1, orig_x2 = xs[k], xs[k + 1]
        orig_y1, orig_y2 = ys[k], ys[k + 1]

        # Normalize original x to [0, n_genes] and map to heatmap y range
        new_y1 = heatmap_y_start + (orig_x1 / (n_genes * 10)) * (heatmap_y_end - heatmap_y_start)
        new_y2 = heatmap_y_start + (orig_x2 / (n_genes * 10)) * (heatmap_y_end - heatmap_y_start)

        # Normalize original y (distance) and map to x (from right edge going left)
        new_x1 = heatmap_x_start - 2 - (orig_y1 / max_row_dist) * dend_width
        new_x2 = heatmap_x_start - 2 - (orig_y2 / max_row_dist) * dend_width

        row_segments.append({"x": new_x1, "xend": new_x2, "y": new_y1, "yend": new_y2})

row_seg_df = pd.DataFrame(row_segments)

# Create column dendrogram segments (on top)
col_segments = []
max_col_dist = max(col_linkage[:, 2]) if len(col_linkage) > 0 else 1
dend_height = 16  # Height for column dendrogram

for xs, ys in zip(col_dend["icoord"], col_dend["dcoord"], strict=True):
    for k in range(3):
        orig_x1, orig_x2 = xs[k], xs[k + 1]
        orig_y1, orig_y2 = ys[k], ys[k + 1]

        # Map original x to heatmap x range
        new_x1 = heatmap_x_start + (orig_x1 / (n_samples * 10)) * (heatmap_x_end - heatmap_x_start)
        new_x2 = heatmap_x_start + (orig_x2 / (n_samples * 10)) * (heatmap_x_end - heatmap_x_start)

        # Map original y (distance) to y above heatmap
        new_y1 = heatmap_y_end + 3 + (orig_y1 / max_col_dist) * dend_height
        new_y2 = heatmap_y_end + 3 + (orig_y2 / max_col_dist) * dend_height

        col_segments.append({"x": new_x1, "xend": new_x2, "y": new_y1, "yend": new_y2})

col_seg_df = pd.DataFrame(col_segments)

# Create row labels (gene names on the right)
row_labels = pd.DataFrame(
    {
        "x": [heatmap_x_end + 2] * n_genes,
        "y": [heatmap_y_start + (i + 0.5) * cell_height for i in range(n_genes)],
        "label": reordered_genes,
    }
)

# Create column labels (sample names at bottom)
col_labels = pd.DataFrame(
    {
        "x": [heatmap_x_start + (i + 0.5) * cell_width for i in range(n_samples)],
        "y": [heatmap_y_start - 2] * n_samples,
        "label": reordered_samples,
    }
)

# Build the plot
plot = (
    ggplot()
    # Heatmap tiles
    + geom_tile(aes(x="x", y="y", fill="value"), data=tile_df, width=cell_width * 0.95, height=cell_height * 0.95)
    # Row dendrogram
    + geom_segment(aes(x="x", xend="xend", y="y", yend="yend"), data=row_seg_df, color=INK_SOFT, size=1.2)
    # Column dendrogram
    + geom_segment(aes(x="x", xend="xend", y="y", yend="yend"), data=col_seg_df, color=INK_SOFT, size=1.2)
    # Row labels
    + geom_text(aes(x="x", y="y", label="label"), data=row_labels, ha="left", size=11, color=INK_SOFT)
    # Column labels
    + geom_text(
        aes(x="x", y="y", label="label"), data=col_labels, ha="center", va="top", size=11, color=INK_SOFT, angle=45
    )
    # Color scale (BrBG diverging colormap for data centered at zero)
    + scale_fill_cmap(cmap_name="BrBG", name="Expression Level")
    # Remove axes
    + scale_x_continuous(breaks=[], expand=(0.02, 0))
    + scale_y_continuous(breaks=[], expand=(0.02, 0))
    + coord_cartesian(xlim=(-5, 120), ylim=(-8, 82))
    + labs(x="", y="", title="heatmap-clustered · plotnine · anyplot.ai")
    + theme_minimal()
    + theme(
        figure_size=(16, 9),
        text=element_text(size=14),
        plot_background=element_rect(fill=PAGE_BG, color=PAGE_BG),
        panel_background=element_rect(fill=PAGE_BG),
        panel_grid_major=element_blank(),
        panel_grid_minor=element_blank(),
        plot_title=element_text(size=24, ha="center", color=INK),
        axis_text=element_blank(),
        axis_ticks=element_blank(),
        legend_background=element_rect(fill=ELEVATED_BG, color=INK_SOFT),
        legend_title=element_text(size=14, color=INK),
        legend_text=element_text(size=12, color=INK_SOFT),
    )
)

plot.save(f"plot-{THEME}.png", dpi=300, verbose=False)
Runnable source as JSON, for any HTTP client: https://api.anyplot.ai/specs/heatmap-clustered/plotnine/code. Any spec id and library id listed in llms-full.txt fit the same URL shape; every URL below is complete and callable.
{
  "spec_id": "heatmap-clustered",
  "language": "python",
  "library": "plotnine",
  "page": "https://anyplot.ai/heatmap-clustered/python/plotnine",
  "hub": "https://anyplot.ai/heatmap-clustered",
  "code_json": "https://api.anyplot.ai/specs/heatmap-clustered/plotnine/code",
  "spec_json": "https://api.anyplot.ai/specs/heatmap-clustered",
  "render_light_png": "https://storage.googleapis.com/anyplot-images/plots/heatmap-clustered/python/plotnine/plot-light.png",
  "render_dark_png": "https://storage.googleapis.com/anyplot-images/plots/heatmap-clustered/python/plotnine/plot-dark.png",
  "quality_score": 91.0,
  "license": "MIT",
  "guide": "https://anyplot.ai/llms.txt"
}
Part of Clustered Heatmap on anyplot.ai.