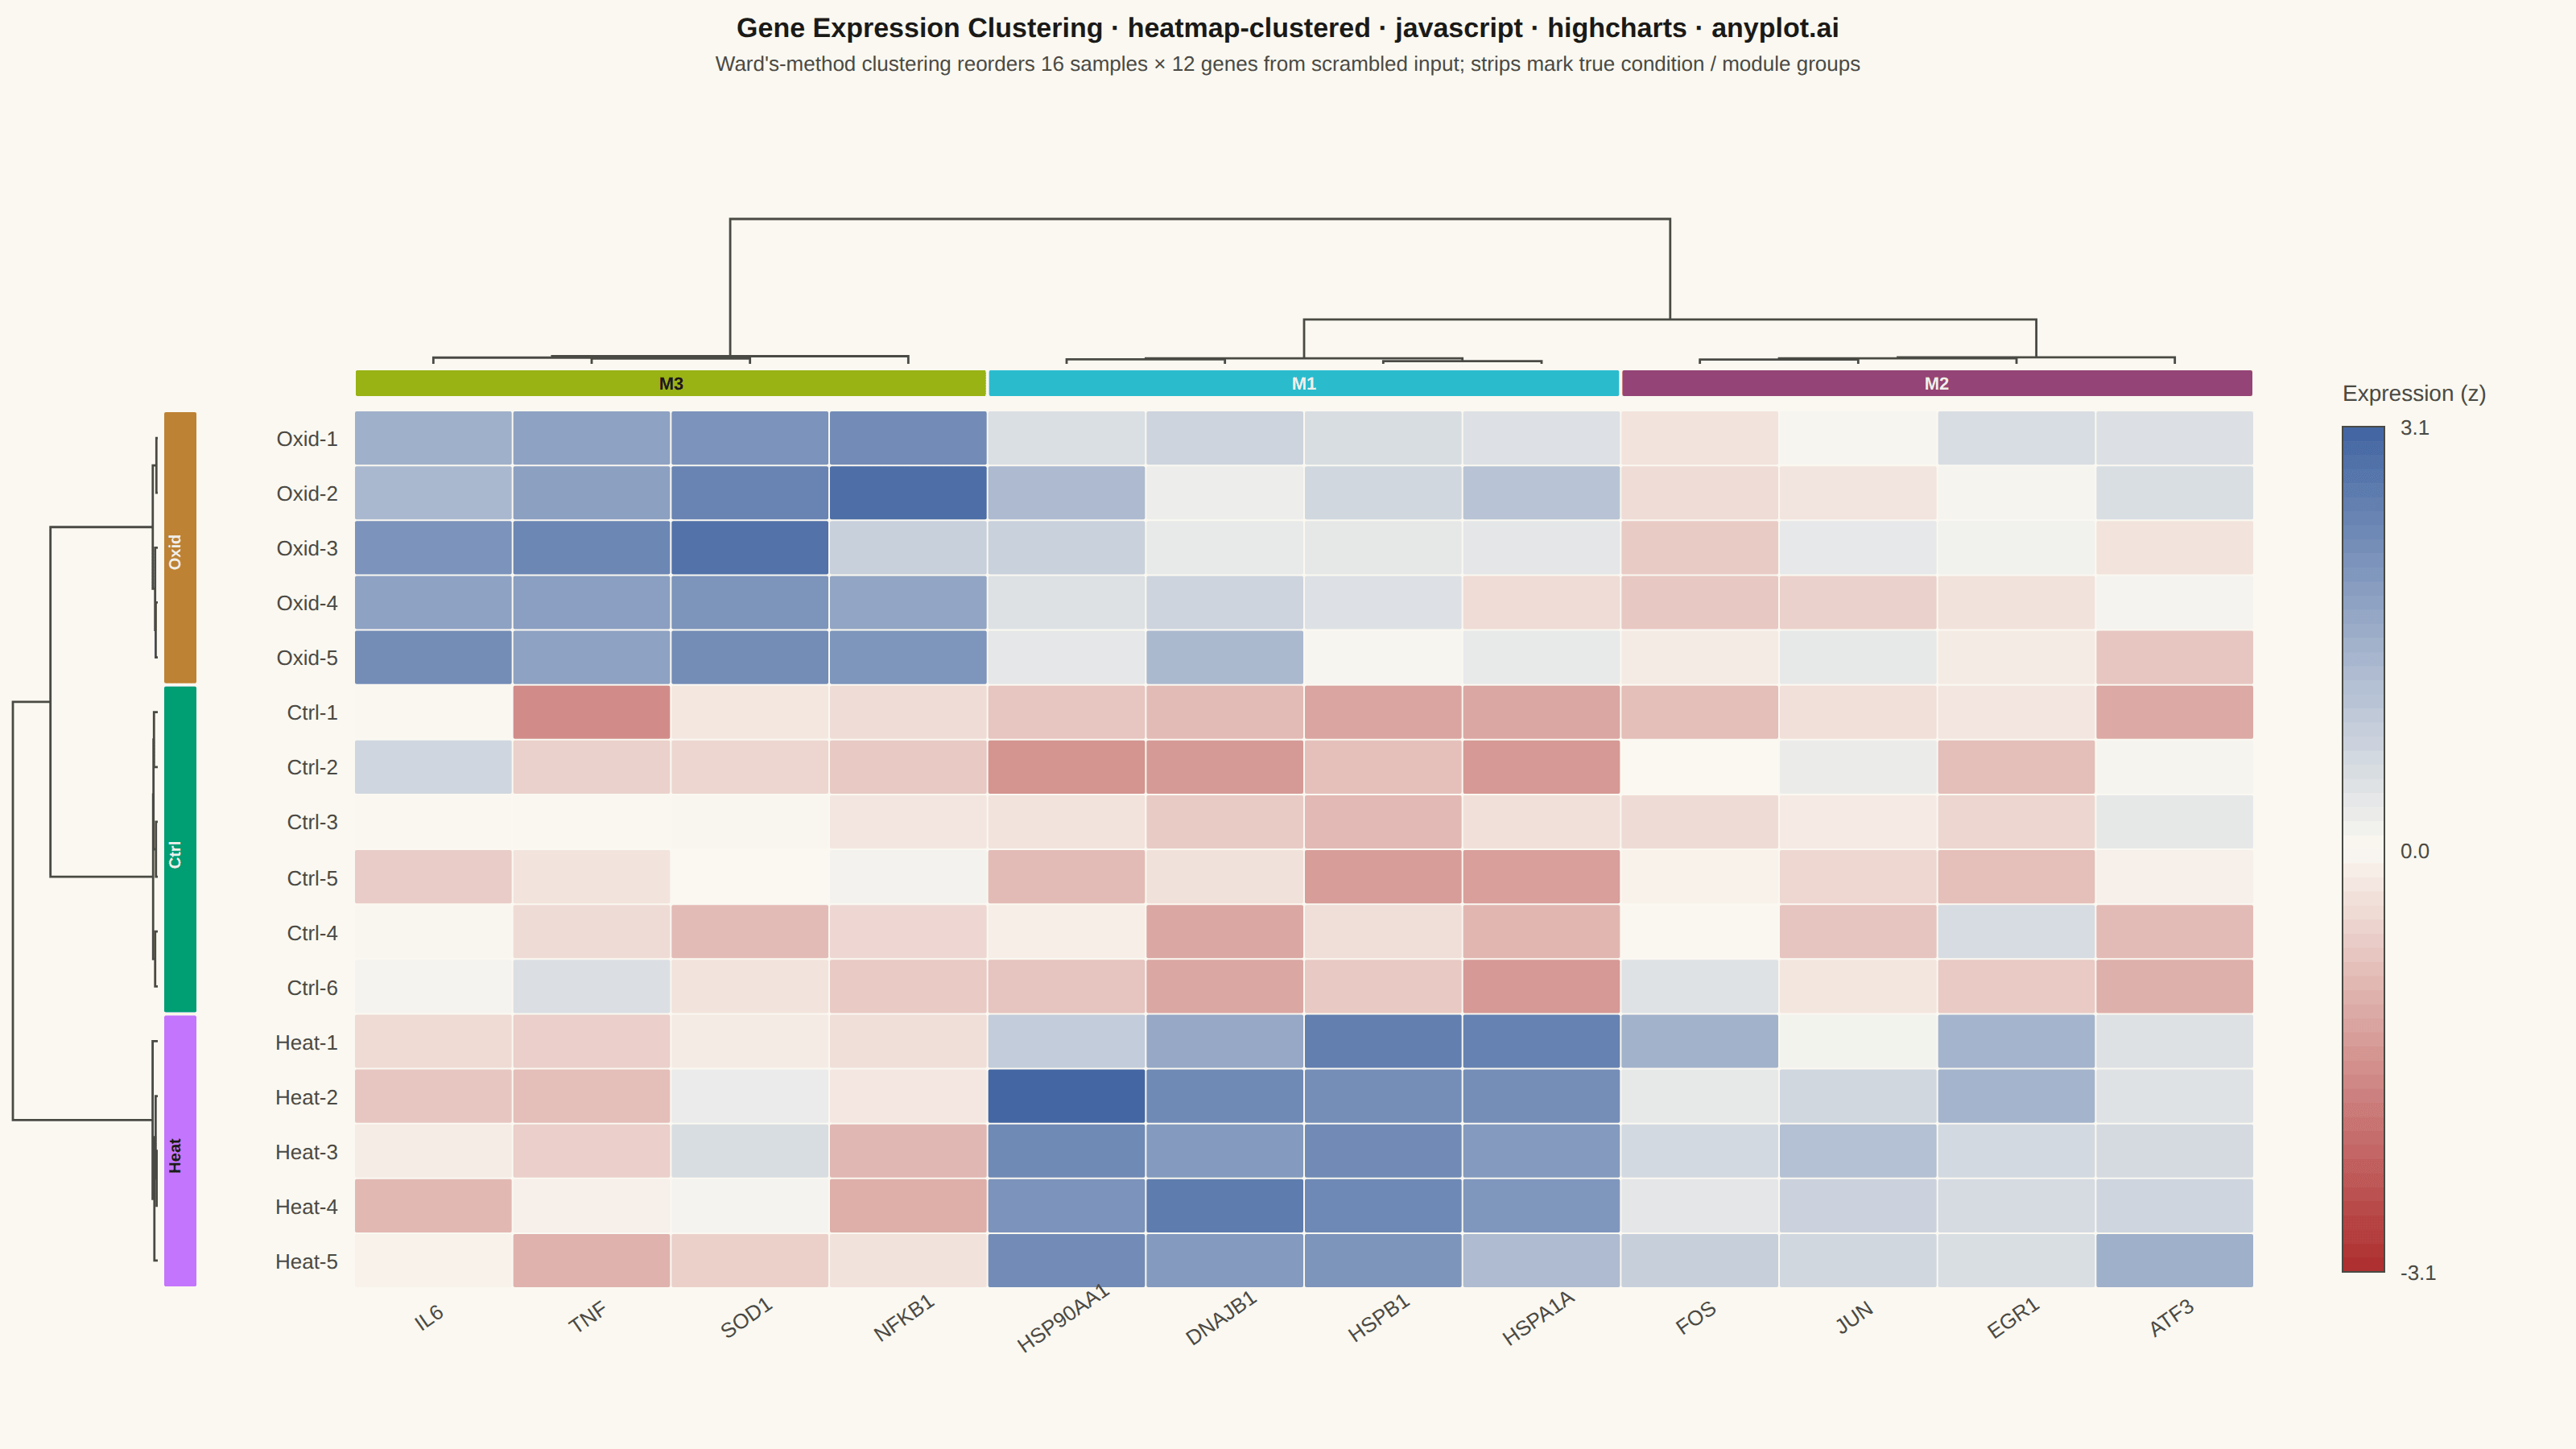
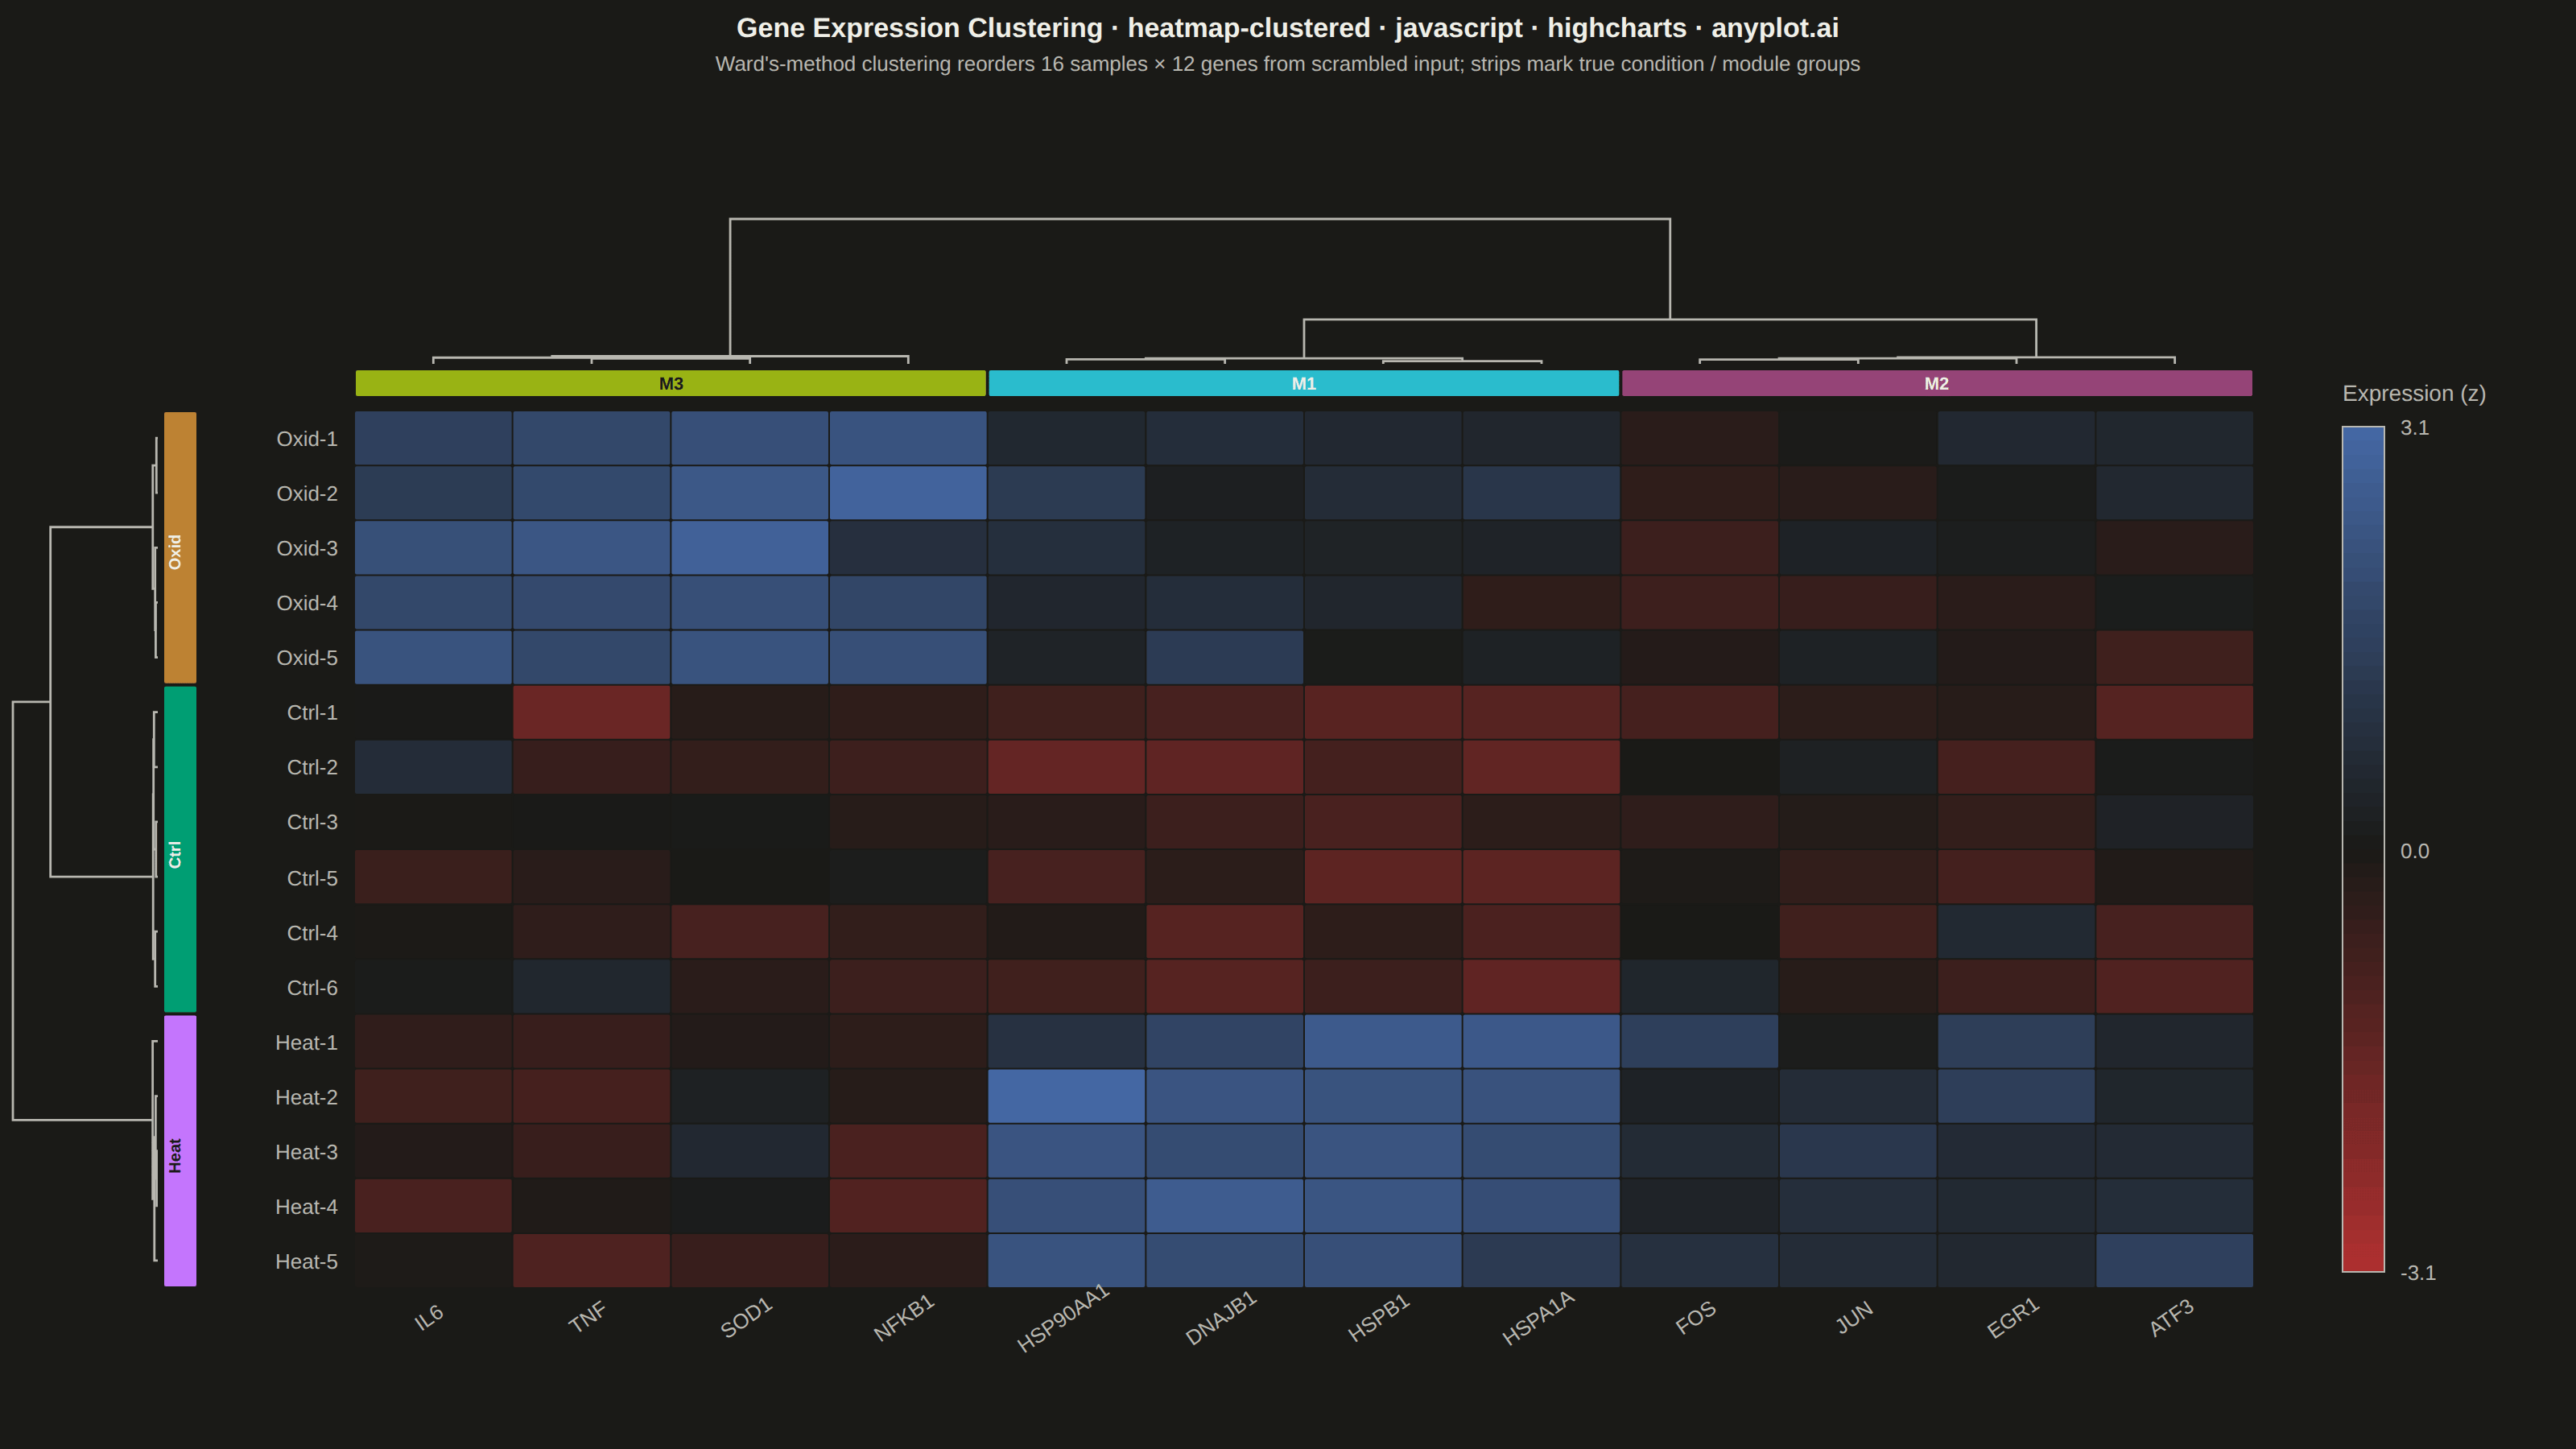
The same plot in 14 other libraries — JavaScript: Chart.js, D3.js, Apache ECharts, MUI X Charts; Python: Altair, Bokeh, lets-plot, Matplotlib, Plotly, plotnine, Pygal, Seaborn; R: ggplot2; Julia: Makie.jl. Compare all 15 side by side: Clustered Heatmap in Python, R, Julia and JavaScript.
A heatmap with hierarchical clustering dendrograms on both rows and columns, showing both data values and their hierarchical relationships. Rows and columns are automatically reordered based on clustering results to reveal natural groupings in the data. Essential for discovering patterns in high-dimensional data where similar observations or variables should be visually grouped together.
// anyplot.ai
// heatmap-clustered: Clustered Heatmap
// Library: highcharts 12.6.0 | JavaScript 22.23.2
// Quality: 95/100 | Created: 2026-09-05
//# anyplot-orientation: landscape

const t = window.ANYPLOT_TOKENS;

// --- Data: simulated qPCR expression (z-score) across stress-response genes -
// Rows = biological samples under 3 conditions, columns = 12 genes from 3
// functional modules. Both axes are given in SCRAMBLED order on purpose —
// the whole point of a clustermap is that Ward's-linkage clustering below
// recovers the hidden condition/module structure from the values alone.
let seed = 42;
function rand() {
  seed = (seed * 1103515245 + 12345) & 0x7fffffff;
  return seed / 0x7fffffff;
}
function randNormal(mean, sd) {
  const u1 = Math.max(rand(), 1e-9);
  const u2 = rand();
  const z = Math.sqrt(-2 * Math.log(u1)) * Math.cos(2 * Math.PI * u2);
  return mean + sd * z;
}

const CONDITION_NAMES = ['Control', 'Heat Shock', 'Oxidative Stress'];
const CONDITION_ABBR = ['Ctrl', 'Heat', 'Oxid'];
// Scrambled condition assignment, 16 samples, balanced 6/5/5.
const ROW_CONDITION = [2, 0, 1, 0, 2, 1, 0, 1, 2, 0, 2, 1, 0, 1, 2, 0];
const N_ROWS = ROW_CONDITION.length;

const MODULE_NAMES = ['Heat-Shock Response', 'Immediate-Early', 'Inflammatory / Redox'];
// Gene symbols and their true functional module, in scrambled column order.
const COL_GENE = ['IL6', 'HSP90AA1', 'FOS', 'NFKB1', 'DNAJB1', 'ATF3', 'TNF', 'HSPB1', 'EGR1', 'SOD1', 'HSPA1A', 'JUN'];
const COL_MODULE = [2, 0, 1, 2, 0, 1, 2, 0, 1, 2, 0, 1];
const N_COLS = COL_GENE.length;

// Typical z-scored response per (condition, module) pair.
const MODULE_EFFECT = [
  [-1.0, -0.5, -0.3],
  [2.2, 0.8, -0.4],
  [0.6, -0.2, 2.0],
];

const replicateCount = [0, 0, 0];
const ROW_LABEL = ROW_CONDITION.map((cond) => {
  replicateCount[cond] += 1;
  return `${CONDITION_ABBR[cond]}-${replicateCount[cond]}`;
});

const matrix = ROW_CONDITION.map((cond) => COL_MODULE.map((mod) => MODULE_EFFECT[cond][mod] + randNormal(0, 0.45)));

let minVal = Infinity;
let maxVal = -Infinity;
matrix.forEach((row) =>
  row.forEach((v) => {
    if (v < minVal) minVal = v;
    if (v > maxVal) maxVal = v;
  })
);
const DOMAIN = Math.max(Math.abs(minVal), Math.abs(maxVal));

// --- Hierarchical clustering (Ward's method, Euclidean distance) -----------
// Agglomerative clustering via the centroid form of Ward's criterion:
// merging clusters a, b costs (|a||b| / (|a|+|b|)) * ||centroid_a - centroid_b||^2.
// Returns the leaf order plus the dendrogram link list (heights normalized
// to [0, 1] so the same drawing code works for rows and columns).
function buildDendrogram(vectors) {
  let clusters = vectors.map((v, i) => ({
    members: [i],
    minMember: i,
    size: 1,
    centroid: v.slice(),
    height: 0,
    left: null,
    right: null,
  }));

  while (clusters.length > 1) {
    let bi = -1;
    let bj = -1;
    let bestD = Infinity;
    for (let i = 0; i < clusters.length; i++) {
      for (let j = i + 1; j < clusters.length; j++) {
        const a = clusters[i];
        const b = clusters[j];
        let sq = 0;
        for (let k = 0; k < a.centroid.length; k++) {
          const d = a.centroid[k] - b.centroid[k];
          sq += d * d;
        }
        const wardD = ((a.size * b.size) / (a.size + b.size)) * sq;
        if (wardD < bestD) {
          bestD = wardD;
          bi = i;
          bj = j;
        }
      }
    }
    const a = clusters[bi];
    const b = clusters[bj];
    const left = a.minMember <= b.minMember ? a : b;
    const right = left === a ? b : a;
    const size = a.size + b.size;
    const centroid = a.centroid.map((v, k) => (v * a.size + b.centroid[k] * b.size) / size);
    // Clamp to the children's heights so the dendrogram never draws a merge
    // "lower" than either child (Ward's centroid form isn't always monotonic).
    const height = Math.max(bestD, a.height, b.height);
    clusters = clusters.filter((_, idx) => idx !== bi && idx !== bj);
    clusters.push({ members: [...left.members, ...right.members], minMember: left.minMember, size, centroid, height, left, right });
  }

  const root = clusters[0];
  const posOf = new Map();
  root.members.forEach((leafIdx, pos) => posOf.set(leafIdx, pos));
  const maxHeight = root.height || 1;
  const links = [];

  function walk(node) {
    if (!node.left) return { pos: posOf.get(node.members[0]), h: 0 };
    const l = walk(node.left);
    const r = walk(node.right);
    const hMerge = node.height / maxHeight;
    links.push({ pos1: l.pos, h1: l.h, pos2: r.pos, h2: r.h, hMerge });
    return { pos: (l.pos + r.pos) / 2, h: hMerge };
  }
  walk(root);

  return { order: root.members, links };
}

const rowDendro = buildDendrogram(matrix);
const colVectors = Array.from({ length: N_COLS }, (_, c) => matrix.map((row) => row[c]));
const colDendro = buildDendrogram(colVectors);
const ROW_ORDER = rowDendro.order;
const COL_ORDER = colDendro.order;

// Reorder everything into clustered order.
const M = ROW_ORDER.map((r) => COL_ORDER.map((c) => matrix[r][c]));
const rowLabels = ROW_ORDER.map((r) => ROW_LABEL[r]);
const rowCondition = ROW_ORDER.map((r) => ROW_CONDITION[r]);
const colLabels = COL_ORDER.map((c) => COL_GENE[c]);
const colModule = COL_ORDER.map((c) => COL_MODULE[c]);

function runsOf(arr) {
  const runs = [];
  let start = 0;
  for (let i = 1; i <= arr.length; i++) {
    if (i === arr.length || arr[i] !== arr[start]) {
      runs.push({ value: arr[start], start, end: i - 1 });
      start = i;
    }
  }
  return runs;
}
const rowRuns = runsOf(rowCondition);
const colRuns = runsOf(colModule);

// --- Color: imprint_div — expression data is z-scored, centered on zero ----
function hexToRgb(hex) {
  return [parseInt(hex.slice(1, 3), 16), parseInt(hex.slice(3, 5), 16), parseInt(hex.slice(5, 7), 16)];
}
function lerp(a, b, f) {
  return a + (b - a) * f;
}
function lerpRgb(a, b, f) {
  return [Math.round(lerp(a[0], b[0], f)), Math.round(lerp(a[1], b[1], f)), Math.round(lerp(a[2], b[2], f))];
}
function rgbToCss([r, g, b]) {
  return `rgb(${r},${g},${b})`;
}
const DIV_LO = hexToRgb(t.div[0]);
const DIV_MID = hexToRgb(t.div[1]);
const DIV_HI = hexToRgb(t.div[2]);
function valueFill(v) {
  const frac = Math.min(1, Math.max(0, (v + DOMAIN) / (2 * DOMAIN)));
  const rgb = frac <= 0.5 ? lerpRgb(DIV_LO, DIV_MID, frac / 0.5) : lerpRgb(DIV_MID, DIV_HI, (frac - 0.5) / 0.5);
  return rgbToCss(rgb);
}

// Group-bar colors — chosen away from the diverging colormap's red/blue
// endpoints so the annotation strips never get mistaken for heatmap data.
const ROW_GROUP_COLOR = [t.palette[0], t.palette[1], t.palette[3]]; // green, purple, ochre — condition
const COL_GROUP_COLOR = [t.palette[5], t.palette[6], t.palette[7]]; // cyan, rose, lime — gene module
function textColorFor(hex) {
  const [r, g, b] = hexToRgb(hex);
  const luminance = 0.299 * r + 0.587 * g + 0.114 * b;
  return luminance > 150 ? '#1A1A17' : '#F0EFE8';
}

// --- Title (fontsize scaled off the 67-char baseline) -----------------------
const TITLE_TEXT = 'Gene Expression Clustering · heatmap-clustered · javascript · highcharts · anyplot.ai';
const TITLE_FS = Math.max(Math.round(22 * Math.min(1, 67 / TITLE_TEXT.length)), 14);

// --- Fixed chart geometry (landscape canvas, harness-guaranteed 1600x900) ---
// Top margin: title/subtitle baseline (130, proven layout) + column dendrogram
// band (90) + column group-bar (16) + gaps. Left margin mirrors this for the
// row dendrogram + row group-bar + row labels.
const CHART_MARGIN = [255, 200, 100, 220]; // [top, right, bottom, left]
const cellW = (window.ANYPLOT_SIZE.width - CHART_MARGIN[1] - CHART_MARGIN[3]) / N_COLS;
const cellH = (window.ANYPLOT_SIZE.height - CHART_MARGIN[0] - CHART_MARGIN[2]) / N_ROWS;
const MARKER_RADIUS = Math.max(Math.min(cellW, cellH) / 2 - 2, 3);

const ROW_DENDRO_ROOT_X = 8;
const ROW_DENDRO_LEAF_X = 98; // touches the row group-bar
const ROW_GROUPBAR_X0 = ROW_DENDRO_LEAF_X + 4;
const ROW_GROUPBAR_W = 20;
const ROW_LABEL_X = CHART_MARGIN[3] - 10;

const COL_DENDRO_ROOT_Y = 136;
const COL_DENDRO_LEAF_Y = 226; // touches the column group-bar
const COL_GROUPBAR_Y0 = COL_DENDRO_LEAF_Y + 4;
const COL_GROUPBAR_H = 16;

function rowHeightX(h) {
  return ROW_DENDRO_LEAF_X - h * (ROW_DENDRO_LEAF_X - ROW_DENDRO_ROOT_X);
}
function colHeightY(h) {
  return COL_DENDRO_LEAF_Y - h * (COL_DENDRO_LEAF_Y - COL_DENDRO_ROOT_Y);
}

const drawn = [];
function clearDrawn() {
  drawn.forEach((el) => {
    try {
      el.destroy();
    } catch (_err) {
      // already removed
    }
  });
  drawn.length = 0;
}

function drawAll() {
  const chart = this;
  clearDrawn();
  const r = chart.renderer;
  const cw = chart.plotWidth / N_COLS;
  const ch = chart.plotHeight / N_ROWS;

  // Heatmap cells.
  for (let row = 0; row < N_ROWS; row++) {
    for (let col = 0; col < N_COLS; col++) {
      const x = chart.plotLeft + col * cw;
      const y = chart.plotTop + row * ch;
      drawn.push(
        r
          .rect(x + 0.5, y + 0.5, cw - 1, ch - 1, 1)
          .attr({ fill: valueFill(M[row][col]), stroke: 'none', zIndex: 2 })
          .add()
      );
    }
  }

  // Row labels.
  rowLabels.forEach((lbl, row) => {
    const cy = chart.plotTop + (row + 0.5) * ch + 5;
    drawn.push(
      r
        .text(lbl, ROW_LABEL_X, cy)
        .attr({ align: 'right', zIndex: 2 })
        .css({ color: t.inkSoft, fontSize: '13px' })
        .add()
    );
  });

  // Column labels.
  colLabels.forEach((lbl, col) => {
    const cx = chart.plotLeft + (col + 0.5) * cw;
    drawn.push(
      r
        .text(lbl, cx, chart.plotTop + chart.plotHeight + 22)
        .attr({ align: 'center', rotation: -35, zIndex: 2 })
        .css({ color: t.inkSoft, fontSize: '13px' })
        .add()
    );
  });

  // Row group-bar (sample condition) + inline run labels, rotated to fit the
  // narrow strip.
  rowRuns.forEach((run) => {
    const y0 = chart.plotTop + run.start * ch;
    const h = (run.end - run.start + 1) * ch;
    const color = ROW_GROUP_COLOR[run.value];
    drawn.push(r.rect(ROW_GROUPBAR_X0, y0 + 1, ROW_GROUPBAR_W, h - 2, 1).attr({ fill: color, zIndex: 2 }).add());
    drawn.push(
      r
        .text(CONDITION_ABBR[run.value], ROW_GROUPBAR_X0 + ROW_GROUPBAR_W / 2, y0 + h / 2 + 3)
        .attr({ align: 'center', rotation: -90, zIndex: 3 })
        .css({ color: textColorFor(color), fontSize: '10px', fontWeight: '600' })
        .add()
    );
  });

  // Column group-bar (gene module) + inline run labels.
  colRuns.forEach((run) => {
    const x0 = chart.plotLeft + run.start * cw;
    const w = (run.end - run.start + 1) * cw;
    const color = COL_GROUP_COLOR[run.value];
    drawn.push(r.rect(x0 + 1, COL_GROUPBAR_Y0, w - 2, COL_GROUPBAR_H, 1).attr({ fill: color, zIndex: 2 }).add());
    if (w > 40) {
      drawn.push(
        r
          .text(`M${run.value + 1}`, x0 + w / 2, COL_GROUPBAR_Y0 + COL_GROUPBAR_H - 4)
          .attr({ align: 'center', zIndex: 3 })
          .css({ color: textColorFor(color), fontSize: '11px', fontWeight: '600' })
          .add()
      );
    }
  });

  // Row dendrogram (height runs horizontally, leaves stacked vertically).
  rowDendro.links.forEach((link) => {
    const y1 = chart.plotTop + (link.pos1 + 0.5) * ch;
    const y2 = chart.plotTop + (link.pos2 + 0.5) * ch;
    const xMerge = rowHeightX(link.hMerge);
    const x1 = rowHeightX(link.h1);
    const x2 = rowHeightX(link.h2);
    drawn.push(
      r
        .path([
          ['M', x1, y1],
          ['L', xMerge, y1],
          ['L', xMerge, y2],
          ['L', x2, y2],
        ])
        .attr({ stroke: t.inkSoft, 'stroke-width': 1.4, fill: 'none', zIndex: 2 })
        .add()
    );
  });

  // Column dendrogram (height runs vertically, leaves spread horizontally).
  colDendro.links.forEach((link) => {
    const x1 = chart.plotLeft + (link.pos1 + 0.5) * cw;
    const x2 = chart.plotLeft + (link.pos2 + 0.5) * cw;
    const yMerge = colHeightY(link.hMerge);
    const y1 = colHeightY(link.h1);
    const y2 = colHeightY(link.h2);
    drawn.push(
      r
        .path([
          ['M', x1, y1],
          ['L', x1, yMerge],
          ['L', x2, yMerge],
          ['L', x2, y2],
        ])
        .attr({ stroke: t.inkSoft, 'stroke-width': 1.4, fill: 'none', zIndex: 2 })
        .add()
    );
  });

  // Diverging colorbar in the freed right margin.
  const barLeft = chart.plotLeft + chart.plotWidth + 55;
  const barTop = chart.plotTop + 10;
  const barWidth = 26;
  const barHeight = chart.plotHeight - 20;
  const segments = 60;
  const segH = barHeight / segments;
  for (let i = 0; i < segments; i++) {
    const value = DOMAIN - (2 * DOMAIN * i) / (segments - 1);
    drawn.push(r.rect(barLeft, barTop + i * segH, barWidth, segH + 0.5).attr({ fill: valueFill(value), zIndex: 2 }).add());
  }
  drawn.push(r.rect(barLeft, barTop, barWidth, barHeight).attr({ fill: 'none', stroke: t.inkSoft, 'stroke-width': 1, zIndex: 2 }).add());
  [
    [DOMAIN, 0],
    [0, 0.5],
    [-DOMAIN, 1],
  ].forEach(([value, frac]) => {
    drawn.push(
      r
        .text(value.toFixed(1), barLeft + barWidth + 10, barTop + frac * barHeight + 5)
        .attr({ align: 'left', zIndex: 2 })
        .css({ color: t.inkSoft, fontSize: '13px' })
        .add()
    );
  });
  drawn.push(
    r
      .text('Expression (z)', barLeft, barTop - 16)
      .attr({ align: 'left', zIndex: 2 })
      .css({ color: t.inkSoft, fontSize: '14px', fontWeight: '500' })
      .add()
  );
}

// Invisible scatter layer aligned to each cell so hovering exposes a native
// Highcharts tooltip — the core bundle has no heatmap/colorAxis module, but a
// matched-axis scatter series recovers interactivity for the hand-drawn grid.
const cellPoints = [];
for (let row = 0; row < N_ROWS; row++) {
  for (let col = 0; col < N_COLS; col++) {
    cellPoints.push({
      x: col,
      y: row,
      value: M[row][col],
      sample: rowLabels[row],
      condition: CONDITION_NAMES[rowCondition[row]],
      gene: colLabels[col],
      module: MODULE_NAMES[colModule[col]],
    });
  }
}

Highcharts.chart('container', {
  chart: {
    backgroundColor: 'transparent',
    animation: false,
    style: { fontFamily: 'inherit' },
    margin: CHART_MARGIN,
    events: { load: drawAll, redraw: drawAll },
  },
  credits: { enabled: false },
  title: {
    text: TITLE_TEXT,
    style: { color: t.ink, fontSize: TITLE_FS + 'px', fontWeight: '600' },
  },
  subtitle: {
    text: "Ward's-method clustering reorders 16 samples × 12 genes from scrambled input; strips mark true condition / module groups",
    style: { color: t.inkSoft, fontSize: '13px' },
  },
  xAxis: { visible: false, min: -0.5, max: N_COLS - 0.5 },
  yAxis: { visible: false, gridLineWidth: 0, min: -0.5, max: N_ROWS - 0.5, reversed: true },
  legend: { enabled: false },
  tooltip: {
    enabled: true,
    backgroundColor: t.elevatedBg,
    borderColor: t.inkSoft,
    borderRadius: 6,
    style: { color: t.ink, fontSize: '13px' },
    formatter: function () {
      const p = this.point;
      return `<b>${p.sample}</b> (${p.condition})<br/><b>${p.gene}</b> (${p.module})<br/>z = ${p.value.toFixed(2)}`;
    },
  },
  plotOptions: {
    series: { animation: false },
    scatter: {
      enableMouseTracking: true,
      stickyTracking: false,
      marker: {
        enabled: true,
        symbol: 'circle',
        radius: MARKER_RADIUS,
        fillColor: 'rgba(0,0,0,0.001)',
        lineWidth: 0,
        states: { hover: { enabled: false } },
      },
    },
  },
  series: [
    {
      type: 'scatter',
      name: 'Expression',
      data: cellPoints,
    },
  ],
});
Runnable source as JSON, for any HTTP client: https://api.anyplot.ai/specs/heatmap-clustered/highcharts/code. Any spec id and library id listed in llms-full.txt fit the same URL shape; every URL below is complete and callable.
{
  "spec_id": "heatmap-clustered",
  "language": "javascript",
  "library": "highcharts",
  "page": "https://anyplot.ai/heatmap-clustered/javascript/highcharts",
  "hub": "https://anyplot.ai/heatmap-clustered",
  "code_json": "https://api.anyplot.ai/specs/heatmap-clustered/highcharts/code",
  "spec_json": "https://api.anyplot.ai/specs/heatmap-clustered",
  "render_light_png": "https://storage.googleapis.com/anyplot-images/plots/heatmap-clustered/javascript/highcharts/plot-light.png",
  "render_dark_png": "https://storage.googleapis.com/anyplot-images/plots/heatmap-clustered/javascript/highcharts/plot-dark.png",
  "interactive_light_html": "https://storage.googleapis.com/anyplot-images/plots/heatmap-clustered/javascript/highcharts/plot-light.html",
  "interactive_dark_html": "https://storage.googleapis.com/anyplot-images/plots/heatmap-clustered/javascript/highcharts/plot-dark.html",
  "quality_score": 95.0,
  "license": "MIT",
  "guide": "https://anyplot.ai/llms.txt"
}
Part of Clustered Heatmap on anyplot.ai.