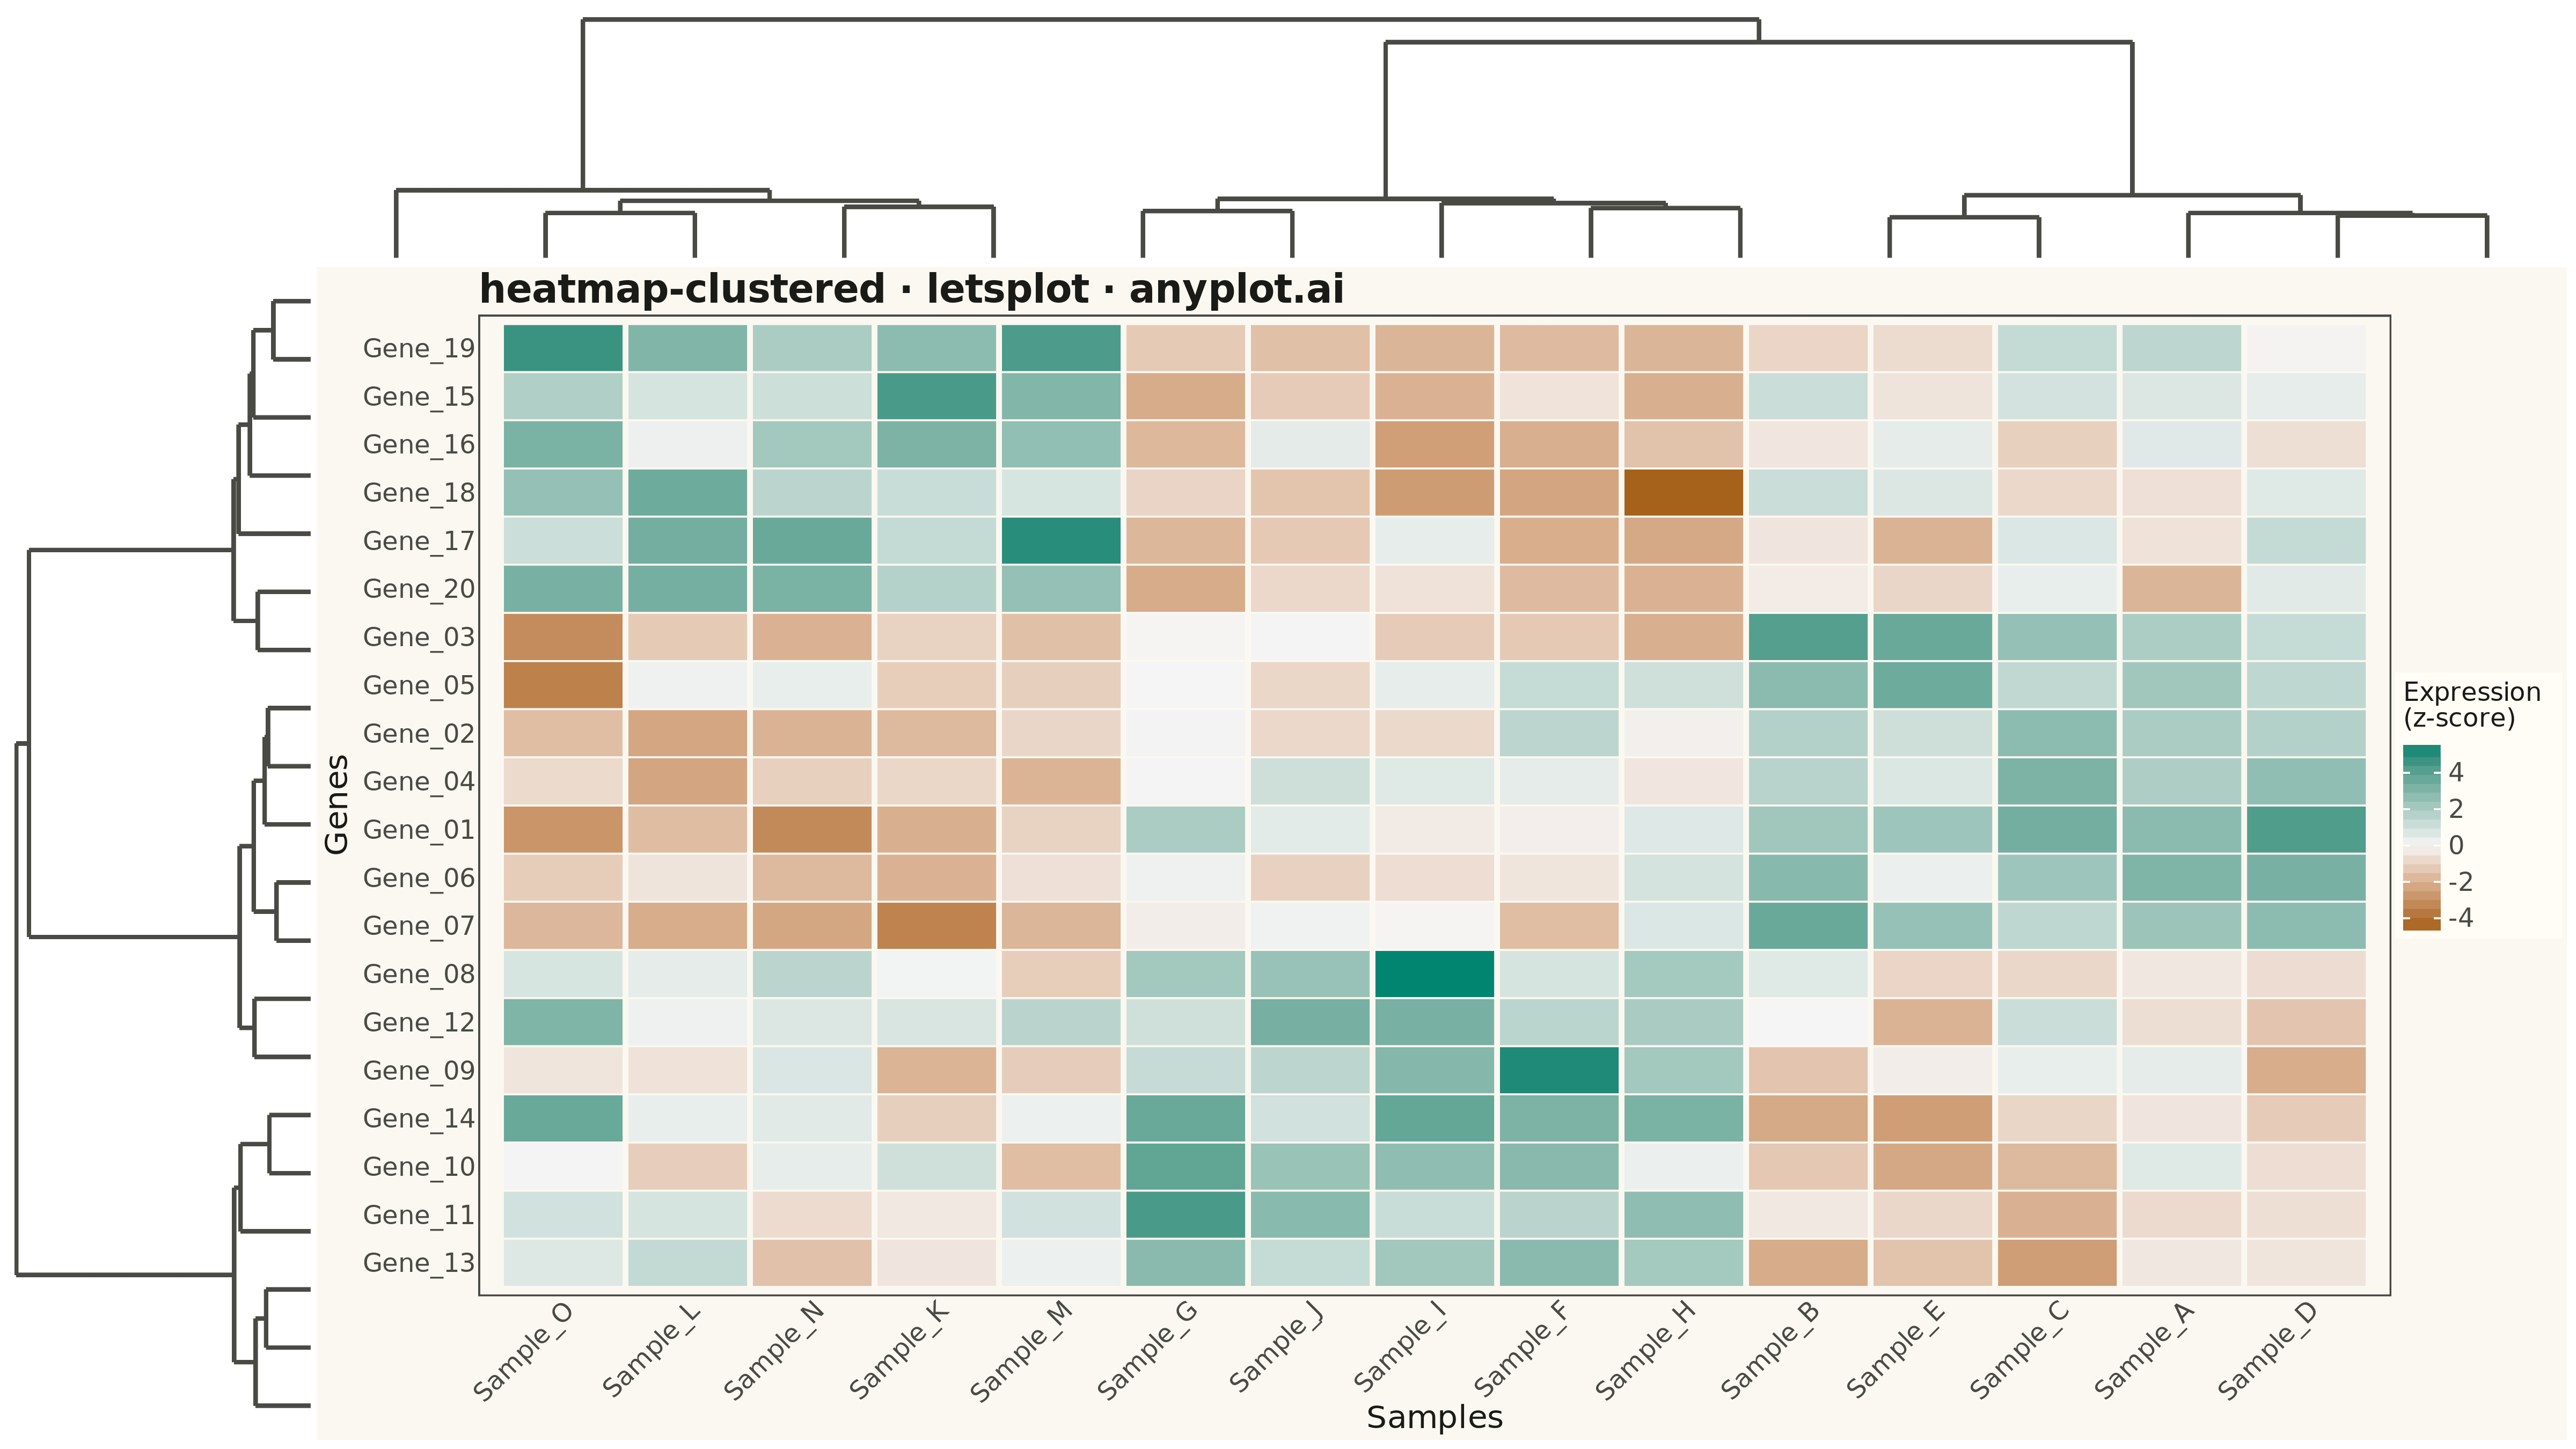
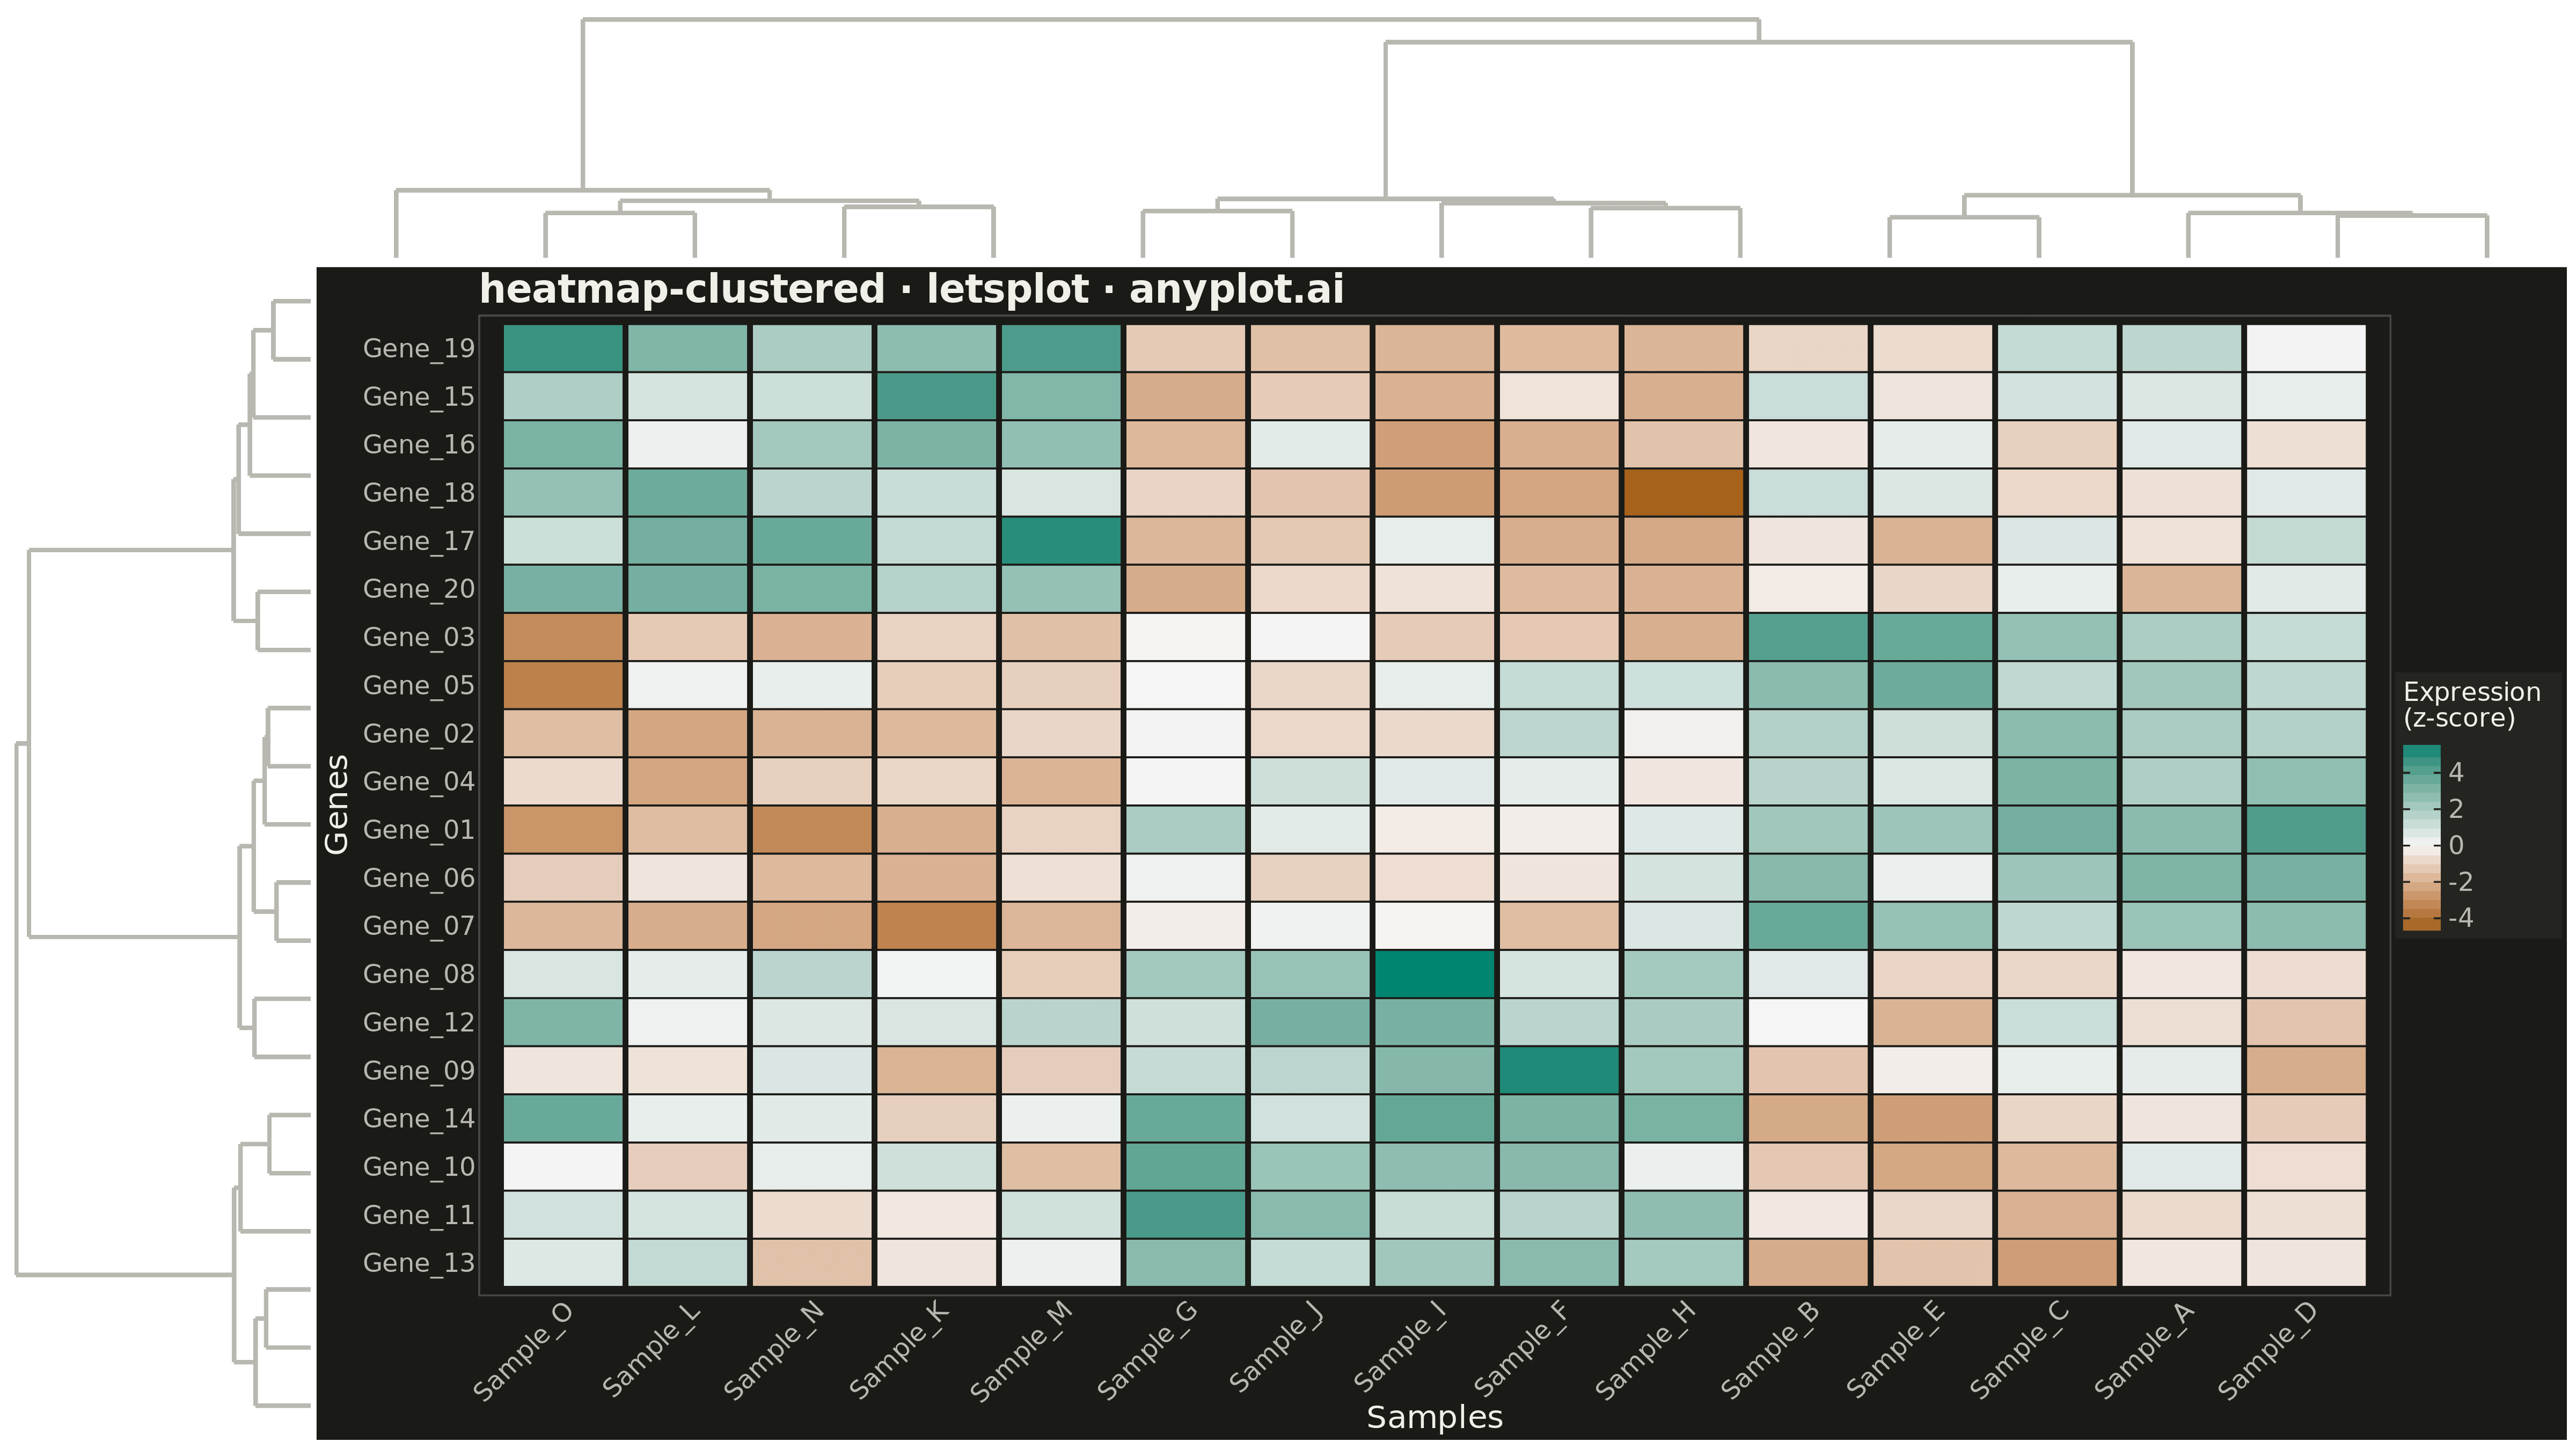
A heatmap with hierarchical clustering dendrograms on rows and/or columns, showing both data values and their hierarchical relationships. Rows and columns are automatically reordered based on clustering results to reveal natural groupings in the data. Essential for discovering patterns in high-dimensional data where similar observations or variables should be visually grouped together.
""" anyplot.ai
heatmap-clustered: Clustered Heatmap
Library: letsplot 4.9.0 | Python 3.13.13
Quality: 92/100 | Updated: 2026-05-09
"""

import os

import numpy as np
import pandas as pd
from lets_plot import *
from lets_plot.export import ggsave
from scipy.cluster.hierarchy import dendrogram, linkage


LetsPlot.setup_html()

# Theme tokens
THEME = os.getenv("ANYPLOT_THEME", "light")
PAGE_BG = "#FAF8F1" if THEME == "light" else "#1A1A17"
ELEVATED_BG = "#FFFDF6" if THEME == "light" else "#242420"
INK = "#1A1A17" if THEME == "light" else "#F0EFE8"
INK_SOFT = "#4A4A44" if THEME == "light" else "#B8B7B0"

# Data - Gene expression data for clustering analysis
np.random.seed(42)

# Generate gene names and sample names
n_genes = 20
n_samples = 15
gene_names = [f"Gene_{i + 1:02d}" for i in range(n_genes)]
sample_names = [f"Sample_{chr(65 + i)}" for i in range(n_samples)]

# Create gene expression data with cluster structure
expression_data = np.random.randn(n_genes, n_samples)

# Add cluster structure for genes
for i in range(0, 7):
    expression_data[i, 0:5] += 2.5
    expression_data[i, 10:15] -= 1.5

for i in range(7, 14):
    expression_data[i, 5:10] += 2.5
    expression_data[i, 0:5] -= 1.0

for i in range(14, 20):
    expression_data[i, 10:15] += 2.5
    expression_data[i, 5:10] -= 1.5

# Add some noise variation
expression_data += np.random.randn(n_genes, n_samples) * 0.3

# Hierarchical clustering of rows (genes) and columns (samples)
row_linkage = linkage(expression_data, method="ward")
col_linkage = linkage(expression_data.T, method="ward")

# Get dendrogram ordering
row_dendro = dendrogram(row_linkage, no_plot=True)
col_dendro = dendrogram(col_linkage, no_plot=True)
row_order = row_dendro["leaves"]
col_order = col_dendro["leaves"]

# Reorder data based on clustering
reordered_data = expression_data[row_order, :][:, col_order]
reordered_genes = [gene_names[i] for i in row_order]
reordered_samples = [sample_names[i] for i in col_order]

# Create long-form data for heatmap
heatmap_rows = []
for i, gene in enumerate(reordered_genes):
    for j, sample in enumerate(reordered_samples):
        heatmap_rows.append(
            {"Gene": gene, "Sample": sample, "Expression": reordered_data[i, j], "gene_idx": i, "sample_idx": j}
        )

heatmap_df = pd.DataFrame(heatmap_rows)
heatmap_df["Gene"] = pd.Categorical(heatmap_df["Gene"], categories=reordered_genes[::-1], ordered=True)
heatmap_df["Sample"] = pd.Categorical(heatmap_df["Sample"], categories=reordered_samples, ordered=True)

# Extract column dendrogram segments
col_segments = []
col_icoord = np.array(col_dendro["icoord"])
col_dcoord = np.array(col_dendro["dcoord"])
for i in range(len(col_icoord)):
    xs = col_icoord[i]
    ys = col_dcoord[i]
    col_segments.append((xs[0], ys[0], xs[1], ys[1]))
    col_segments.append((xs[1], ys[1], xs[2], ys[2]))
    col_segments.append((xs[2], ys[2], xs[3], ys[3]))
col_seg_df = pd.DataFrame(col_segments, columns=["x", "y", "xend", "yend"])

# Extract row dendrogram segments
row_segments = []
row_icoord = np.array(row_dendro["icoord"])
row_dcoord = np.array(row_dendro["dcoord"])
for i in range(len(row_icoord)):
    xs = row_icoord[i]
    ys = row_dcoord[i]
    row_segments.append((xs[0], ys[0], xs[1], ys[1]))
    row_segments.append((xs[1], ys[1], xs[2], ys[2]))
    row_segments.append((xs[2], ys[2], xs[3], ys[3]))
row_seg_df = pd.DataFrame(row_segments, columns=["x", "y", "xend", "yend"])

# Scale dendrogram coordinates to match heatmap
col_seg_df["x"] = (col_seg_df["x"] / 10) - 0.5
col_seg_df["xend"] = (col_seg_df["xend"] / 10) - 0.5
max_col_height = max(col_seg_df["y"].max(), col_seg_df["yend"].max())
col_seg_df["y"] = col_seg_df["y"] / max_col_height * 4
col_seg_df["yend"] = col_seg_df["yend"] / max_col_height * 4

# Row dendrogram: swap x and y for horizontal orientation
row_seg_df_rotated = pd.DataFrame(
    {
        "x": row_seg_df["y"],
        "y": (row_seg_df["x"] / 10) - 0.5,
        "xend": row_seg_df["yend"],
        "yend": (row_seg_df["xend"] / 10) - 0.5,
    }
)
max_row_height = max(row_seg_df_rotated["x"].max(), row_seg_df_rotated["xend"].max())
row_seg_df_rotated["x"] = row_seg_df_rotated["x"] / max_row_height * 4
row_seg_df_rotated["xend"] = row_seg_df_rotated["xend"] / max_row_height * 4

# Theme for plots
anyplot_theme = theme(
    plot_background=element_rect(fill=PAGE_BG, color=PAGE_BG),
    panel_background=element_rect(fill=PAGE_BG),
    panel_grid=element_blank(),
    axis_title=element_text(color=INK, size=20),
    axis_text=element_text(color=INK_SOFT),
    axis_line=element_line(color=INK_SOFT, size=0.5),
    plot_title=element_text(color=INK, size=24, face="bold"),
    legend_background=element_rect(fill=ELEVATED_BG, color=INK_SOFT),
    legend_text=element_text(color=INK_SOFT, size=16),
    legend_title=element_text(color=INK, size=16),
)

# Create heatmap plot
heatmap_plot = (
    ggplot(heatmap_df, aes(x="Sample", y="Gene", fill="Expression"))
    + geom_tile(width=0.95, height=0.95)
    + scale_fill_gradient2(low="#A6611A", mid="#F5F5F5", high="#018571", midpoint=0, name="Expression\n(z-score)")
    + labs(x="Samples", y="Genes", title="heatmap-clustered · letsplot · anyplot.ai")
    + theme_minimal()
    + theme(
        plot_title=element_text(size=24, face="bold"),
        axis_title_x=element_text(size=20),
        axis_title_y=element_text(size=20),
        axis_text_x=element_text(size=16, angle=45, hjust=1),
        axis_text_y=element_text(size=16),
        legend_title=element_text(size=16),
        legend_text=element_text(size=16),
        panel_grid=element_blank(),
    )
    + anyplot_theme
)

# Create column dendrogram (top)
col_dendro_plot = (
    ggplot(col_seg_df)
    + geom_segment(aes(x="x", y="y", xend="xend", yend="yend"), size=1.2, color=INK_SOFT)
    + scale_x_continuous(limits=[-0.5, n_samples - 0.5], expand=[0, 0])
    + scale_y_continuous(expand=[0.02, 0])
    + theme_void()
    + theme(plot_margin=[0, 0, 0, 0])
)

# Create row dendrogram (left) - needs to be mirrored
row_seg_df_rotated["x"] = 4 - row_seg_df_rotated["x"]
row_seg_df_rotated["xend"] = 4 - row_seg_df_rotated["xend"]

row_dendro_plot = (
    ggplot(row_seg_df_rotated)
    + geom_segment(aes(x="x", y="y", xend="xend", yend="yend"), size=1.2, color=INK_SOFT)
    + scale_x_continuous(expand=[0, 0.02])
    + scale_y_continuous(limits=[-0.5, n_genes - 0.5], expand=[0, 0])
    + theme_void()
    + theme(plot_margin=[0, 0, 0, 0])
)

# Combine plots using ggbunch
row_dendro_w = 0.12
col_dendro_h = 0.18
heatmap_w = 0.88
heatmap_h = 0.82

bunch = ggbunch(
    [row_dendro_plot, col_dendro_plot, heatmap_plot],
    [
        (0, col_dendro_h, row_dendro_w, heatmap_h),
        (row_dendro_w, 0, heatmap_w, col_dendro_h),
        (row_dendro_w, col_dendro_h, heatmap_w, heatmap_h),
    ],
) + ggsize(1600, 900)

# Save as PNG (scale 3x for 4800x2700)
ggsave(bunch, f"plot-{THEME}.png", path=".", scale=3)

# Save interactive HTML
ggsave(bunch, f"plot-{THEME}.html", path=".")
Runnable source as JSON, for any HTTP client: https://api.anyplot.ai/specs/heatmap-clustered/letsplot/code. Any spec id and library id listed in llms-full.txt fit the same URL shape; every URL below is complete and callable.
{
  "spec_id": "heatmap-clustered",
  "language": "python",
  "library": "letsplot",
  "page": "https://anyplot.ai/heatmap-clustered/python/letsplot",
  "hub": "https://anyplot.ai/heatmap-clustered",
  "code_json": "https://api.anyplot.ai/specs/heatmap-clustered/letsplot/code",
  "spec_json": "https://api.anyplot.ai/specs/heatmap-clustered",
  "render_light_png": "https://storage.googleapis.com/anyplot-images/plots/heatmap-clustered/python/letsplot/plot-light.png",
  "render_dark_png": "https://storage.googleapis.com/anyplot-images/plots/heatmap-clustered/python/letsplot/plot-dark.png",
  "interactive_light_html": "https://storage.googleapis.com/anyplot-images/plots/heatmap-clustered/python/letsplot/plot-light.html",
  "interactive_dark_html": "https://storage.googleapis.com/anyplot-images/plots/heatmap-clustered/python/letsplot/plot-dark.html",
  "quality_score": 92.0,
  "license": "MIT",
  "guide": "https://anyplot.ai/llms.txt"
}
Part of Clustered Heatmap on anyplot.ai.