The same plot in 14 other libraries — Python: Altair, Bokeh, lets-plot, Matplotlib, Plotly, plotnine, Pygal, Seaborn; R: ggplot2; JavaScript: Chart.js, D3.js, Apache ECharts, Highcharts, MUI X Charts. Compare all 15 side by side: Clustered Heatmap in Python, R, Julia and JavaScript.
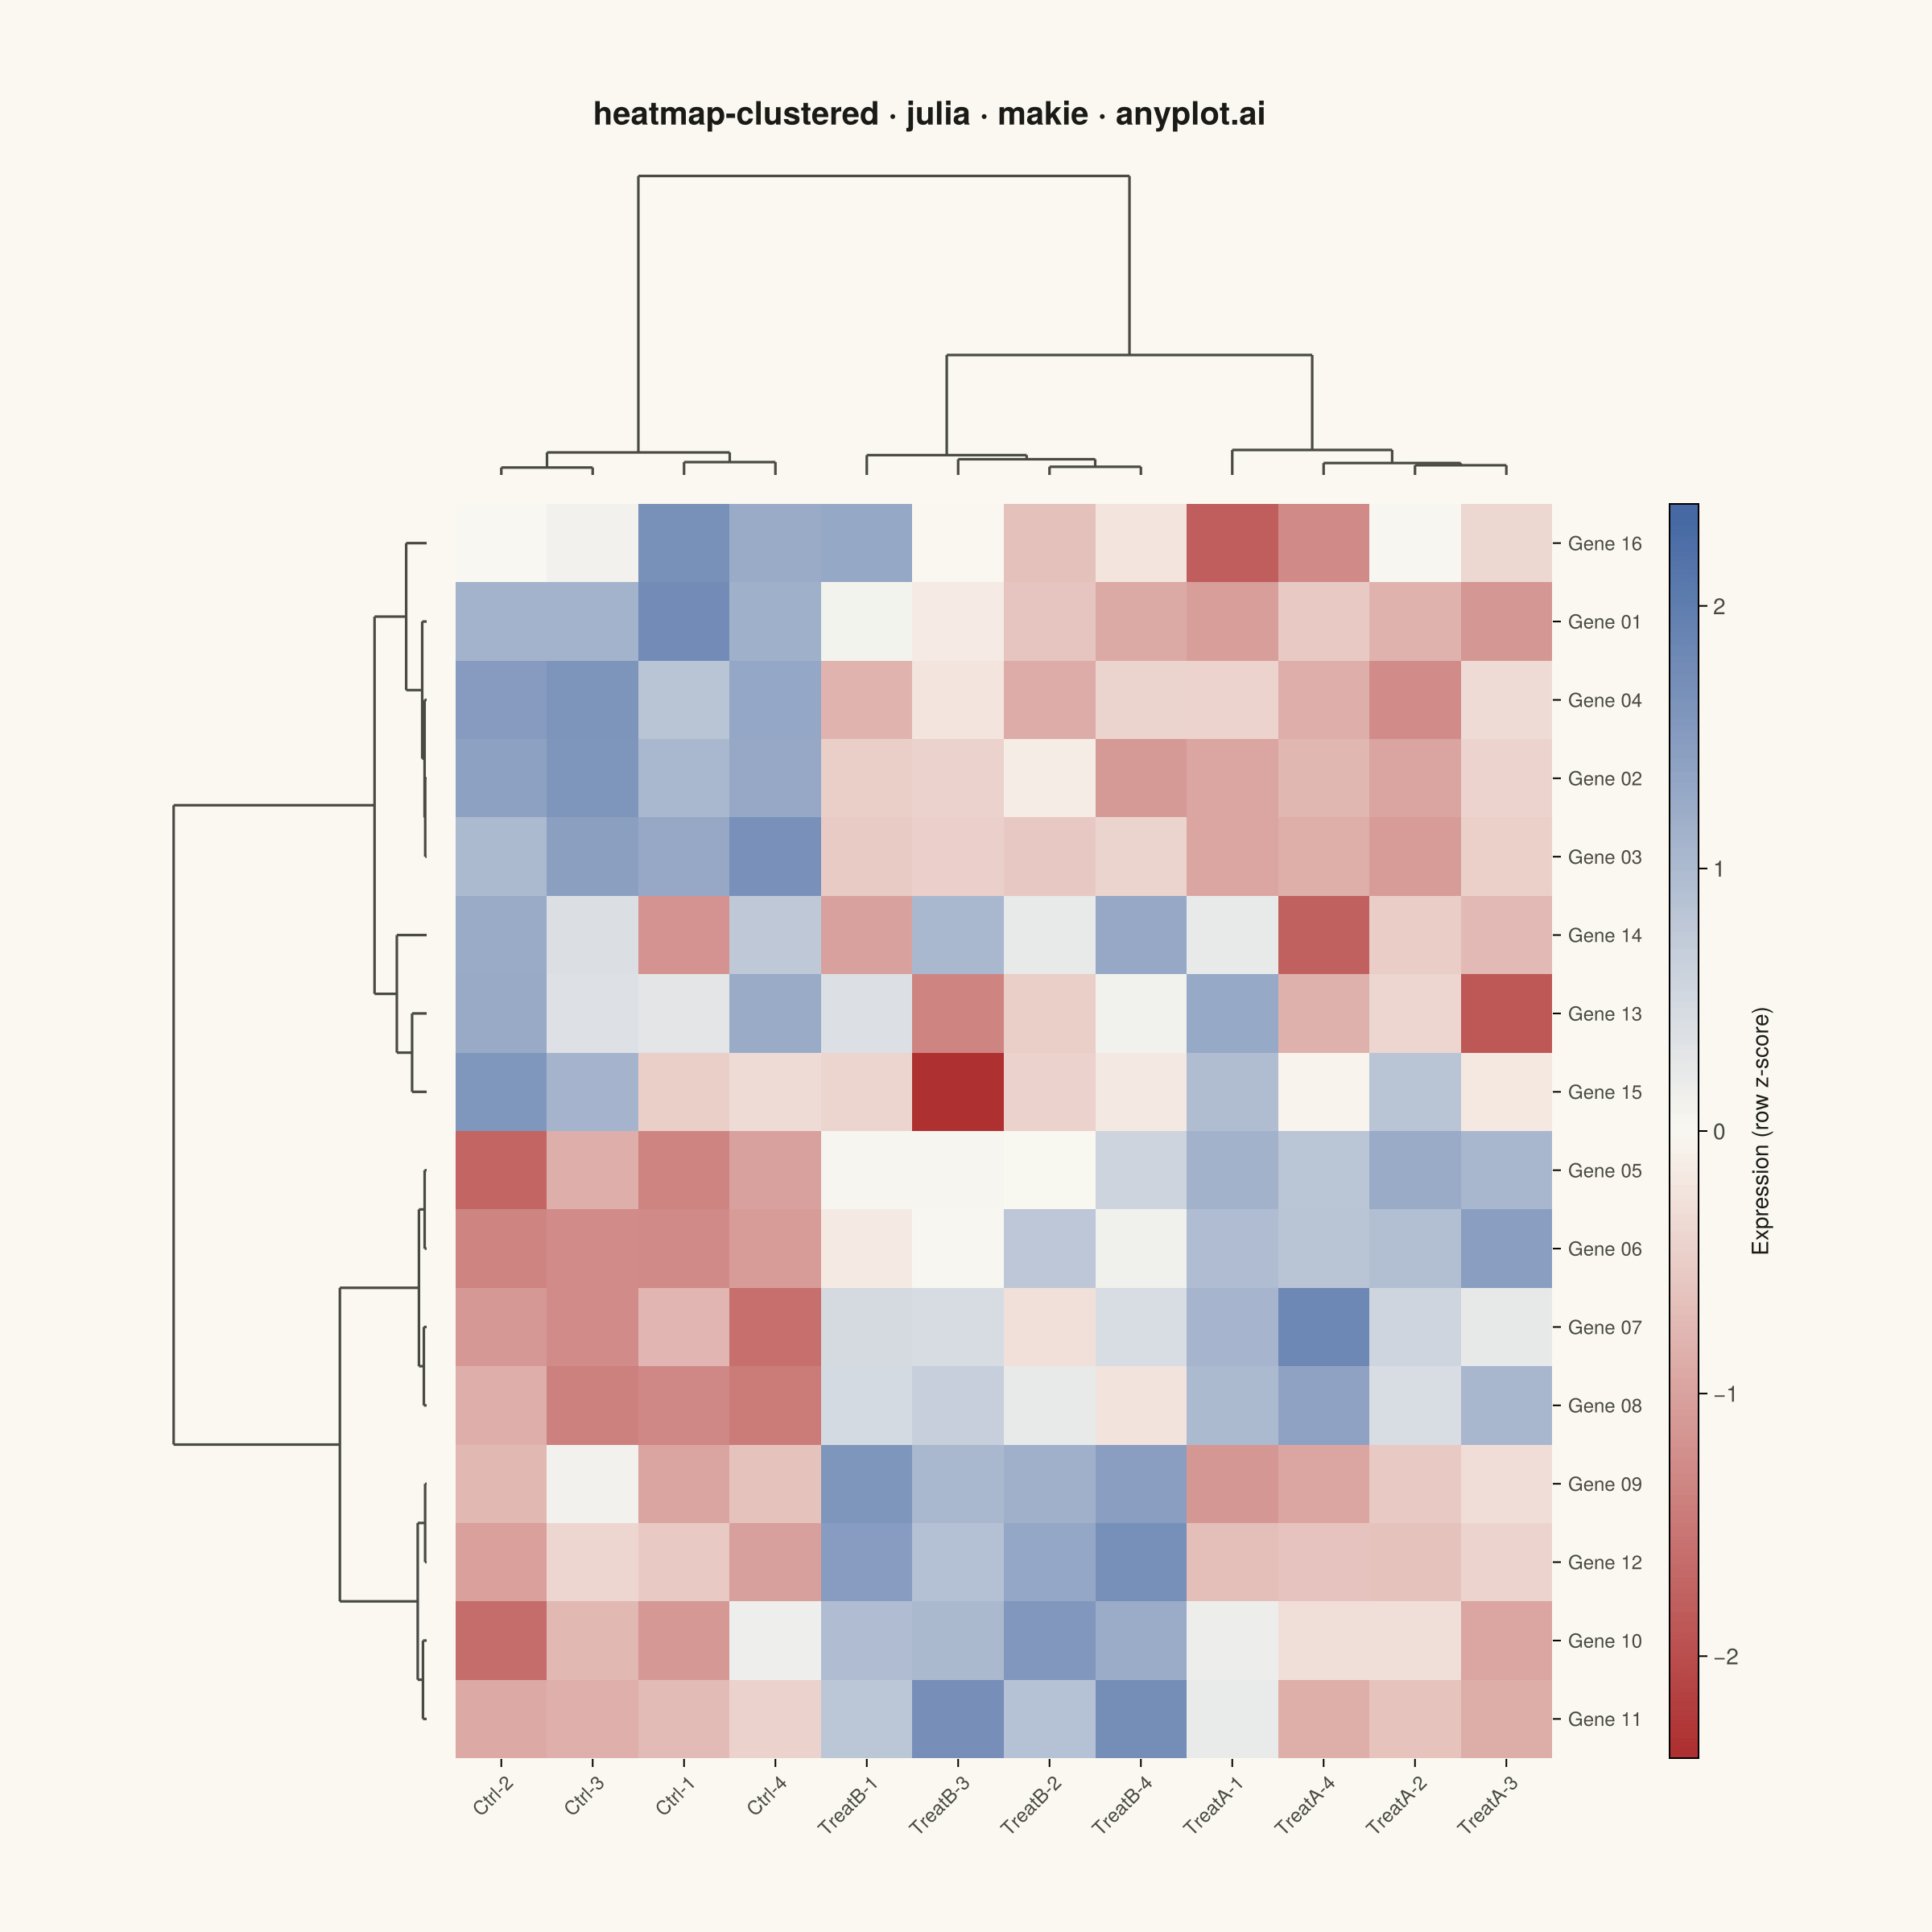
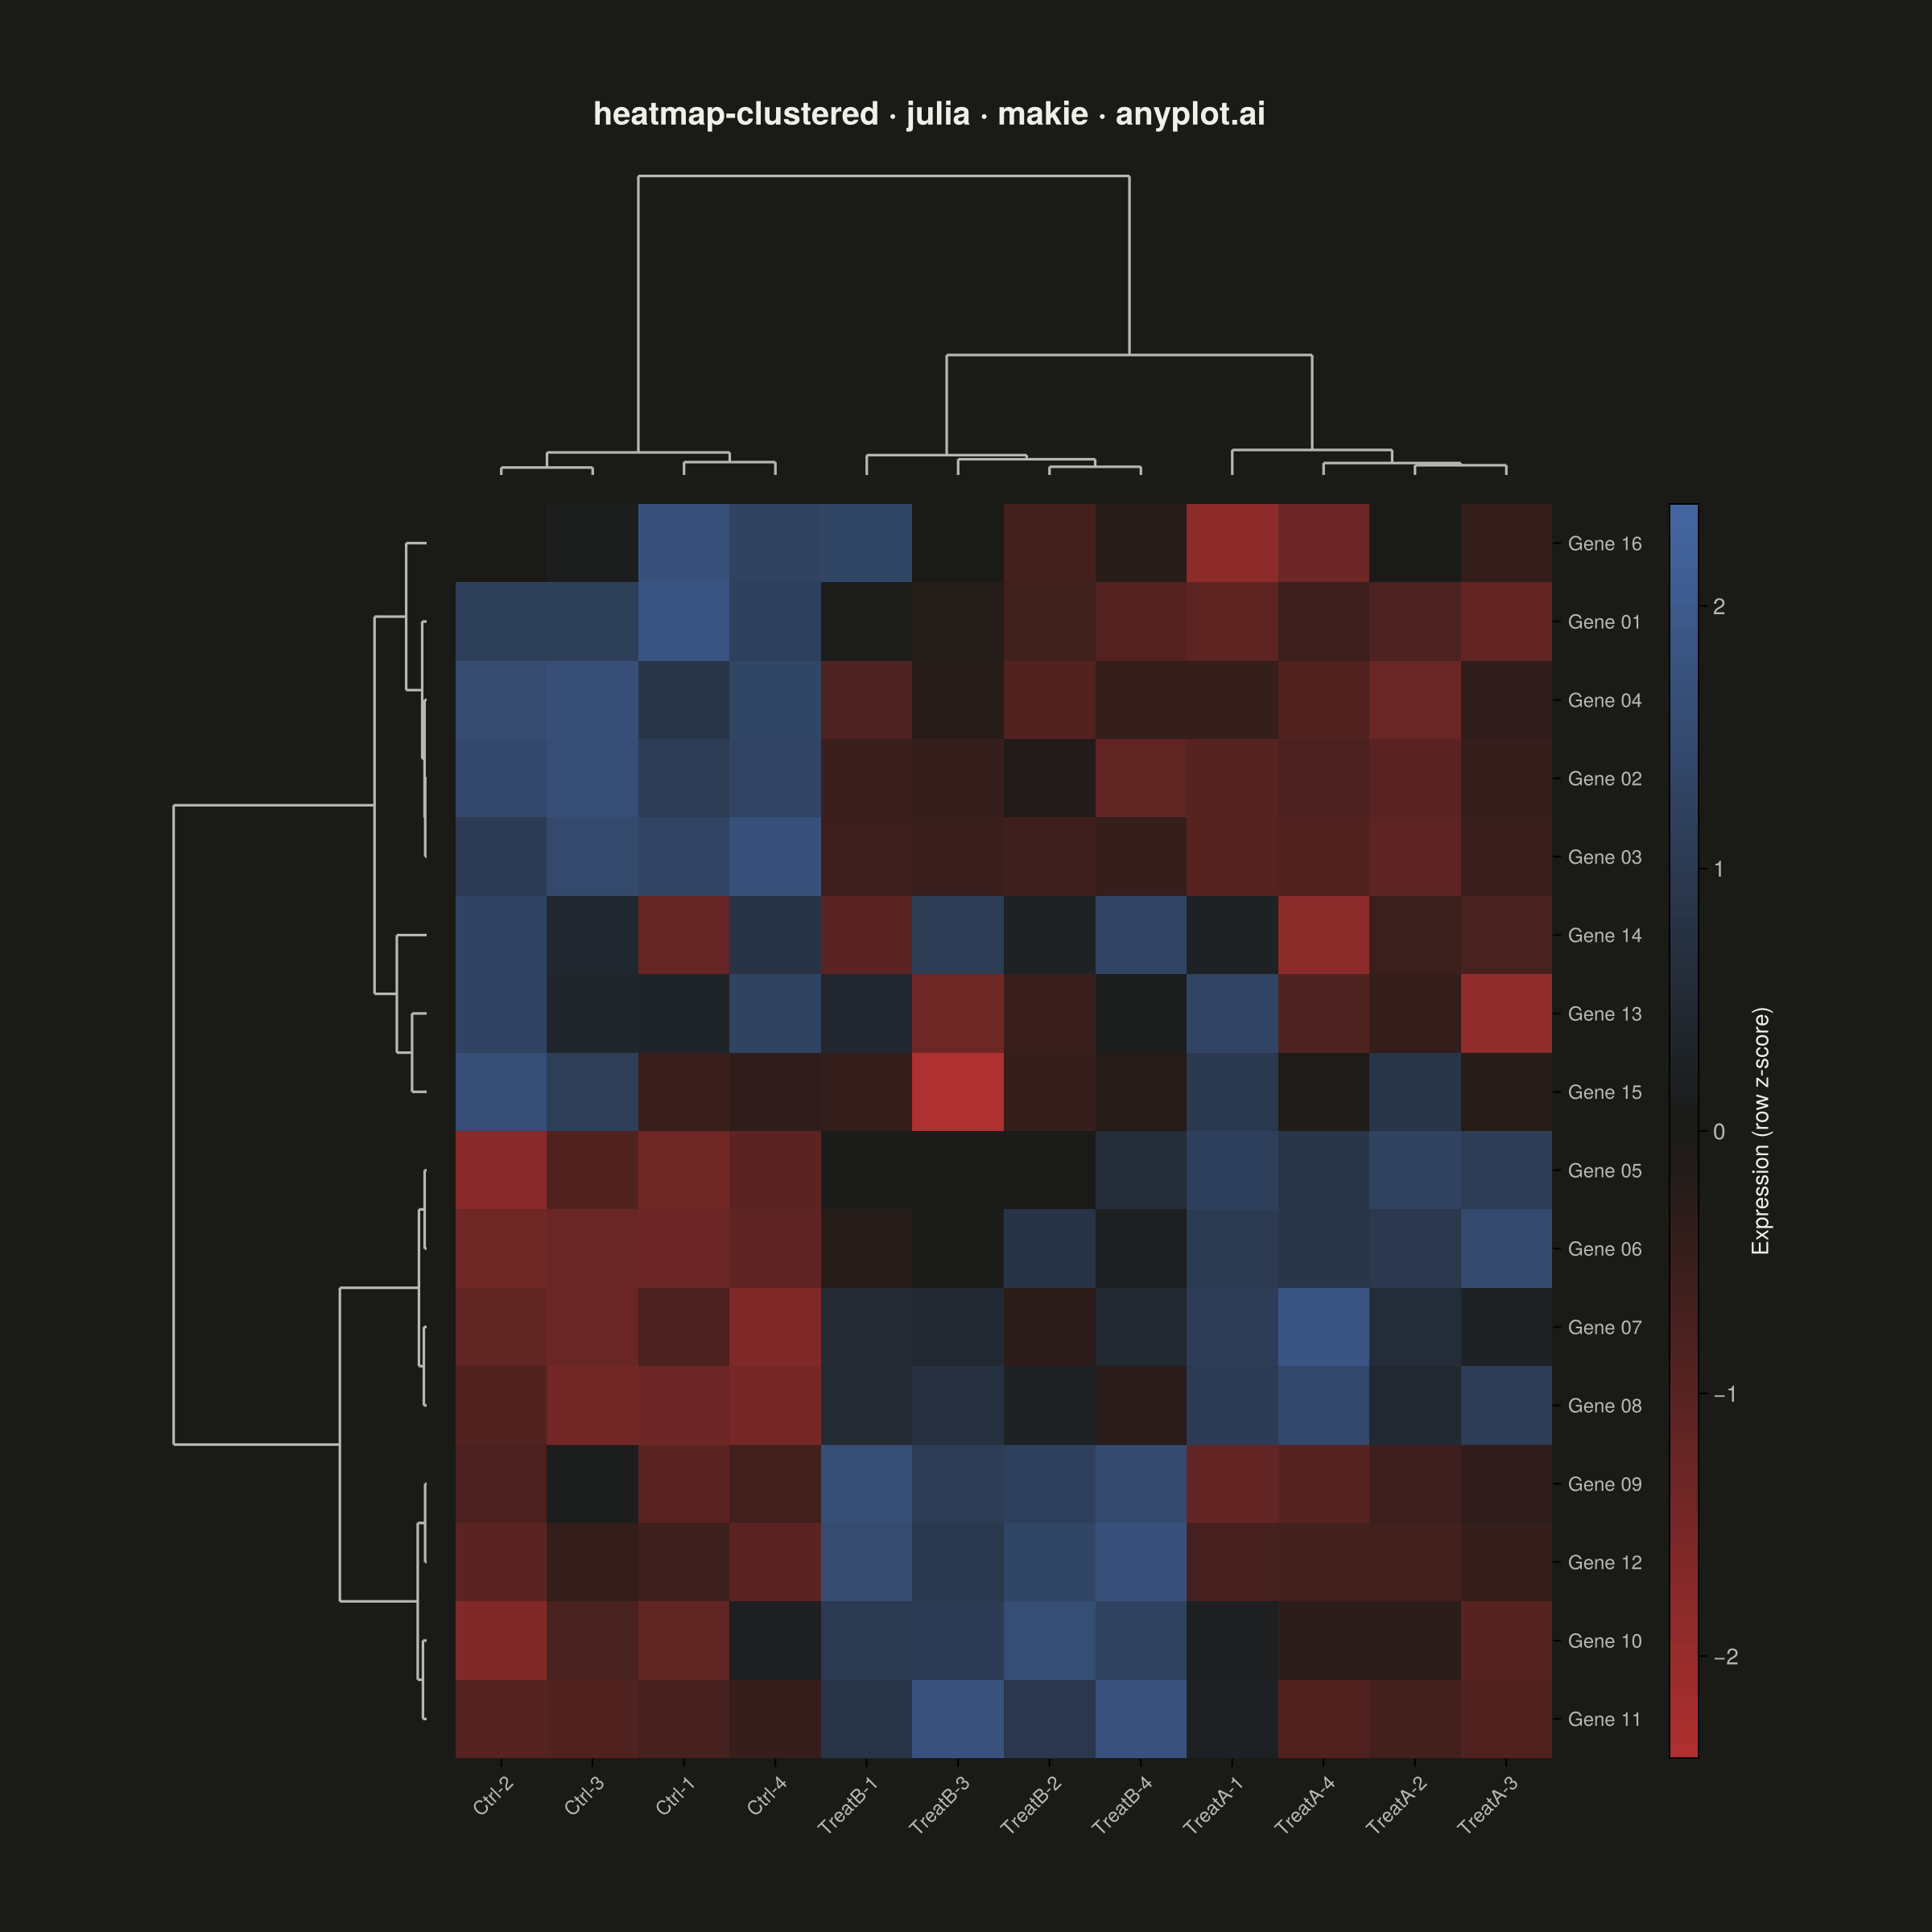
A heatmap with hierarchical clustering dendrograms on both rows and columns, showing both data values and their hierarchical relationships. Rows and columns are automatically reordered based on clustering results to reveal natural groupings in the data. Essential for discovering patterns in high-dimensional data where similar observations or variables should be visually grouped together.
# anyplot.ai
# heatmap-clustered: Clustered Heatmap
# Library: makie 0.21.9 | Julia 1.11.9
# Quality: 79/100 | Created: 2026-09-05

using CairoMakie
using Colors
using ColorSchemes
using Random

Random.seed!(42)

# --- Theme tokens -----------------------------------------------------------
const THEME    = get(ENV, "ANYPLOT_THEME", "light")
const PAGE_BG  = THEME == "light" ? colorant"#FAF8F1" : colorant"#1A1A17"
const INK      = THEME == "light" ? colorant"#1A1A17" : colorant"#F0EFE8"
const INK_SOFT = THEME == "light" ? colorant"#4A4A44" : colorant"#B8B7B0"
const _MIDPOINT = THEME == "light" ? colorant"#FAF8F1" : colorant"#1A1A17"
const IMPRINT_DIV = cgrad([colorant"#AE3030", _MIDPOINT, colorant"#4467A3"])
const IMPRINT_PALETTE = [colorant"#009E73", colorant"#C475FD", colorant"#4467A3"]

# --- Hierarchical clustering (Ward's method, Lance-Williams update) --------

function pairwise_sqdist(X::AbstractMatrix{<:Real})
    n = size(X, 1)
    D = zeros(Float64, n, n)
    for i in 1:n, j in (i + 1):n
        d = sum((X[i, :] .- X[j, :]) .^ 2)
        D[i, j] = d
        D[j, i] = d
    end
    return D
end

function ward_linkage(D::Matrix{Float64})
    n = size(D, 1)
    dist = fill(Inf, 2n - 1, 2n - 1)
    dist[1:n, 1:n] .= D
    sizes = ones(Int, 2n - 1)
    active = collect(1:n)
    merge_a = zeros(Int, n - 1)
    merge_b = zeros(Int, n - 1)
    merge_h = zeros(Float64, n - 1)

    for step in 1:(n - 1)
        best = Inf
        bi, bj = active[1], active[2]
        for ai in 1:length(active), aj in (ai + 1):length(active)
            i, j = active[ai], active[aj]
            d = dist[min(i, j), max(i, j)]
            if d < best
                best = d
                bi, bj = i, j
            end
        end

        new_id = n + step
        merge_a[step] = bi
        merge_b[step] = bj
        merge_h[step] = best

        ni, nj = sizes[bi], sizes[bj]
        for a in active
            if a == bi || a == bj
                continue
            end
            nm = sizes[a]
            d_im = dist[min(bi, a), max(bi, a)]
            d_jm = dist[min(bj, a), max(bj, a)]
            dist[min(a, new_id), max(a, new_id)] = ((ni + nm) * d_im + (nj + nm) * d_jm - nm * best) / (ni + nj + nm)
        end

        sizes[new_id] = ni + nj
        filter!(x -> x != bi && x != bj, active)
        push!(active, new_id)
    end

    return merge_a, merge_b, merge_h
end

function collect_leaves!(order, xpos, merge_a, merge_b, n, node_id)
    if node_id <= n
        push!(order, node_id)
        xpos[node_id] = Float64(length(order))
    else
        step = node_id - n
        collect_leaves!(order, xpos, merge_a, merge_b, n, merge_a[step])
        collect_leaves!(order, xpos, merge_a, merge_b, n, merge_b[step])
        xpos[node_id] = (xpos[merge_a[step]] + xpos[merge_b[step]]) / 2
    end
    return nothing
end

function dendrogram_segments(merge_a, merge_b, merge_h, xpos, n)
    pos_pts = Float64[]
    height_pts = Float64[]
    for step in 1:length(merge_h)
        a, b, h = merge_a[step], merge_b[step], merge_h[step]
        ha = a <= n ? 0.0 : merge_h[a - n]
        hb = b <= n ? 0.0 : merge_h[b - n]
        pa, pb = xpos[a], xpos[b]
        append!(pos_pts, (pa, pa, NaN, pb, pb, NaN, pa, pb, NaN))
        append!(height_pts, (ha, h, NaN, hb, h, NaN, h, h, NaN))
    end
    return pos_pts, height_pts
end

# --- Data --------------------------------------------------------------------
# Gene expression across control + two treatment conditions, four replicates
# each. Genes fall into four latent co-expression modules so clustering
# recovers a block structure once rows and columns are reordered.
n_genes = 16
n_samples = 12

conditions = repeat(["Ctrl", "TreatA", "TreatB"], inner = 4)
replicate = repeat(1:4, outer = 3)
column_labels = [conditions[i] * "-" * string(replicate[i]) for i in 1:n_samples]
row_labels = ["Gene " * lpad(string(g), 2, "0") for g in 1:n_genes]

gene_module = repeat(1:4, inner = 4)
module_pattern = Dict(
    1 => Dict("Ctrl" => 2.0, "TreatA" => -1.5, "TreatB" => -1.0),
    2 => Dict("Ctrl" => -1.5, "TreatA" => 2.0, "TreatB" => 0.5),
    3 => Dict("Ctrl" => -0.5, "TreatA" => -0.5, "TreatB" => 2.2),
    4 => Dict("Ctrl" => 0.2, "TreatA" => -0.2, "TreatB" => 0.1),
)

expression = zeros(Float64, n_genes, n_samples)
for g in 1:n_genes, s in 1:n_samples
    expression[g, s] = module_pattern[gene_module[g]][conditions[s]] + randn() * 0.6
end

row_mean = [sum(expression[g, :]) / n_samples for g in 1:n_genes]
row_std = [sqrt(sum((expression[g, :] .- row_mean[g]) .^ 2) / n_samples) for g in 1:n_genes]
zscore = (expression .- row_mean) ./ row_std
zmax = maximum(abs.(zscore))

# --- Clustering ---------------------------------------------------------------
row_merge_a, row_merge_b, row_merge_h = ward_linkage(pairwise_sqdist(zscore))
col_merge_a, col_merge_b, col_merge_h = ward_linkage(pairwise_sqdist(Matrix(zscore')))

row_order = Int[]
row_xpos = Dict{Int,Float64}()
collect_leaves!(row_order, row_xpos, row_merge_a, row_merge_b, n_genes, 2 * n_genes - 1)

col_order = Int[]
col_xpos = Dict{Int,Float64}()
collect_leaves!(col_order, col_xpos, col_merge_a, col_merge_b, n_samples, 2 * n_samples - 1)

zscore_reordered = zscore[row_order, col_order]
row_labels_reordered = row_labels[row_order]
col_labels_reordered = column_labels[col_order]

# Ctrl/TreatA/TreatB group-color annotation strip, reordered alongside columns.
condition_colors = Dict(
    "Ctrl" => IMPRINT_PALETTE[1], "TreatA" => IMPRINT_PALETTE[2], "TreatB" => IMPRINT_PALETTE[3],
)
col_group_img = reshape([condition_colors[conditions[i]] for i in col_order], n_samples, 1)

row_pos, row_height = dendrogram_segments(row_merge_a, row_merge_b, row_merge_h, row_xpos, n_genes)
col_pos, col_height = dendrogram_segments(col_merge_a, col_merge_b, col_merge_h, col_xpos, n_samples)
row_max_height = maximum(row_merge_h)
col_max_height = maximum(col_merge_h)

# --- Plot ----------------------------------------------------------------------
fig = Figure(
    size            = (1200, 1200),
    fontsize        = 14,
    backgroundcolor = PAGE_BG,
)

Label(
    fig[1, 1:3], "heatmap-clustered · julia · makie · anyplot.ai";
    fontsize = 20, color = INK, font = :bold,
)

col_dendro_ax = Axis(
    fig[2, 2];
    backgroundcolor = PAGE_BG,
    limits          = (0.5, n_samples + 0.5, 0.0, col_max_height * 1.05),
)
lines!(col_dendro_ax, col_pos, col_height; color = INK_SOFT, linewidth = 1.6)
hidedecorations!(col_dendro_ax)
hidespines!(col_dendro_ax)

Legend(
    fig[2, 3],
    [PolyElement(color = c) for c in IMPRINT_PALETTE],
    ["Ctrl", "TreatA", "TreatB"],
    "Group";
    labelcolor = INK_SOFT, titlecolor = INK, framevisible = false,
    labelsize = 12, titlesize = 12, patchsize = (12, 12),
)

col_group_ax = Axis(
    fig[3, 2];
    backgroundcolor = PAGE_BG,
    limits          = (0.5, n_samples + 0.5, 0.0, 1.0),
)
image!(col_group_ax, 0.5 .. (n_samples + 0.5), 0.0 .. 1.0, col_group_img; interpolate = false)
hidedecorations!(col_group_ax)
hidespines!(col_group_ax)

row_dendro_ax = Axis(
    fig[4, 1];
    backgroundcolor = PAGE_BG,
    limits          = (0.0, row_max_height * 1.05, 0.5, n_genes + 0.5),
    xreversed       = true,
    yreversed       = true,
)
lines!(row_dendro_ax, row_height, row_pos; color = INK_SOFT, linewidth = 1.6)
hidedecorations!(row_dendro_ax)
hidespines!(row_dendro_ax)

heat_ax = Axis(
    fig[4, 2];
    backgroundcolor      = PAGE_BG,
    limits               = (0.5, n_samples + 0.5, 0.5, n_genes + 0.5),
    yreversed            = true,
    xticks               = (1:n_samples, col_labels_reordered),
    yticks               = (1:n_genes, row_labels_reordered),
    xticklabelrotation   = pi / 4,
    xticklabelcolor      = INK_SOFT,
    yticklabelcolor      = INK_SOFT,
    xticklabelsize       = 12,
    yticklabelsize       = 12,
    yaxisposition        = :right,
    xgridvisible         = false,
    ygridvisible         = false,
    topspinevisible      = false,
    rightspinevisible    = false,
    leftspinevisible     = false,
    bottomspinevisible   = false,
)
hm = heatmap!(
    heat_ax, 1:n_samples, 1:n_genes, permutedims(zscore_reordered);
    colormap = IMPRINT_DIV, colorrange = (-zmax, zmax),
)

# Thin theme-adaptive cell grid + outer frame so near-zero cells (which sit at
# the midpoint color, equal to the page background) stay visually separated
# from each other and from the canvas in both themes.
grid_color = RGBAf(INK.r, INK.g, INK.b, 0.15)
v_segs = Point2f[]
for gx in 0.5:1.0:(n_samples + 0.5)
    push!(v_segs, Point2f(gx, 0.5), Point2f(gx, n_genes + 0.5))
end
h_segs = Point2f[]
for gy in 0.5:1.0:(n_genes + 0.5)
    push!(h_segs, Point2f(0.5, gy), Point2f(n_samples + 0.5, gy))
end
linesegments!(heat_ax, v_segs; color = grid_color, linewidth = 0.75)
linesegments!(heat_ax, h_segs; color = grid_color, linewidth = 0.75)

Colorbar(
    fig[4, 3], hm;
    label = "Expression (row z-score)", labelcolor = INK,
    ticklabelcolor = INK_SOFT, width = 18,
)

colsize!(fig.layout, 1, Relative(0.14))
colsize!(fig.layout, 2, Relative(0.62))
colsize!(fig.layout, 3, Relative(0.24))
rowsize!(fig.layout, 2, Relative(0.13))
rowsize!(fig.layout, 3, Relative(0.05))
rowsize!(fig.layout, 4, Relative(0.70))

# --- Save -----------------------------------------------------------------------
save("plot-$(THEME).png", fig; px_per_unit = 2)
Runnable source as JSON, for any HTTP client: https://api.anyplot.ai/specs/heatmap-clustered/makie/code. Any spec id and library id listed in llms-full.txt fit the same URL shape; every URL below is complete and callable.
{
  "spec_id": "heatmap-clustered",
  "language": "julia",
  "library": "makie",
  "page": "https://anyplot.ai/heatmap-clustered/julia/makie",
  "hub": "https://anyplot.ai/heatmap-clustered",
  "code_json": "https://api.anyplot.ai/specs/heatmap-clustered/makie/code",
  "spec_json": "https://api.anyplot.ai/specs/heatmap-clustered",
  "render_light_png": "https://storage.googleapis.com/anyplot-images/plots/heatmap-clustered/julia/makie/plot-light.png",
  "render_dark_png": "https://storage.googleapis.com/anyplot-images/plots/heatmap-clustered/julia/makie/plot-dark.png",
  "quality_score": 79.0,
  "license": "MIT",
  "guide": "https://anyplot.ai/llms.txt"
}
Part of Clustered Heatmap on anyplot.ai.