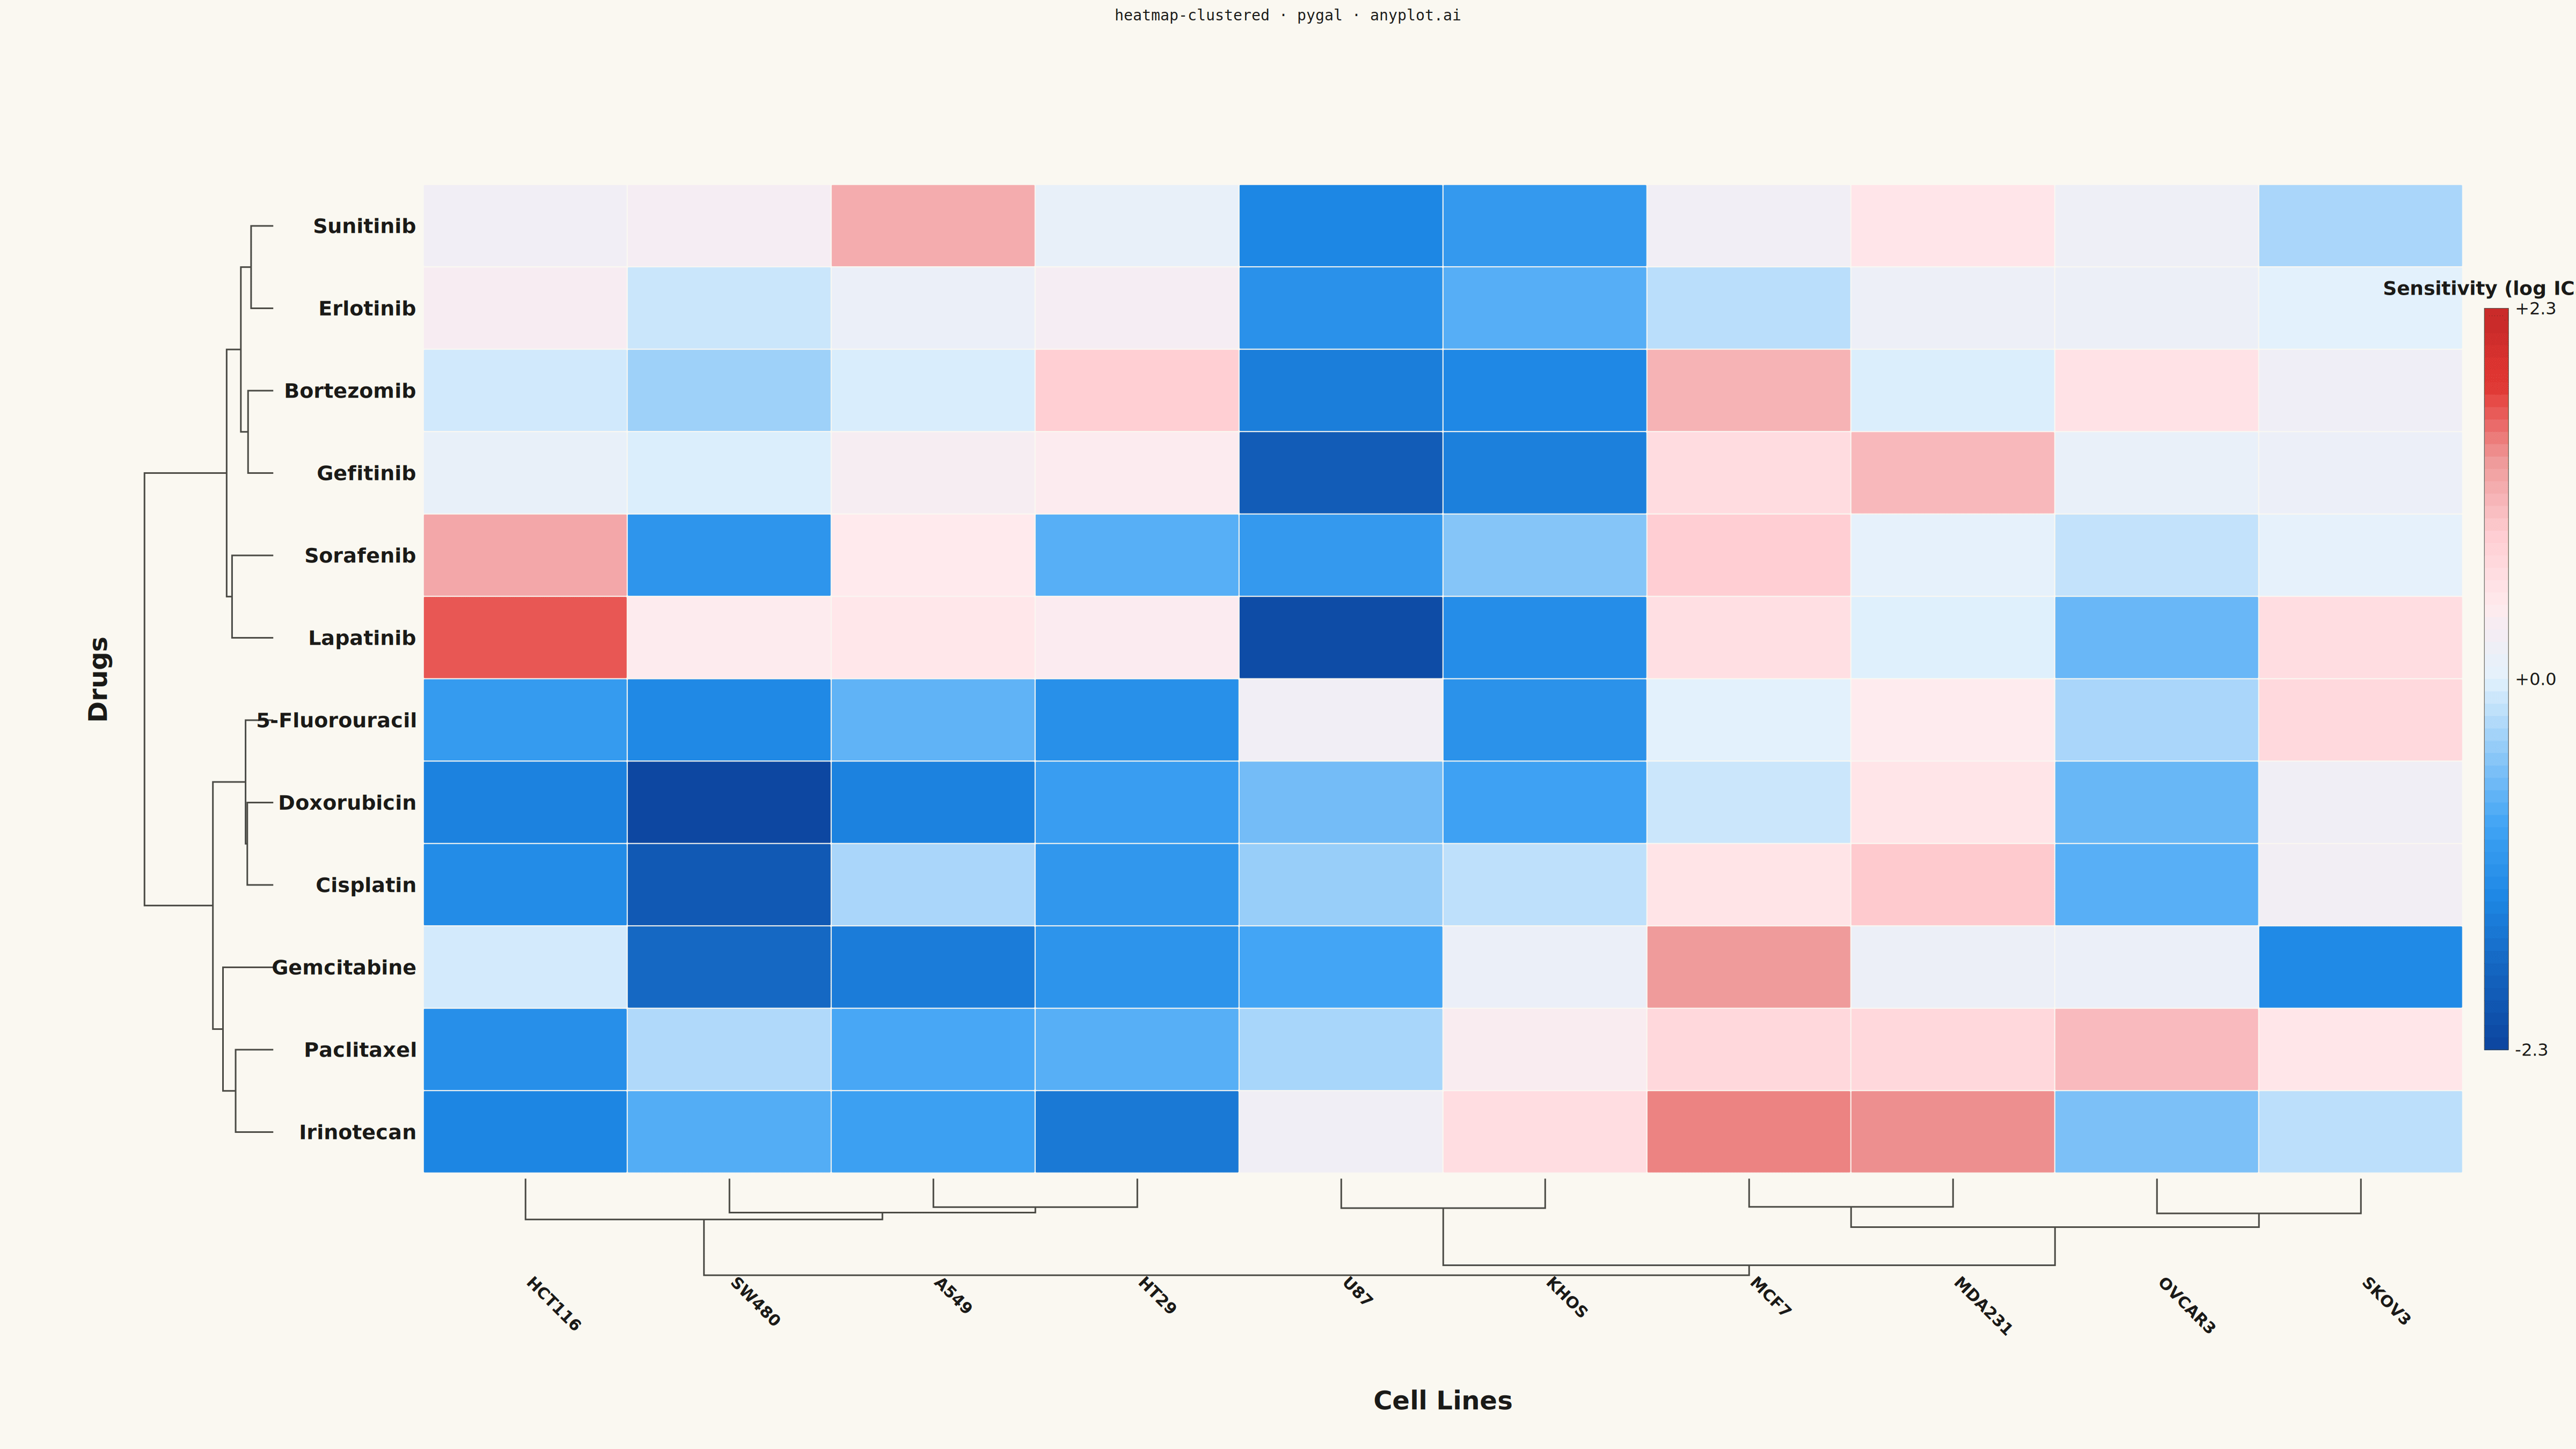
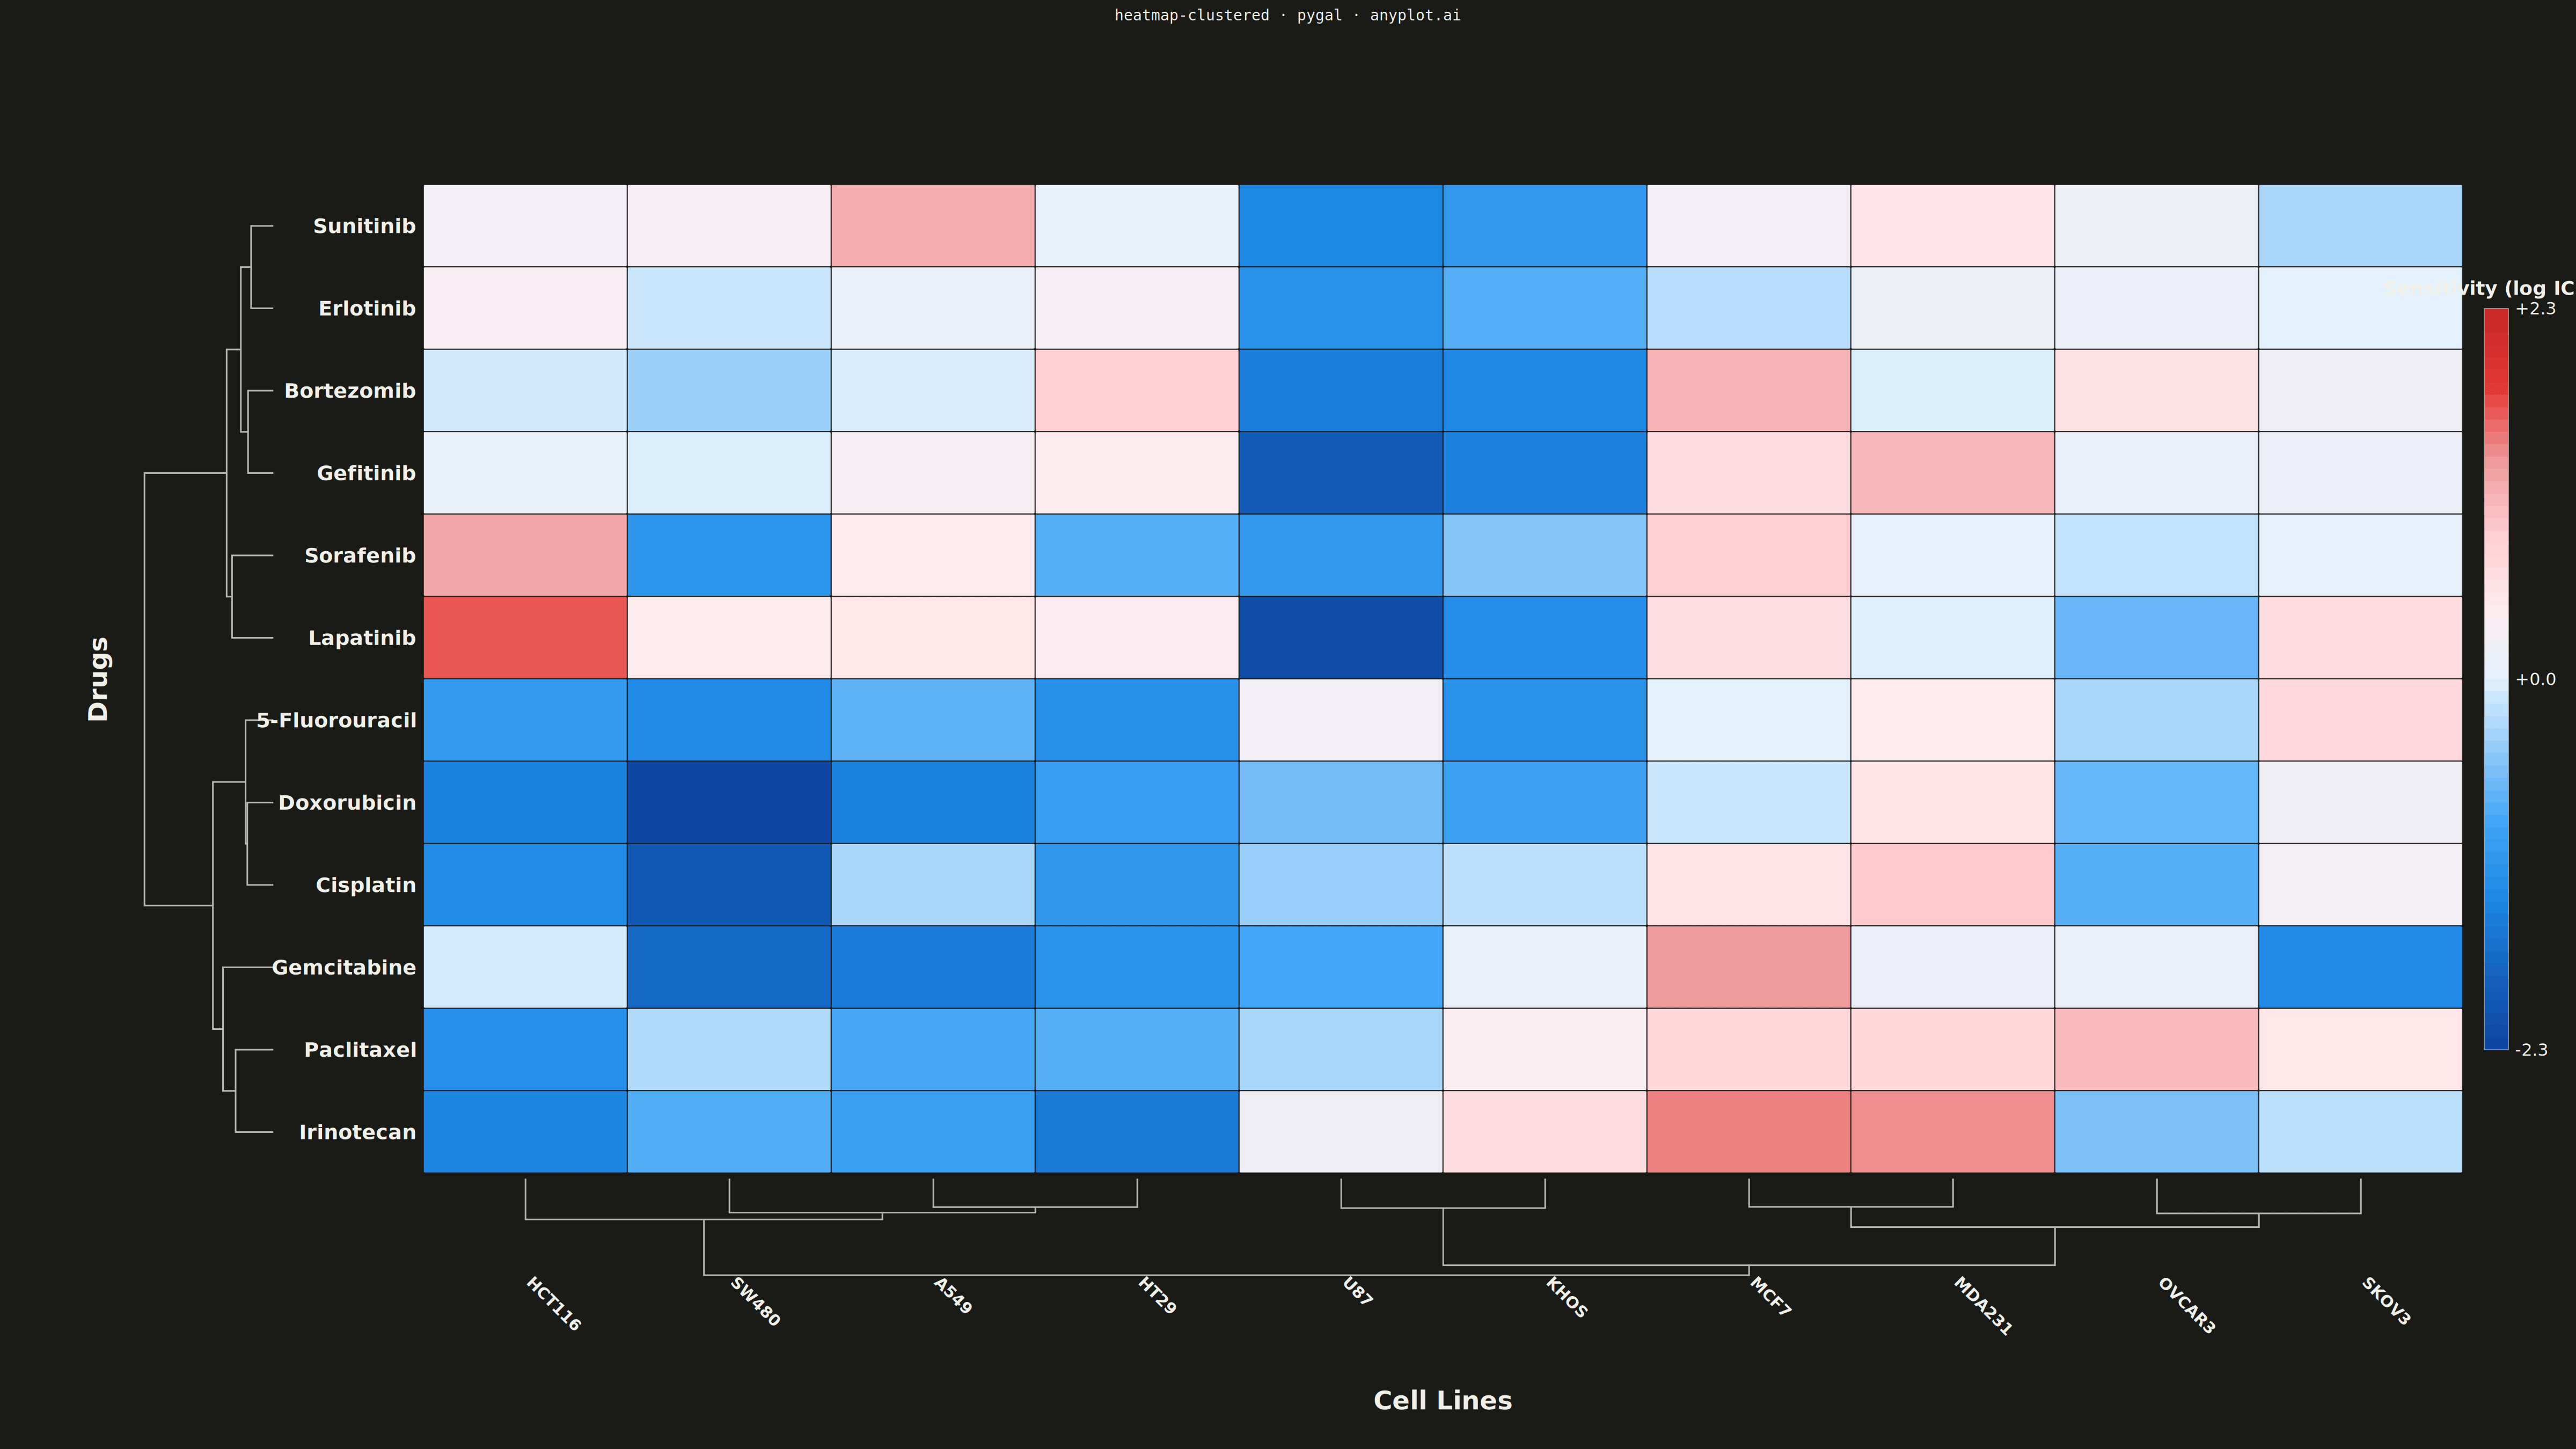
A heatmap with hierarchical clustering dendrograms on rows and/or columns, showing both data values and their hierarchical relationships. Rows and columns are automatically reordered based on clustering results to reveal natural groupings in the data. Essential for discovering patterns in high-dimensional data where similar observations or variables should be visually grouped together.
""" anyplot.ai
heatmap-clustered: Clustered Heatmap
Library: pygal 3.1.0 | Python 3.13.13
Quality: 92/100 | Updated: 2026-05-09
"""

import os
import sys

import numpy as np
from scipy.cluster.hierarchy import dendrogram, linkage
from scipy.spatial.distance import pdist


THEME = os.getenv("ANYPLOT_THEME", "light")

# Temporarily remove current directory from path to avoid name collision
_cwd = sys.path[0] if sys.path[0] else "."
if _cwd in sys.path:
    sys.path.remove(_cwd)

from pygal.graph.graph import Graph
from pygal.style import Style


# Restore path
sys.path.insert(0, _cwd)

# Theme tokens
PAGE_BG = "#FAF8F1" if THEME == "light" else "#1A1A17"
INK = "#1A1A17" if THEME == "light" else "#F0EFE8"
INK_SOFT = "#4A4A44" if THEME == "light" else "#B8B7B0"


class ClusteredHeatmap(Graph):
    """Custom Clustered Heatmap for pygal - displays matrix with hierarchical clustering dendrograms."""

    def __init__(self, *args, **kwargs):
        self.matrix_data = kwargs.pop("matrix_data", [])
        self.row_labels = kwargs.pop("row_labels", [])
        self.col_labels = kwargs.pop("col_labels", [])
        self.colormap = kwargs.pop("colormap", [])
        self.show_values = kwargs.pop("show_values", False)
        self.row_linkage = kwargs.pop("row_linkage", None)
        self.col_linkage = kwargs.pop("col_linkage", None)
        self.row_order = kwargs.pop("row_order", None)
        self.col_order = kwargs.pop("col_order", None)
        self.colorbar_label = kwargs.pop("colorbar_label", "Value")
        super().__init__(*args, **kwargs)

    def _interpolate_color(self, value, min_val, max_val):
        """Interpolate color for diverging colormap."""
        if max_val == min_val:
            return self.colormap[len(self.colormap) // 2]

        normalized = (value - min_val) / (max_val - min_val)
        normalized = max(0, min(1, normalized))

        pos = normalized * (len(self.colormap) - 1)
        idx1 = int(pos)
        idx2 = min(idx1 + 1, len(self.colormap) - 1)
        frac = pos - idx1

        c1 = self.colormap[idx1]
        c2 = self.colormap[idx2]

        r1, g1, b1 = int(c1[1:3], 16), int(c1[3:5], 16), int(c1[5:7], 16)
        r2, g2, b2 = int(c2[1:3], 16), int(c2[3:5], 16), int(c2[5:7], 16)

        r = int(r1 + (r2 - r1) * frac)
        g = int(g1 + (g2 - g1) * frac)
        b = int(b1 + (b2 - b1) * frac)

        return f"#{r:02x}{g:02x}{b:02x}"

    def _get_text_color(self, bg_color):
        """Get contrasting text color based on background brightness."""
        r, g, b = int(bg_color[1:3], 16), int(bg_color[3:5], 16), int(bg_color[5:7], 16)
        brightness = (r * 299 + g * 587 + b * 114) / 1000
        return "#ffffff" if brightness < 140 else INK

    def _draw_dendrogram(self, group, linkage_matrix, x_offset, y_offset, width, height, orientation="left"):
        """Draw dendrogram from hierarchical clustering linkage matrix."""
        if linkage_matrix is None or len(linkage_matrix) == 0:
            return

        dend = dendrogram(linkage_matrix, no_plot=True, orientation=orientation)

        icoord = np.array(dend["icoord"])
        dcoord = np.array(dend["dcoord"])

        max_d = dcoord.max() if dcoord.max() > 0 else 1
        n_leaves = len(dend["leaves"])
        stroke_width = 3

        for i in range(len(icoord)):
            if orientation in ("left", "right"):
                xs = dcoord[i] / max_d * width
                ys = (icoord[i] / (n_leaves * 10)) * height

                if orientation == "left":
                    xs = width - xs

                path_data = f"M {x_offset + xs[0]} {y_offset + ys[0]} "
                for j in range(1, 4):
                    path_data += f"L {x_offset + xs[j]} {y_offset + ys[j]} "

            else:
                xs = (icoord[i] / (n_leaves * 10)) * width
                ys = dcoord[i] / max_d * height

                if orientation == "top":
                    ys = height - ys

                path_data = f"M {x_offset + xs[0]} {y_offset + ys[0]} "
                for j in range(1, 4):
                    path_data += f"L {x_offset + xs[j]} {y_offset + ys[j]} "

            path = self.svg.node(group, "path")
            path.set("d", path_data)
            path.set("fill", "none")
            path.set("stroke", INK_SOFT)
            path.set("stroke-width", str(stroke_width))

    def _plot(self):
        """Draw the clustered heatmap with dendrograms."""
        if not self.matrix_data:
            return

        matrix = np.array(self.matrix_data)
        if self.row_order is not None:
            matrix = matrix[self.row_order, :]
            reordered_row_labels = [self.row_labels[i] for i in self.row_order]
        else:
            reordered_row_labels = self.row_labels

        if self.col_order is not None:
            matrix = matrix[:, self.col_order]
            reordered_col_labels = [self.col_labels[i] for i in self.col_order]
        else:
            reordered_col_labels = self.col_labels

        n_rows, n_cols = matrix.shape

        min_val = matrix.min()
        max_val = matrix.max()
        abs_max = max(abs(min_val), abs(max_val))
        min_val, max_val = -abs_max, abs_max

        plot_width = self.view.width
        plot_height = self.view.height

        axis_label_width = 80
        row_dend_width = 280
        col_dend_height = 180
        label_margin_left = 280
        label_margin_bottom = 300
        label_margin_top = 80
        colorbar_width = 180

        heatmap_x = axis_label_width + row_dend_width + label_margin_left
        heatmap_width = plot_width - heatmap_x - colorbar_width - 20
        heatmap_height = plot_height - col_dend_height - label_margin_bottom - label_margin_top

        cell_width = heatmap_width / n_cols
        cell_height = heatmap_height / n_rows

        plot_node = self.nodes["plot"]
        heatmap_group = self.svg.node(plot_node, class_="clustered-heatmap")

        self._draw_dendrogram(
            heatmap_group,
            self.row_linkage,
            self.view.x(0) + axis_label_width + 40,
            self.view.y(n_rows) + label_margin_top,
            row_dend_width - 40,
            heatmap_height,
            orientation="left",
        )

        self._draw_dendrogram(
            heatmap_group,
            self.col_linkage,
            self.view.x(0) + heatmap_x,
            self.view.y(n_rows) + heatmap_height + label_margin_top + 10,
            heatmap_width,
            col_dend_height,
            orientation="bottom",
        )

        row_font_size = min(38, int(cell_height * 0.7))
        for i, label in enumerate(reordered_row_labels):
            x = self.view.x(0) + heatmap_x - 15
            y = self.view.y(n_rows) + label_margin_top + i * cell_height + cell_height / 2
            text_node = self.svg.node(heatmap_group, "text", x=x, y=y + row_font_size * 0.35)
            text_node.set("text-anchor", "end")
            text_node.set("fill", INK)
            text_node.set("style", f"font-size:{row_font_size}px;font-weight:600;font-family:sans-serif")
            text_node.text = label

        col_font_size = min(30, int(cell_width * 0.5))
        for j, label in enumerate(reordered_col_labels):
            x = self.view.x(0) + heatmap_x + j * cell_width + cell_width / 2
            y = self.view.y(n_rows) + label_margin_top + heatmap_height + col_dend_height + 25
            text_node = self.svg.node(heatmap_group, "text", x=x, y=y)
            text_node.set("text-anchor", "start")
            text_node.set("fill", INK)
            text_node.set("style", f"font-size:{col_font_size}px;font-weight:600;font-family:sans-serif")
            text_node.set("transform", f"rotate(45, {x}, {y})")
            text_node.text = label

        value_font_size = min(28, int(min(cell_width, cell_height) * 0.35))
        for i in range(n_rows):
            for j in range(n_cols):
                value = matrix[i, j]
                color = self._interpolate_color(value, min_val, max_val)

                x = self.view.x(0) + heatmap_x + j * cell_width
                y = self.view.y(n_rows) + label_margin_top + i * cell_height

                rect = self.svg.node(
                    heatmap_group, "rect", x=x, y=y, width=cell_width - 1, height=cell_height - 1, rx=2, ry=2
                )
                rect.set("fill", color)
                rect.set("stroke", PAGE_BG)
                rect.set("stroke-width", "1")

                if self.show_values:
                    text_color = self._get_text_color(color)
                    text_x = x + cell_width / 2
                    text_y = y + cell_height / 2 + value_font_size * 0.35

                    text_node = self.svg.node(heatmap_group, "text", x=text_x, y=text_y)
                    text_node.set("text-anchor", "middle")
                    text_node.set("fill", text_color)
                    text_node.set("style", f"font-size:{value_font_size}px;font-weight:bold;font-family:sans-serif")
                    text_node.text = f"{value:.1f}"

        colorbar_bar_width = 45
        colorbar_height = heatmap_height * 0.75
        colorbar_x = self.view.x(0) + heatmap_x + heatmap_width + 40
        colorbar_y = self.view.y(n_rows) + label_margin_top + (heatmap_height - colorbar_height) / 2

        n_segments = 60
        segment_height = colorbar_height / n_segments
        for seg_i in range(n_segments):
            seg_value = max_val - (max_val - min_val) * seg_i / (n_segments - 1)
            seg_color = self._interpolate_color(seg_value, min_val, max_val)
            seg_y = colorbar_y + seg_i * segment_height

            self.svg.node(
                heatmap_group,
                "rect",
                x=colorbar_x,
                y=seg_y,
                width=colorbar_bar_width,
                height=segment_height + 1,
                fill=seg_color,
            )

        self.svg.node(
            heatmap_group,
            "rect",
            x=colorbar_x,
            y=colorbar_y,
            width=colorbar_bar_width,
            height=colorbar_height,
            fill="none",
            stroke=INK_SOFT,
            stroke_width="2",
        )

        cb_label_size = 32
        for val, y_pos in [
            (max_val, colorbar_y),
            (0, colorbar_y + colorbar_height / 2),
            (min_val, colorbar_y + colorbar_height),
        ]:
            text_node = self.svg.node(
                heatmap_group, "text", x=colorbar_x + colorbar_bar_width + 12, y=y_pos + cb_label_size * 0.35
            )
            text_node.set("fill", INK)
            text_node.set("style", f"font-size:{cb_label_size}px;font-family:sans-serif")
            text_node.text = f"{val:+.1f}"

        cb_title_size = 36
        cb_title_x = colorbar_x + colorbar_bar_width / 2
        cb_title_y = colorbar_y - 25
        text_node = self.svg.node(heatmap_group, "text", x=cb_title_x, y=cb_title_y)
        text_node.set("text-anchor", "middle")
        text_node.set("fill", INK)
        text_node.set("style", f"font-size:{cb_title_size}px;font-weight:bold;font-family:sans-serif")
        text_node.text = self.colorbar_label

        axis_label_size = 48
        genes_label_x = self.view.x(0) + 50
        genes_label_y = self.view.y(n_rows) + label_margin_top + heatmap_height / 2
        genes_text = self.svg.node(heatmap_group, "text", x=genes_label_x, y=genes_label_y)
        genes_text.set("text-anchor", "middle")
        genes_text.set("fill", INK)
        genes_text.set("style", f"font-size:{axis_label_size}px;font-weight:bold;font-family:sans-serif")
        genes_text.set("transform", f"rotate(-90, {genes_label_x}, {genes_label_y})")
        genes_text.text = "Drugs"

        samples_label_x = self.view.x(0) + heatmap_x + heatmap_width / 2
        samples_label_y = (
            self.view.y(n_rows) + label_margin_top + heatmap_height + col_dend_height + label_margin_bottom - 40
        )
        samples_text = self.svg.node(heatmap_group, "text", x=samples_label_x, y=samples_label_y)
        samples_text.set("text-anchor", "middle")
        samples_text.set("fill", INK)
        samples_text.set("style", f"font-size:{axis_label_size}px;font-weight:bold;font-family:sans-serif")
        samples_text.text = "Cell Lines"

    def _compute(self):
        """Compute the box for rendering."""
        n_rows = len(self.matrix_data) if self.matrix_data else 1
        n_cols = len(self.matrix_data[0]) if self.matrix_data and len(self.matrix_data) > 0 else 1
        self._box.xmin = 0
        self._box.xmax = n_cols
        self._box.ymin = 0
        self._box.ymax = n_rows


# Data: Cell-line drug sensitivity (IC50 values) - different domain from tumor/normal gene expression
np.random.seed(42)

drugs = [
    "Paclitaxel",
    "Doxorubicin",
    "Cisplatin",
    "Gemcitabine",
    "5-Fluorouracil",
    "Irinotecan",
    "Bortezomib",
    "Sorafenib",
    "Sunitinib",
    "Erlotinib",
    "Gefitinib",
    "Lapatinib",
]

cell_lines = ["A549", "HCT116", "HT29", "MCF7", "MDA231", "OVCAR3", "SKOV3", "SW480", "U87", "KHOS"]

n_drugs = len(drugs)
n_lines = len(cell_lines)

sensitivity_data = np.zeros((n_drugs, n_lines))

# Chemotherapy drugs (Paclitaxel, Doxorubicin, Cisplatin, Gemcitabine, 5-FU, Irinotecan)
# Higher sensitivity (lower IC50) in epithelial-origin lung/colon lines
chemo_drugs = [0, 1, 2, 3, 4, 5]
epithelial_lines = [0, 1, 2, 7]
mesenchymal_lines = [3, 4]

for i in chemo_drugs:
    for j in epithelial_lines:
        sensitivity_data[i, j] = np.random.randn() * 0.6 - 1.2  # High sensitivity
    for j in mesenchymal_lines:
        sensitivity_data[i, j] = np.random.randn() * 0.6 + 0.9  # Low sensitivity
    for j in [5, 6, 8, 9]:
        sensitivity_data[i, j] = np.random.randn() * 0.7  # Moderate

# Targeted drugs (Bortezomib, Sorafenib, Sunitinib, Erlotinib, Gefitinib, Lapatinib)
targeted_drugs = [6, 7, 8, 9, 10, 11]
for i in targeted_drugs:
    for j in [8, 9]:
        sensitivity_data[i, j] = np.random.randn() * 0.5 - 1.3  # EGFR-mutant lines
    for j in [0, 1, 2, 3]:
        sensitivity_data[i, j] = np.random.randn() * 0.5 + 0.5  # Lower sensitivity
    for j in [4, 5, 6, 7]:
        sensitivity_data[i, j] = np.random.randn() * 0.6  # Variable

row_linkage = linkage(pdist(sensitivity_data), method="ward")
col_linkage = linkage(pdist(sensitivity_data.T), method="ward")

row_dend = dendrogram(row_linkage, no_plot=True)
col_dend = dendrogram(col_linkage, no_plot=True)
row_order = row_dend["leaves"]
col_order = col_dend["leaves"]

matrix_data = sensitivity_data.tolist()

# Diverging colormap: blue (low sensitivity/high IC50) -> white (neutral) -> red (high sensitivity/low IC50)
diverging_colormap = [
    "#0d47a1",
    "#1565c0",
    "#1e88e5",
    "#42a5f5",
    "#90caf9",
    "#e3f2fd",
    "#ffebee",
    "#ffcdd2",
    "#ef9a9a",
    "#e53935",
    "#c62828",
]

custom_style = Style(
    background=PAGE_BG,
    plot_background=PAGE_BG,
    foreground=INK,
    foreground_strong=INK,
    foreground_subtle=INK_SOFT,
    colors=("#009E73",),
    title_font_size=28,
    label_font_size=18,
    major_label_font_size=16,
    legend_font_size=16,
    value_font_size=14,
    stroke_width=3,
)

chart = ClusteredHeatmap(
    width=4800,
    height=2700,
    style=custom_style,
    title="heatmap-clustered · pygal · anyplot.ai",
    matrix_data=matrix_data,
    row_labels=drugs,
    col_labels=cell_lines,
    colormap=diverging_colormap,
    colorbar_label="Sensitivity (log IC50)",
    row_linkage=row_linkage,
    col_linkage=col_linkage,
    row_order=row_order,
    col_order=col_order,
    show_values=False,
    show_legend=False,
    margin=100,
    margin_top=180,
    margin_bottom=80,
    margin_left=60,
    show_x_labels=False,
    show_y_labels=False,
)

chart.add("", [0])

chart.render_to_png(f"plot-{THEME}.png")

chart_svg = chart.render(is_unicode=True)
if isinstance(chart_svg, bytes):
    chart_svg = chart_svg.decode("utf-8")

with open(f"plot-{THEME}.html", "w", encoding="utf-8") as f:
    f.write(
        f"""<!DOCTYPE html>
<html>
<head>
    <meta charset="utf-8">
    <title>heatmap-clustered - pygal</title>
    <style>
        body {{ margin: 0; display: flex; justify-content: center; align-items: center; min-height: 100vh; background: {PAGE_BG}; }}
        .chart {{ max-width: 100%; height: auto; }}
    </style>
</head>
<body>
    <figure class="chart">
        {chart_svg}
    </figure>
</body>
</html>
"""
    )
Runnable source as JSON, for any HTTP client: https://api.anyplot.ai/specs/heatmap-clustered/pygal/code. Any spec id and library id listed in llms-full.txt fit the same URL shape; every URL below is complete and callable.
{
  "spec_id": "heatmap-clustered",
  "language": "python",
  "library": "pygal",
  "page": "https://anyplot.ai/heatmap-clustered/python/pygal",
  "hub": "https://anyplot.ai/heatmap-clustered",
  "code_json": "https://api.anyplot.ai/specs/heatmap-clustered/pygal/code",
  "spec_json": "https://api.anyplot.ai/specs/heatmap-clustered",
  "render_light_png": "https://storage.googleapis.com/anyplot-images/plots/heatmap-clustered/python/pygal/plot-light.png",
  "render_dark_png": "https://storage.googleapis.com/anyplot-images/plots/heatmap-clustered/python/pygal/plot-dark.png",
  "interactive_light_html": "https://storage.googleapis.com/anyplot-images/plots/heatmap-clustered/python/pygal/plot-light.html",
  "interactive_dark_html": "https://storage.googleapis.com/anyplot-images/plots/heatmap-clustered/python/pygal/plot-dark.html",
  "quality_score": 92.0,
  "license": "MIT",
  "guide": "https://anyplot.ai/llms.txt"
}
Part of Clustered Heatmap on anyplot.ai.