The same plot in 14 other libraries — JavaScript: Chart.js, D3.js, Highcharts, MUI X Charts; Python: Altair, Bokeh, lets-plot, Matplotlib, Plotly, plotnine, Pygal, Seaborn; R: ggplot2; Julia: Makie.jl. Compare all 15 side by side: Clustered Heatmap in Python, R, Julia and JavaScript.
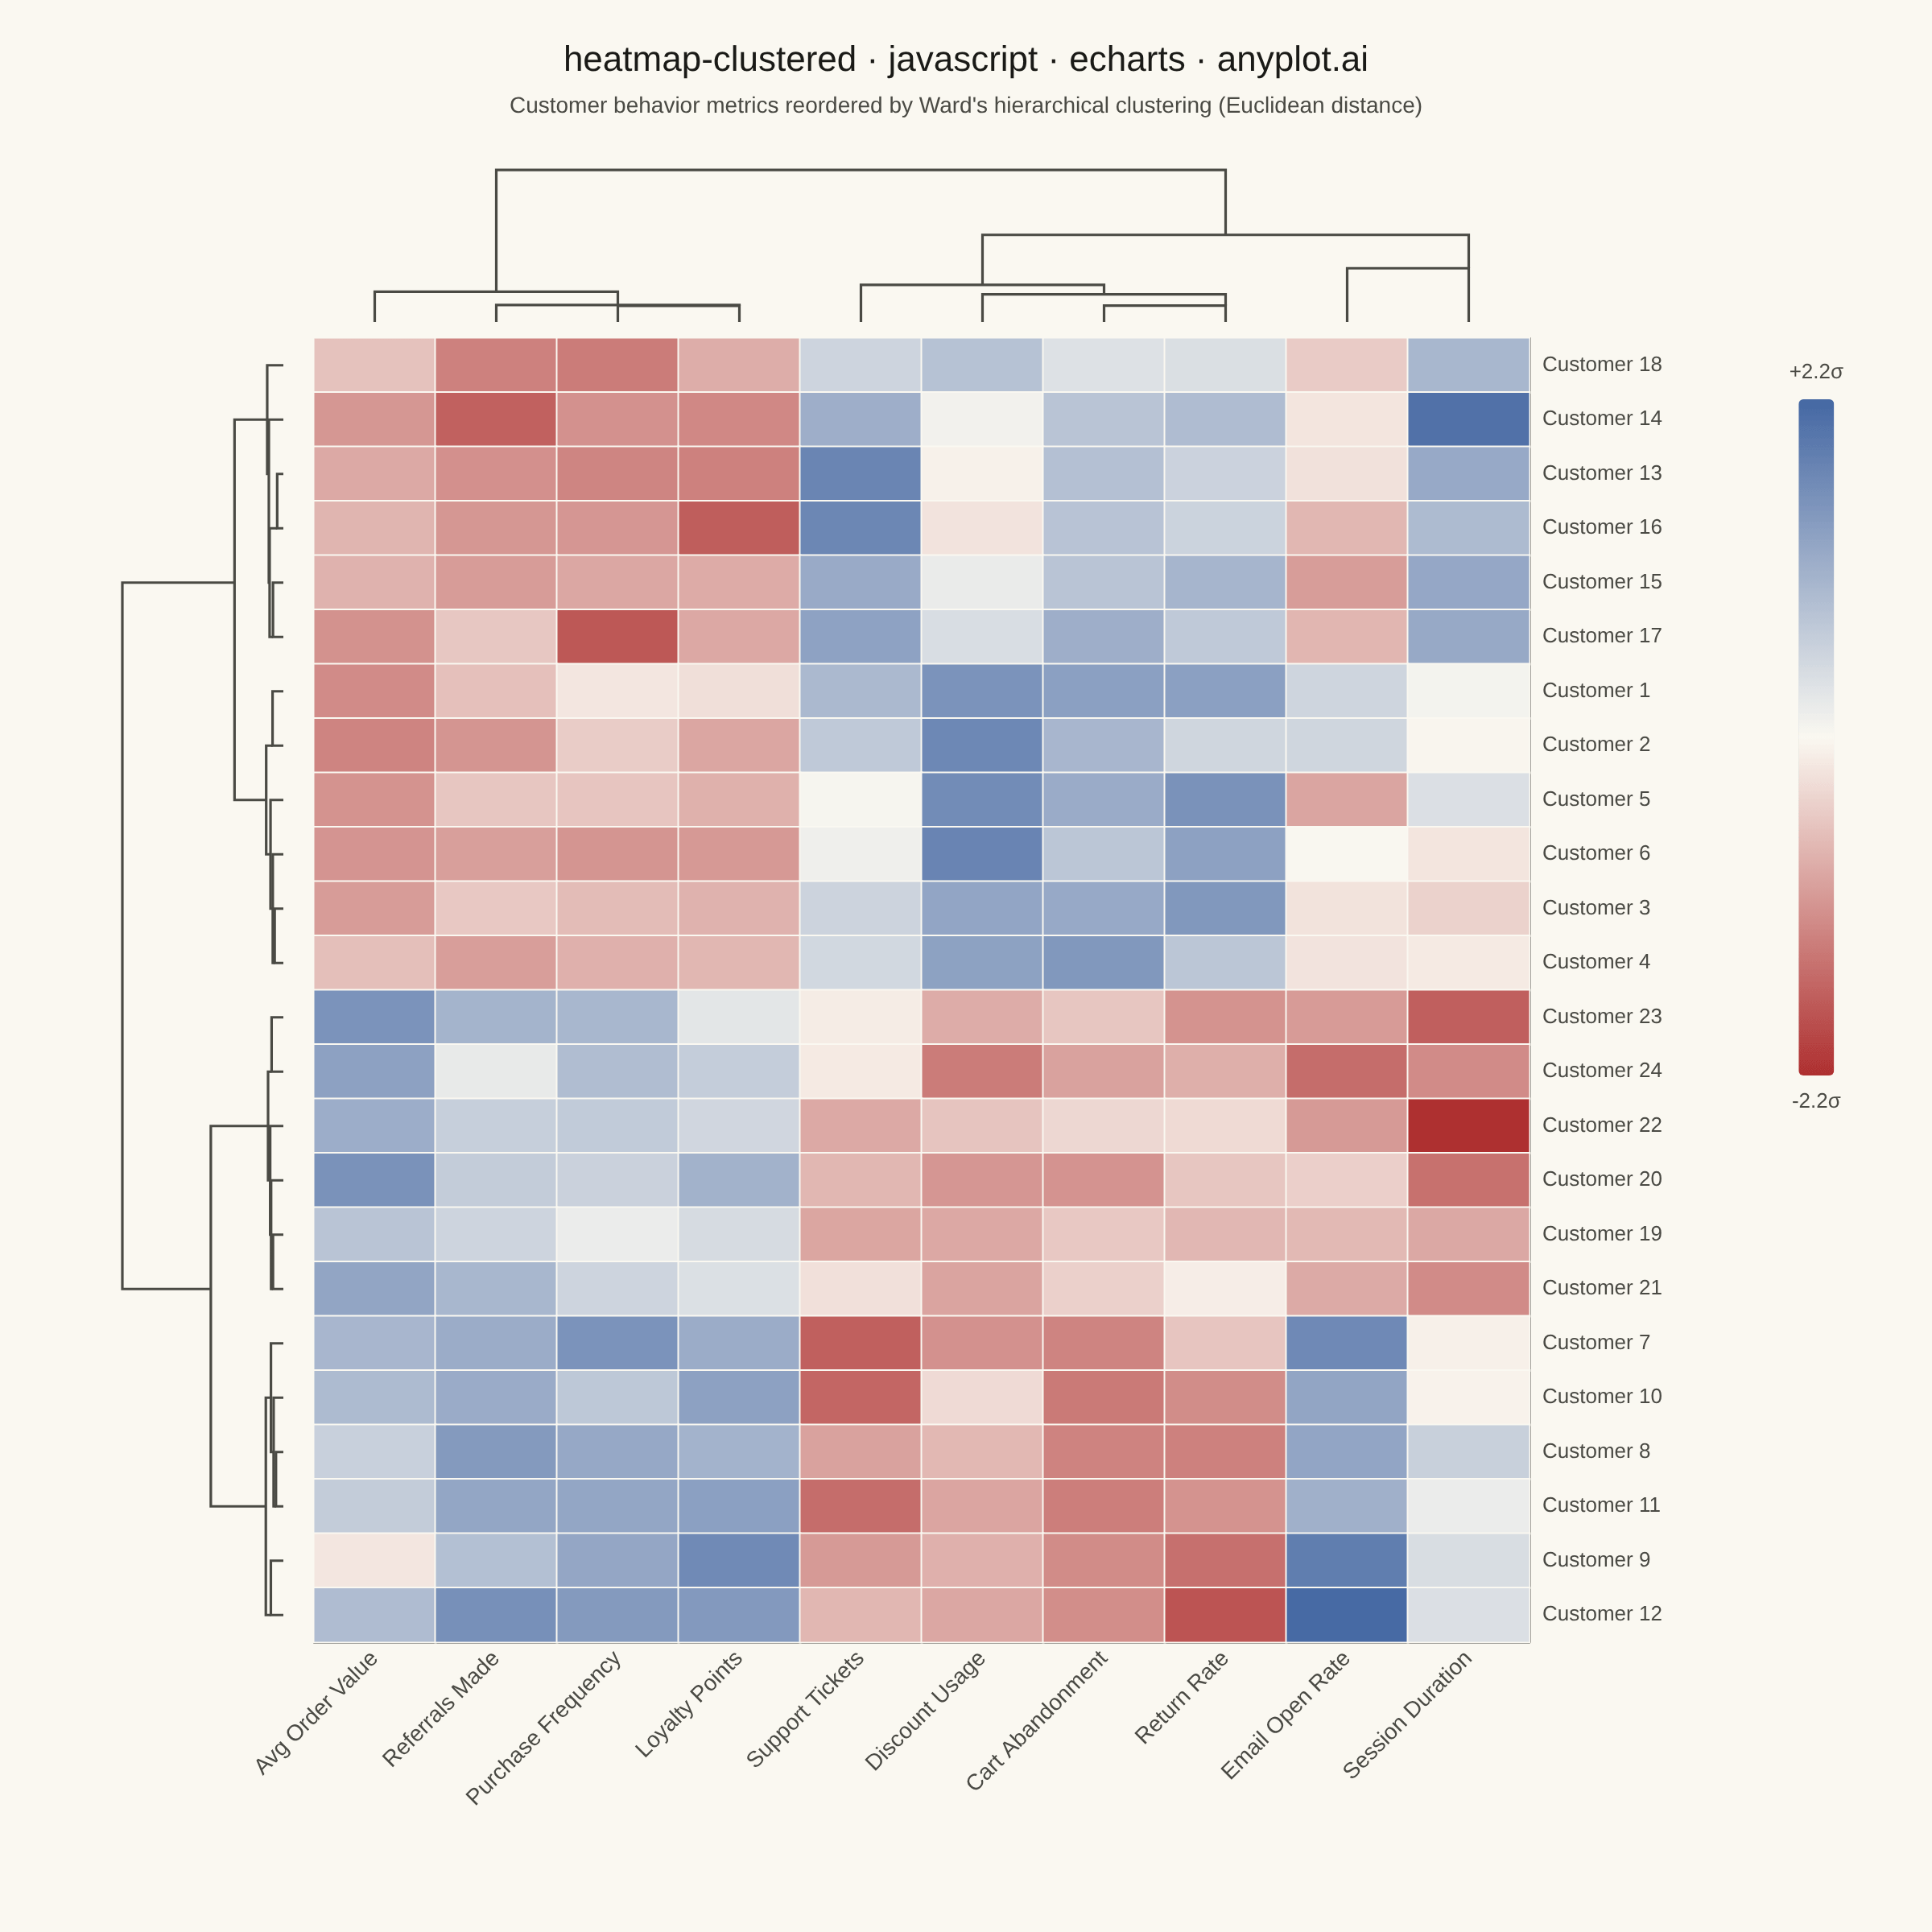
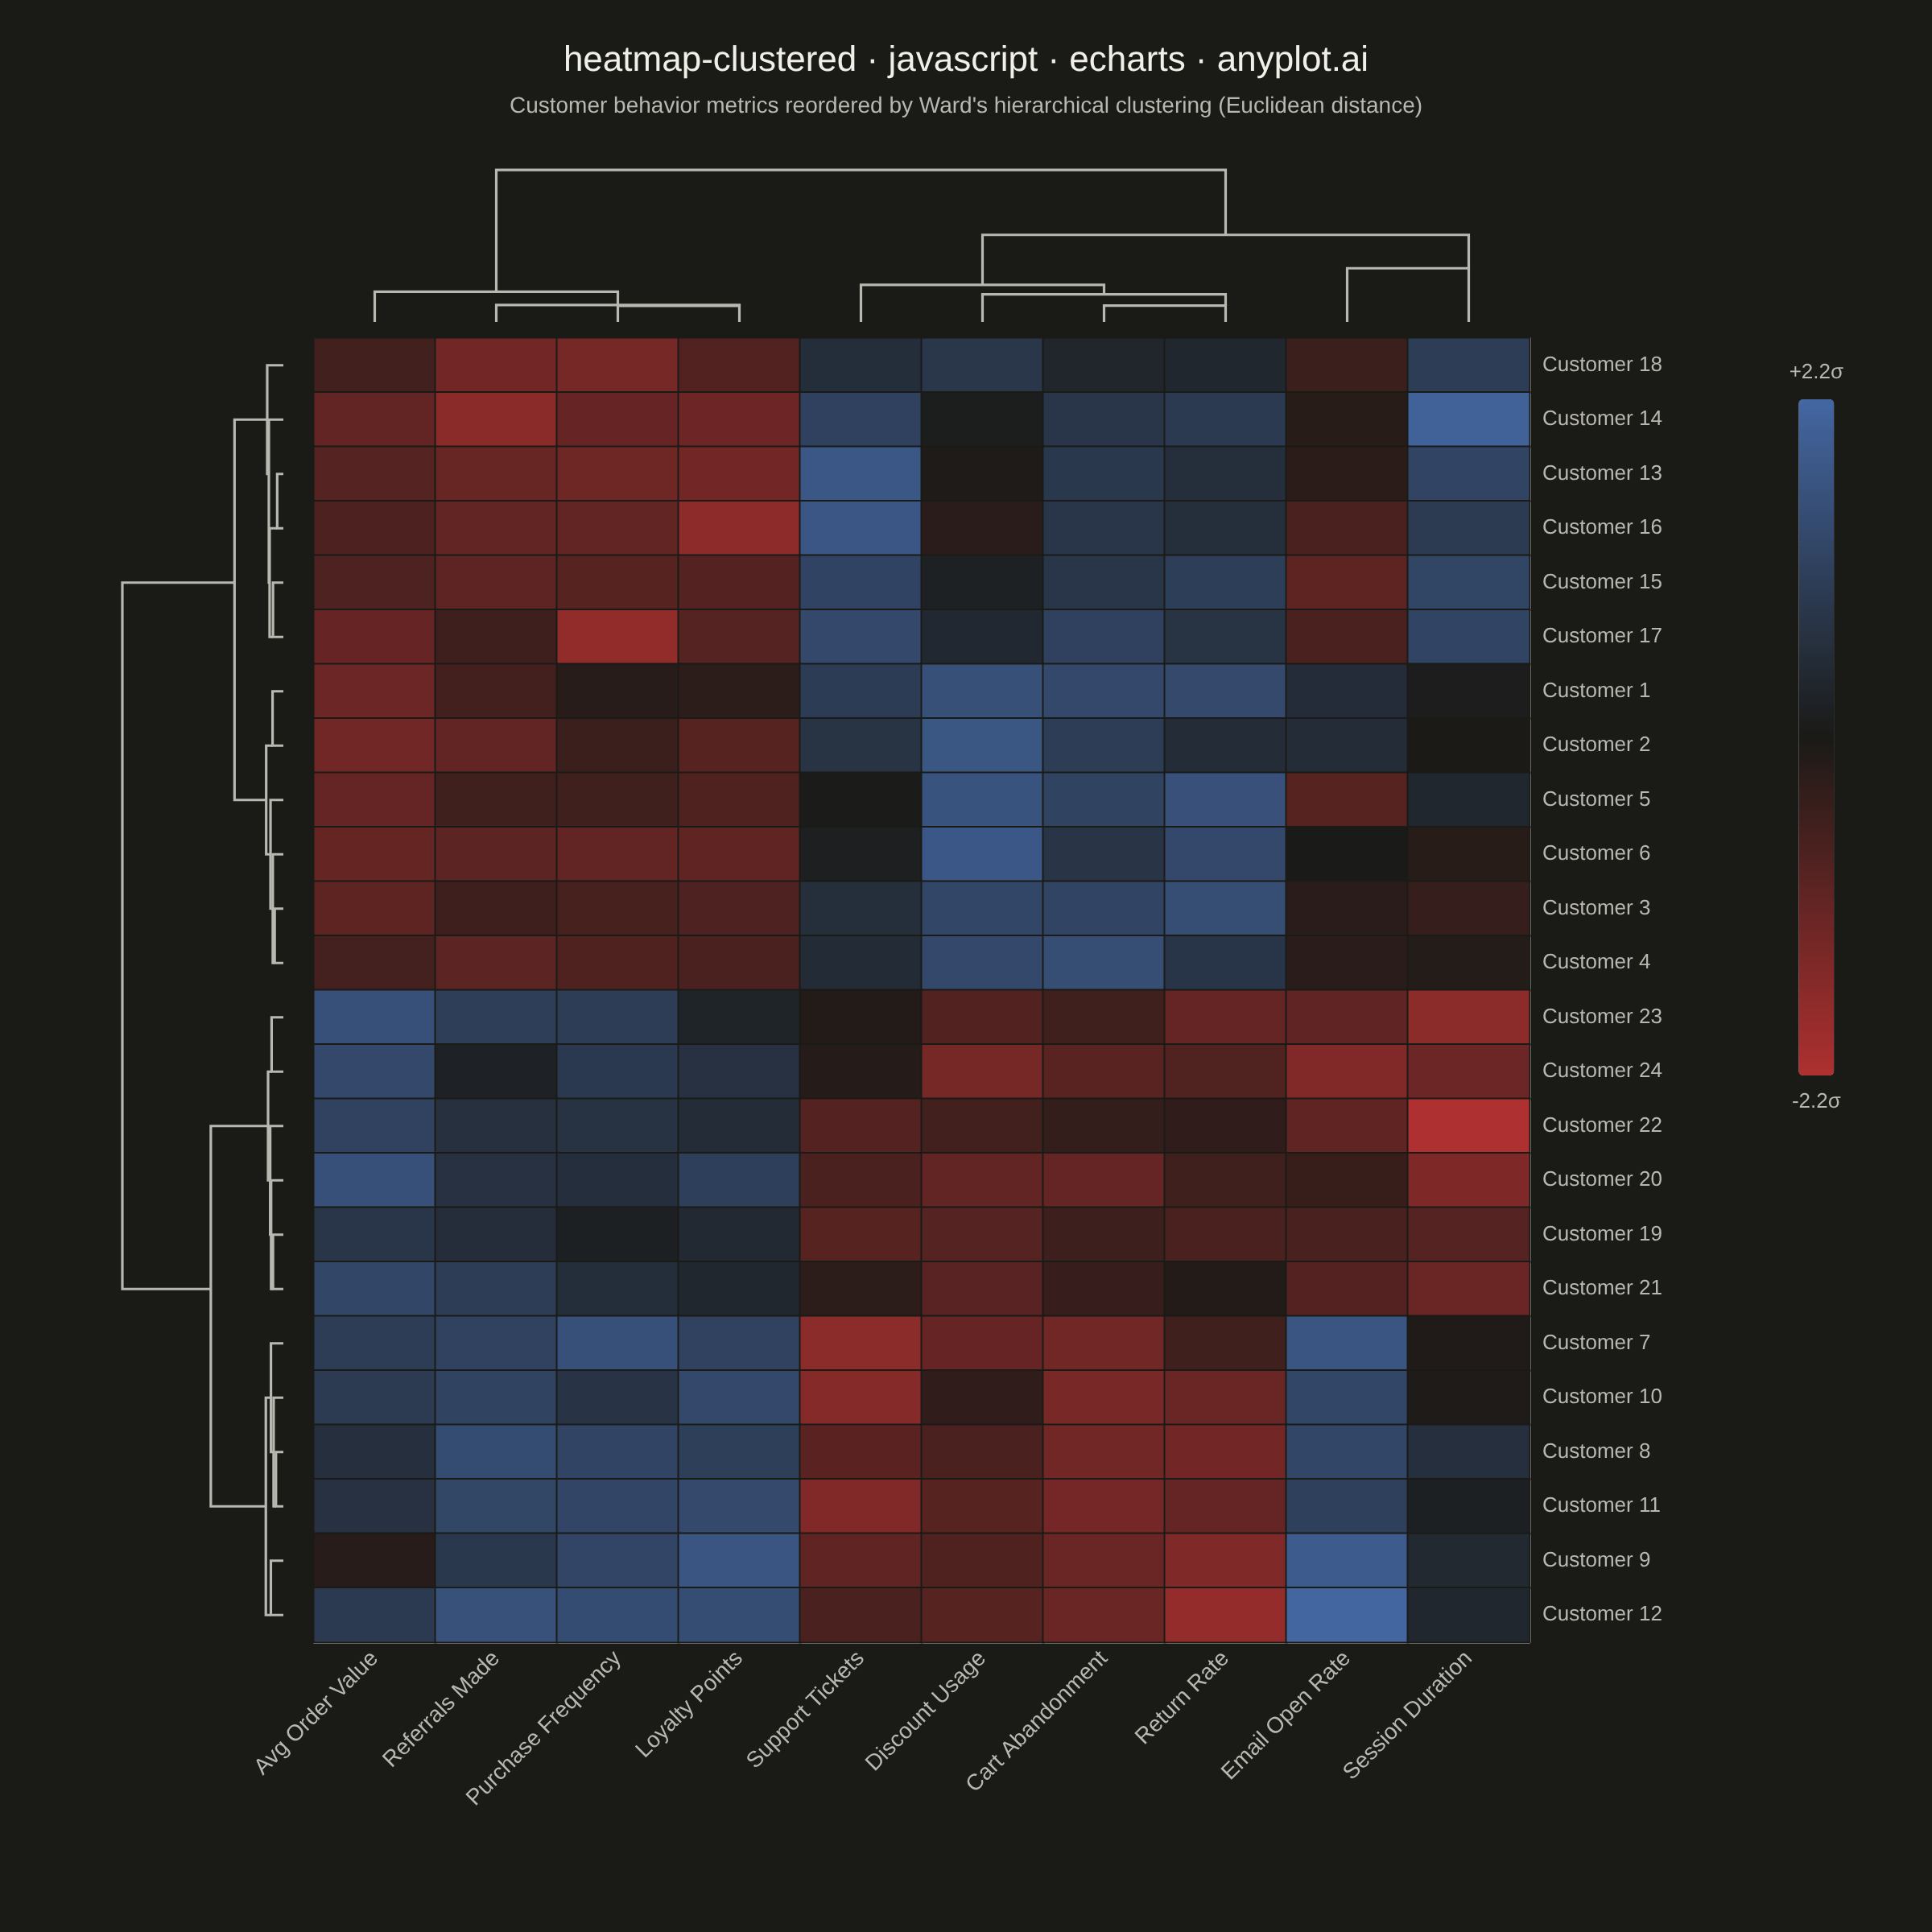
A heatmap with hierarchical clustering dendrograms on both rows and columns, showing both data values and their hierarchical relationships. Rows and columns are automatically reordered based on clustering results to reveal natural groupings in the data. Essential for discovering patterns in high-dimensional data where similar observations or variables should be visually grouped together.
// anyplot.ai
// heatmap-clustered: Clustered Heatmap
// Library: echarts 6.1.0 | JavaScript 22.23.2
// Quality: 91/100 | Created: 2026-09-05

//# anyplot-orientation: square
const t = window.ANYPLOT_TOKENS;

// --- Data (in-memory, deterministic) ----------------------------------------
// 24 customers profiled on 10 behavioral metrics, drawn from 4 latent
// segments so the clustering has real structure to recover. A small
// fixed-seed LCG + Box-Muller stands in for a seeded RNG (the browser has
// none).
let lcgState = 42;
const lcgUniform = () => {
  lcgState = (lcgState * 1664525 + 1013904223) % 4294967296;
  return lcgState / 4294967296;
};
const lcgGaussian = () => {
  const u1 = Math.max(lcgUniform(), 1e-9);
  const u2 = lcgUniform();
  return Math.sqrt(-2 * Math.log(u1)) * Math.cos(2 * Math.PI * u2);
};

const metrics = [
  "Purchase Frequency",
  "Avg Order Value",
  "Cart Abandonment",
  "Email Open Rate",
  "Discount Usage",
  "Return Rate",
  "Session Duration",
  "Referrals Made",
  "Loyalty Points",
  "Support Tickets",
];

const segments = [
  { name: "Bargain Hunters", profile: [-0.5, -1.2, 1.5, 0.2, 1.8, 1.3, 0.3, -0.8, -0.9, 0.6] },
  { name: "Loyal Regulars", profile: [1.6, 0.8, -1.3, 1.2, -0.9, -1.0, 0.4, 1.5, 1.7, -0.6] },
  { name: "Window Shoppers", profile: [-1.4, -0.9, 1.2, -0.3, 0.2, 0.4, 1.6, -1.1, -1.2, 0.9] },
  { name: "Big Spenders", profile: [1.1, 1.7, -1.0, -0.4, -1.1, -0.7, -0.6, 0.7, 0.8, -0.5] },
];

const customers = [];
const rawMatrix = [];
segments.forEach((segment, s) => {
  for (let k = 0; k < 6; k++) {
    customers.push(`Customer ${s * 6 + k + 1}`);
    rawMatrix.push(segment.profile.map((mean) => mean + lcgGaussian() * 0.35));
  }
});

// Z-score each metric column across all customers so the matrix is centered
// on zero — required for the diverging colormap to read correctly.
const nRows = rawMatrix.length;
const matrix = rawMatrix.map((row) => row.slice());
for (let col = 0; col < metrics.length; col++) {
  const column = matrix.map((row) => row[col]);
  const mean = column.reduce((a, b) => a + b, 0) / nRows;
  const variance = column.reduce((a, v) => a + (v - mean) ** 2, 0) / nRows;
  const std = Math.sqrt(variance) || 1;
  for (let row = 0; row < nRows; row++) matrix[row][col] = (matrix[row][col] - mean) / std;
}

// --- Hierarchical clustering (Ward's method, Euclidean distance) ------------
// Agglomerative clustering over arbitrary vectors. Ward's linkage distance
// between two clusters is computed directly from their centroids and sizes —
// mathematically equivalent to the Lance-Williams recursion — so heights are
// non-decreasing and comparable across the whole tree.
const wardCluster = (vectors) => {
  const n = vectors.length;
  const euclidean = (a, b) => Math.sqrt(a.reduce((s, v, i) => s + (v - b[i]) ** 2, 0));

  const centroid = new Map();
  const size = new Map();
  const height = new Map();
  const left = new Map();
  const right = new Map();
  const active = new Set();
  for (let i = 0; i < n; i++) {
    centroid.set(i, vectors[i]);
    size.set(i, 1);
    height.set(i, 0);
    active.add(i);
  }

  const wardDistance = (i, j) => {
    const ni = size.get(i);
    const nj = size.get(j);
    const factor = Math.sqrt((2 * ni * nj) / (ni + nj));
    return factor * euclidean(centroid.get(i), centroid.get(j));
  };

  let nextId = n;
  for (let step = 0; step < n - 1; step++) {
    const activeList = [...active];
    let bestI = -1;
    let bestJ = -1;
    let bestDist = Infinity;
    for (let a = 0; a < activeList.length; a++) {
      for (let b = a + 1; b < activeList.length; b++) {
        const d = wardDistance(activeList[a], activeList[b]);
        if (d < bestDist) {
          bestDist = d;
          bestI = activeList[a];
          bestJ = activeList[b];
        }
      }
    }
    const ni = size.get(bestI);
    const nj = size.get(bestJ);
    const merged = centroid.get(bestI).map((v, k) => (v * ni + centroid.get(bestJ)[k] * nj) / (ni + nj));
    const id = nextId++;
    centroid.set(id, merged);
    size.set(id, ni + nj);
    height.set(id, bestDist);
    left.set(id, bestI);
    right.set(id, bestJ);
    active.delete(bestI);
    active.delete(bestJ);
    active.add(id);
  }

  const root = nextId - 1;
  const leafOrder = [];
  const collectLeaves = (id) => {
    if (id < n) {
      leafOrder.push(id);
      return;
    }
    collectLeaves(left.get(id));
    collectLeaves(right.get(id));
  };
  collectLeaves(root);

  const position = new Map();
  leafOrder.forEach((leafId, rank) => position.set(leafId, rank));
  const merges = [];
  for (let id = n; id < nextId; id++) {
    const l = left.get(id);
    const r = right.get(id);
    const parentPos = (position.get(l) + position.get(r)) / 2;
    position.set(id, parentPos);
    merges.push({
      posA: position.get(l),
      heightA: height.get(l),
      posB: position.get(r),
      heightB: height.get(r),
      heightP: height.get(id),
    });
  }

  return { leafOrder, merges, maxHeight: height.get(root) };
};

const rowClusters = wardCluster(matrix);
const colVectors = metrics.map((_, col) => matrix.map((row) => row[col]));
const colClusters = wardCluster(colVectors);

const orderedRows = rowClusters.leafOrder.map((i) => customers[i]);
const orderedCols = colClusters.leafOrder.map((j) => metrics[j]);
const orderedMatrix = rowClusters.leafOrder.map((i) => colClusters.leafOrder.map((j) => matrix[i][j]));

// --- Heatmap cells + colorbar range ------------------------------------------
const heatmapData = [];
let maxAbsValue = 0;
for (let r = 0; r < orderedRows.length; r++) {
  for (let c = 0; c < orderedCols.length; c++) {
    const value = orderedMatrix[r][c];
    heatmapData.push([c, r, value]);
    maxAbsValue = Math.max(maxAbsValue, Math.abs(value));
  }
}

// --- Dendrogram bracket data (one row per merge) -----------------------------
const colDendroData = colClusters.merges.map((m) => [m.posA, m.heightA, m.posB, m.heightB, m.heightP]);
const rowDendroData = rowClusters.merges.map((m) => [m.heightA, m.posA, m.heightB, m.posB, m.heightP]);

const colRenderItem = (params, api) => {
  const xA = api.value(0);
  const hA = api.value(1);
  const xB = api.value(2);
  const hB = api.value(3);
  const hP = api.value(4);
  return {
    type: "polyline",
    shape: { points: [api.coord([xA, hA]), api.coord([xA, hP]), api.coord([xB, hP]), api.coord([xB, hB])] },
    style: { stroke: t.inkSoft, lineWidth: 1.6, fill: "none" },
  };
};

const rowRenderItem = (params, api) => {
  const hA = api.value(0);
  const yA = api.value(1);
  const hB = api.value(2);
  const yB = api.value(3);
  const hP = api.value(4);
  return {
    type: "polyline",
    shape: { points: [api.coord([hA, yA]), api.coord([hP, yA]), api.coord([hP, yB]), api.coord([hB, yB])] },
    style: { stroke: t.inkSoft, lineWidth: 1.6, fill: "none" },
  };
};

// --- Init ---------------------------------------------------------------------
const chart = echarts.init(document.getElementById("container"));

// --- Title (scaled to length per anyplot title-fontsize rule) ---------------
const title = "heatmap-clustered · javascript · echarts · anyplot.ai";
const titleFontSize = Math.round(22 * Math.min(1, 67 / title.length));

// --- Layout: heatmap grid + a dendrogram grid on each of its two edges ------
const GRID_LEFT = 195;
const GRID_RIGHT = 250;
const GRID_TOP = 210;
const GRID_BOTTOM = 180;
const ROW_DENDRO_LEFT = 68;
const ROW_DENDRO_WIDTH = 108;
const COL_DENDRO_TOP = 98;
const COL_DENDRO_HEIGHT = 102;

// --- Option -------------------------------------------------------------------
chart.setOption({
  animation: false,
  backgroundColor: "transparent",
  title: {
    text: title,
    subtext: "Customer behavior metrics reordered by Ward's hierarchical clustering (Euclidean distance)",
    left: "center",
    top: 22,
    textStyle: { color: t.ink, fontSize: titleFontSize, fontWeight: 500 },
    subtextStyle: { color: t.inkSoft, fontSize: 14 },
  },
  grid: [
    { left: GRID_LEFT, right: GRID_RIGHT, top: GRID_TOP, bottom: GRID_BOTTOM },
    { left: GRID_LEFT, right: GRID_RIGHT, top: COL_DENDRO_TOP, height: COL_DENDRO_HEIGHT },
    { left: ROW_DENDRO_LEFT, width: ROW_DENDRO_WIDTH, top: GRID_TOP, bottom: GRID_BOTTOM },
  ],
  xAxis: [
    {
      type: "category",
      gridIndex: 0,
      data: orderedCols,
      axisLine: { lineStyle: { color: t.inkSoft } },
      axisTick: { show: false },
      axisLabel: { color: t.inkSoft, fontSize: 14, rotate: 45 },
    },
    {
      type: "category",
      gridIndex: 1,
      data: orderedCols,
      show: false,
    },
    {
      type: "value",
      gridIndex: 2,
      min: 0,
      max: rowClusters.maxHeight * 1.08,
      inverse: true,
      show: false,
    },
  ],
  yAxis: [
    {
      type: "category",
      gridIndex: 0,
      data: orderedRows,
      inverse: true,
      position: "right",
      axisLine: { lineStyle: { color: t.inkSoft } },
      axisTick: { show: false },
      axisLabel: { color: t.inkSoft, fontSize: 13 },
    },
    {
      type: "value",
      gridIndex: 1,
      min: 0,
      max: colClusters.maxHeight * 1.08,
      show: false,
    },
    {
      type: "category",
      gridIndex: 2,
      data: orderedRows,
      inverse: true,
      show: false,
    },
  ],
  visualMap: {
    type: "continuous",
    min: -maxAbsValue,
    max: maxAbsValue,
    calculable: false,
    orient: "vertical",
    right: 40,
    top: GRID_TOP,
    itemHeight: 420,
    itemWidth: 22,
    inRange: { color: t.div },
    text: [`+${maxAbsValue.toFixed(1)}σ`, `-${maxAbsValue.toFixed(1)}σ`],
    textStyle: { color: t.inkSoft, fontSize: 13 },
  },
  series: [
    {
      type: "heatmap",
      xAxisIndex: 0,
      yAxisIndex: 0,
      data: heatmapData,
      itemStyle: { borderColor: t.pageBg, borderWidth: 1 },
    },
    {
      type: "custom",
      coordinateSystem: "cartesian2d",
      xAxisIndex: 1,
      yAxisIndex: 1,
      data: colDendroData,
      renderItem: colRenderItem,
      clip: false,
      silent: true,
    },
    {
      type: "custom",
      coordinateSystem: "cartesian2d",
      xAxisIndex: 2,
      yAxisIndex: 2,
      data: rowDendroData,
      renderItem: rowRenderItem,
      clip: false,
      silent: true,
    },
  ],
});
Runnable source as JSON, for any HTTP client: https://api.anyplot.ai/specs/heatmap-clustered/echarts/code. Any spec id and library id listed in llms-full.txt fit the same URL shape; every URL below is complete and callable.
{
  "spec_id": "heatmap-clustered",
  "language": "javascript",
  "library": "echarts",
  "page": "https://anyplot.ai/heatmap-clustered/javascript/echarts",
  "hub": "https://anyplot.ai/heatmap-clustered",
  "code_json": "https://api.anyplot.ai/specs/heatmap-clustered/echarts/code",
  "spec_json": "https://api.anyplot.ai/specs/heatmap-clustered",
  "render_light_png": "https://storage.googleapis.com/anyplot-images/plots/heatmap-clustered/javascript/echarts/plot-light.png",
  "render_dark_png": "https://storage.googleapis.com/anyplot-images/plots/heatmap-clustered/javascript/echarts/plot-dark.png",
  "interactive_light_html": "https://storage.googleapis.com/anyplot-images/plots/heatmap-clustered/javascript/echarts/plot-light.html",
  "interactive_dark_html": "https://storage.googleapis.com/anyplot-images/plots/heatmap-clustered/javascript/echarts/plot-dark.html",
  "quality_score": 91.0,
  "license": "MIT",
  "guide": "https://anyplot.ai/llms.txt"
}
Part of Clustered Heatmap on anyplot.ai.