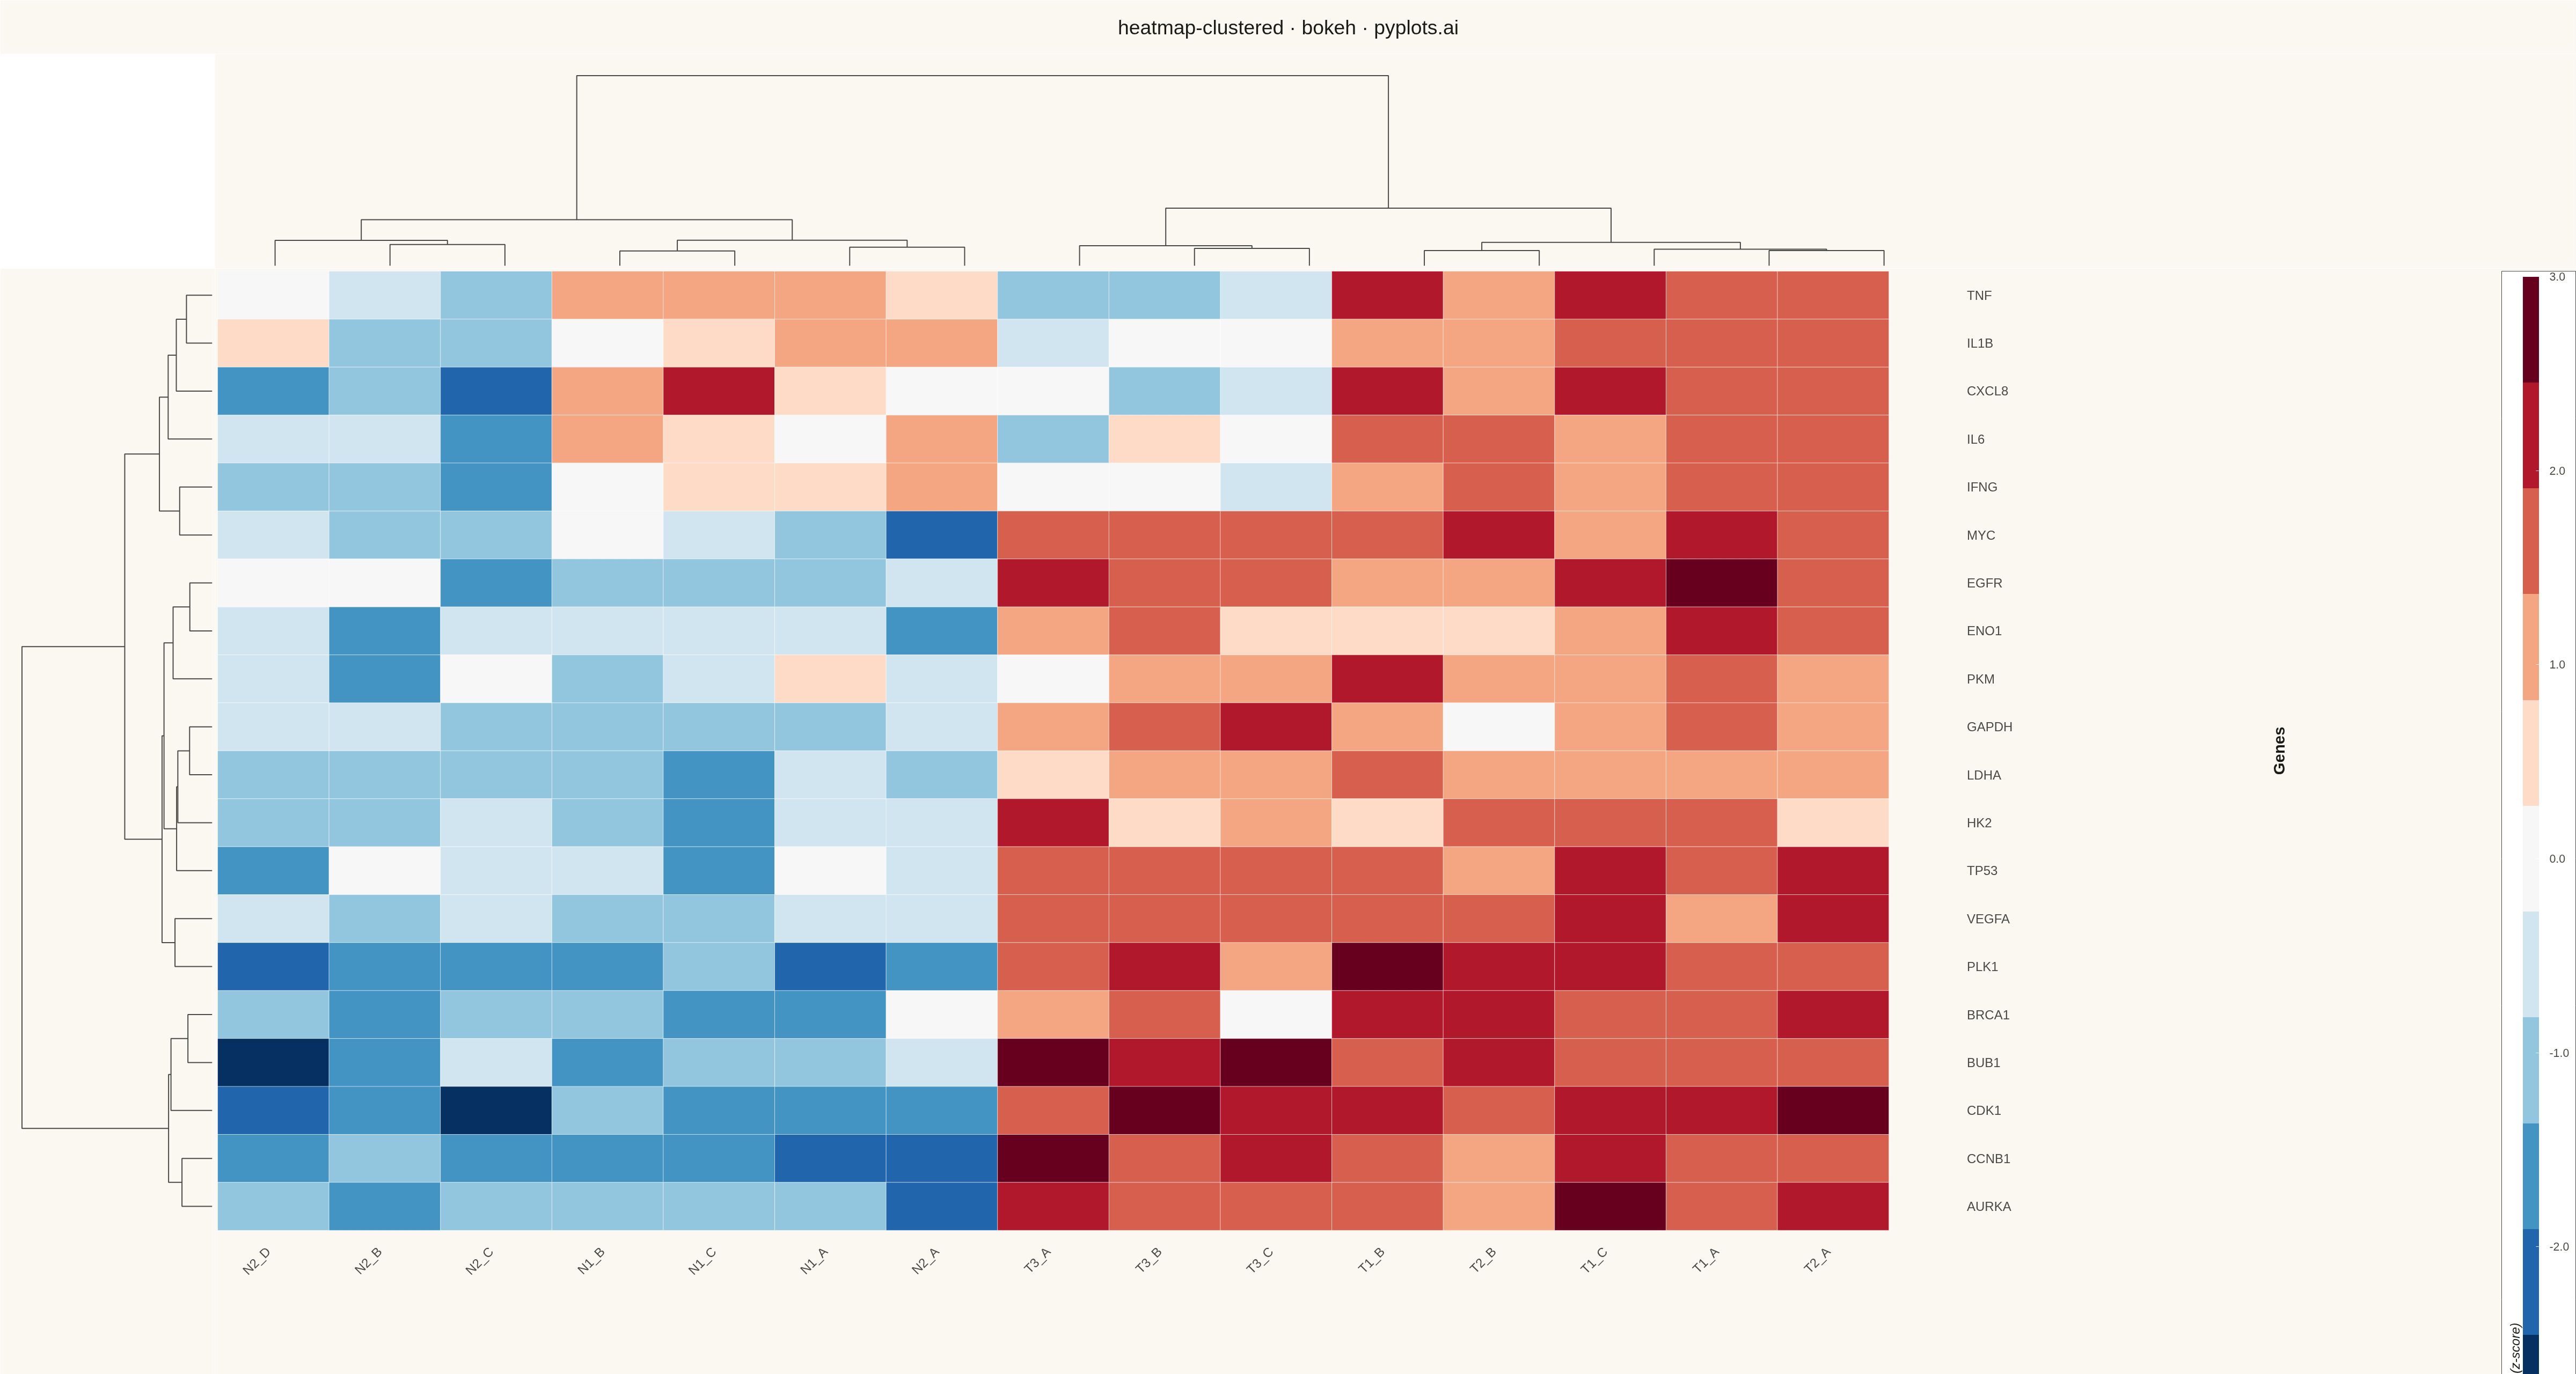
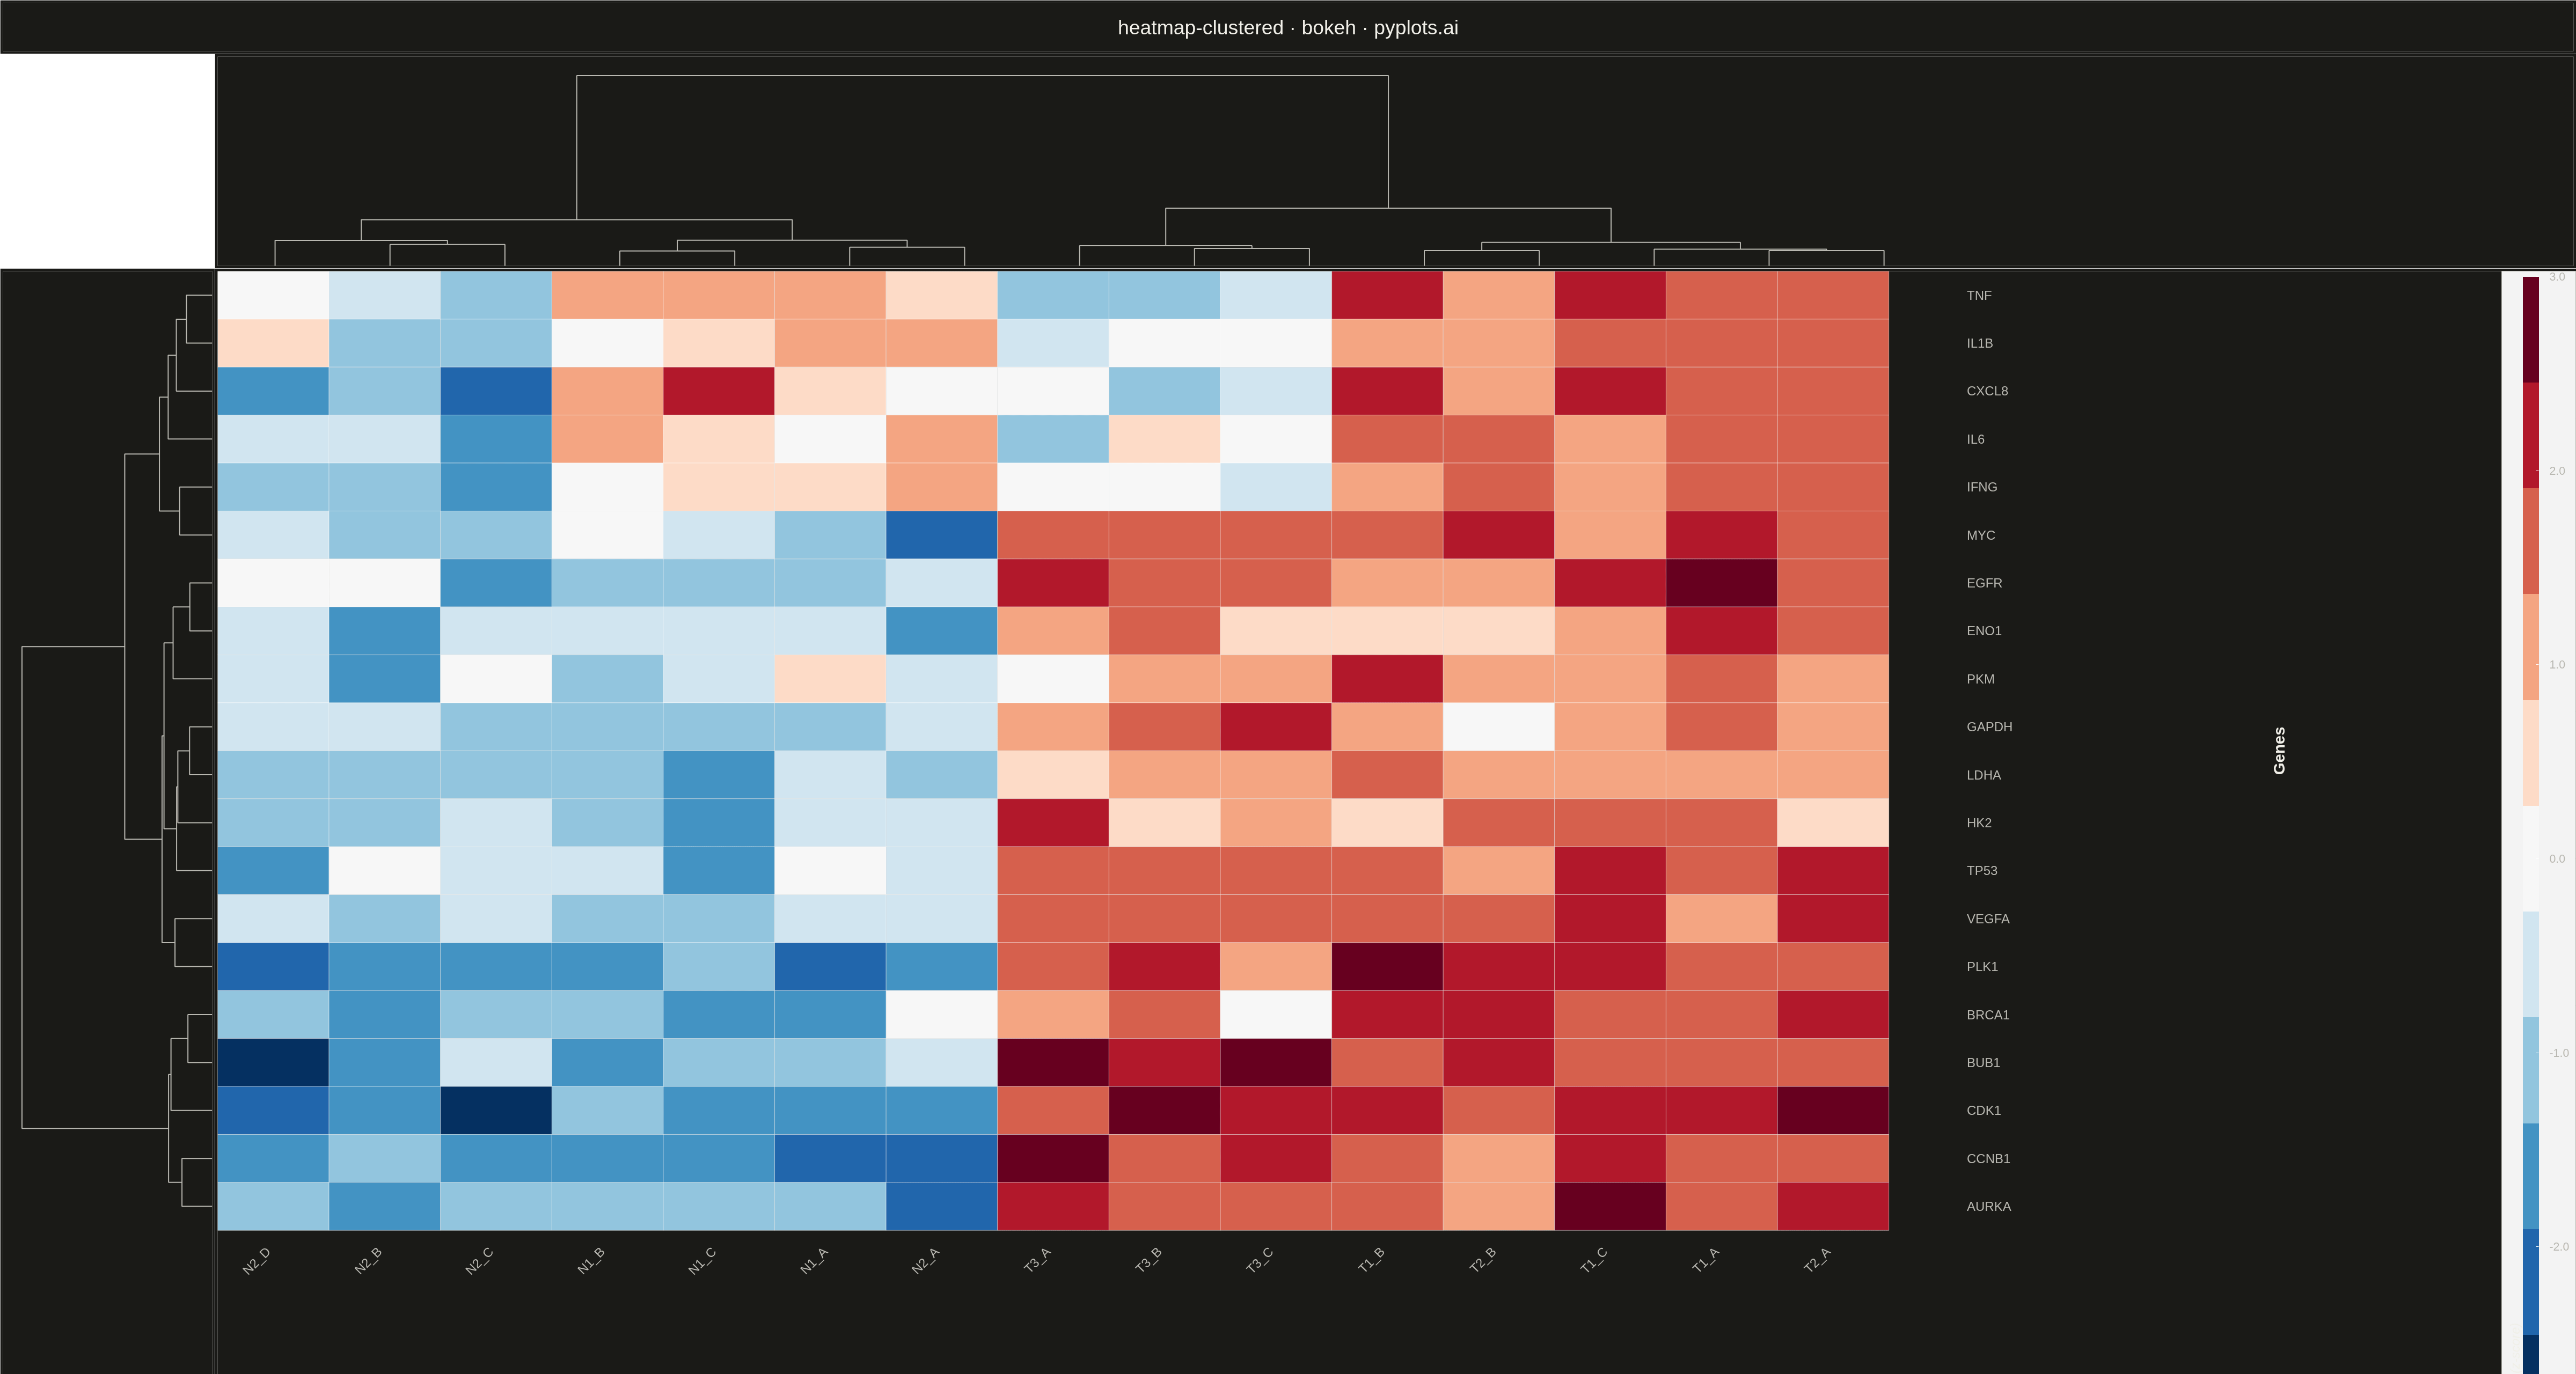
A heatmap with hierarchical clustering dendrograms on rows and/or columns, showing both data values and their hierarchical relationships. Rows and columns are automatically reordered based on clustering results to reveal natural groupings in the data. Essential for discovering patterns in high-dimensional data where similar observations or variables should be visually grouped together.
""" anyplot.ai
heatmap-clustered: Clustered Heatmap
Library: bokeh 3.9.0 | Python 3.13.13
Quality: 92/100 | Updated: 2026-05-09
"""

import os
import sys
import time
from pathlib import Path


# Fix import shadowing: import from site-packages first
# Python automatically adds the script directory to sys.path[0], so we remove it
if sys.path[0] in ("", ".") or sys.path[0].endswith("/python"):
    sys.path.pop(0)

import numpy as np
from bokeh.io import output_file, save
from bokeh.layouts import column
from bokeh.layouts import row as bokeh_row
from bokeh.models import (
    BasicTicker,
    ColorBar,
    ColumnDataSource,
    HoverTool,
    Label,
    LinearColorMapper,
    PrintfTickFormatter,
    Spacer,
)
from bokeh.plotting import figure
from bokeh.resources import CDN
from scipy.cluster.hierarchy import dendrogram, leaves_list, linkage
from scipy.spatial.distance import pdist
from selenium import webdriver
from selenium.webdriver.chrome.options import Options


# Theme colors
THEME = os.getenv("ANYPLOT_THEME", "light")
PAGE_BG = "#FAF8F1" if THEME == "light" else "#1A1A17"
ELEVATED_BG = "#FFFDF6" if THEME == "light" else "#242420"
INK = "#1A1A17" if THEME == "light" else "#F0EFE8"
INK_SOFT = "#4A4A44" if THEME == "light" else "#B8B7B0"
INK_MUTED = "#6B6A63" if THEME == "light" else "#A8A79F"

# Data: Gene expression analysis (20 genes x 15 samples)
np.random.seed(42)
n_genes = 20
n_samples = 15

# Gene names representing biological pathways
gene_labels = [
    "CDK1",
    "CCNB1",
    "PLK1",
    "AURKA",
    "BUB1",  # Cell cycle
    "GAPDH",
    "LDHA",
    "PKM",
    "HK2",
    "ENO1",  # Metabolism
    "IL6",
    "TNF",
    "IFNG",
    "IL1B",
    "CXCL8",  # Immune response
    "MYC",
    "TP53",
    "BRCA1",
    "EGFR",
    "VEGFA",  # Cancer-related
]

# Sample names (tumor vs normal comparisons)
sample_labels = [
    "T1_A",
    "T1_B",
    "T1_C",
    "T2_A",
    "T2_B",  # Tumor group 1
    "T3_A",
    "T3_B",
    "T3_C",  # Tumor group 2
    "N1_A",
    "N1_B",
    "N1_C",
    "N2_A",
    "N2_B",
    "N2_C",
    "N2_D",  # Normal
]

# Generate expression data with cluster structure
data = np.random.randn(n_genes, n_samples) * 0.5

# Cell cycle genes upregulated in tumors
data[0:5, 0:8] += 2.0
data[0:5, 8:15] -= 1.5

# Metabolism genes moderately upregulated in tumors
data[5:10, 0:8] += 1.2
data[5:10, 8:15] -= 0.8

# Immune genes show mixed pattern
data[10:15, 0:5] += 1.5
data[10:15, 5:8] -= 0.5
data[10:15, 8:12] += 0.8
data[10:15, 12:15] -= 1.2

# Cancer-related genes upregulated in tumors
data[15:20, 0:8] += 1.8
data[15:20, 8:15] -= 1.0

# Hierarchical clustering using Ward's method with Euclidean distance
row_linkage = linkage(pdist(data, metric="euclidean"), method="ward")
col_linkage = linkage(pdist(data.T, metric="euclidean"), method="ward")

# Get leaf ordering
row_order = leaves_list(row_linkage)
col_order = leaves_list(col_linkage)

# Reorder data and labels
data_ordered = data[row_order, :][:, col_order]
row_labels_ordered = [gene_labels[i] for i in row_order]
col_labels_ordered = [sample_labels[i] for i in col_order]

# Build dendrograms manually to get coordinates
row_dendro = dendrogram(row_linkage, no_plot=True)
col_dendro = dendrogram(col_linkage, no_plot=True)

# Layout dimensions - target 4800x2700 total
heatmap_width = 4000
heatmap_height = 1800
dendro_size = 400
label_space = 400

# Color mapper - diverging colormap centered at 0
mapper = LinearColorMapper(palette="RdBu11", low=-3, high=3)

# Prepare heatmap data using numerical coordinates
x_data = []
y_data = []
value_data = []
gene_name_data = []
sample_name_data = []
for i in range(n_genes):
    for j in range(n_samples):
        x_data.append(j)
        y_data.append(n_genes - 1 - i)  # Flip y so first row is at top
        value_data.append(data_ordered[i, j])
        gene_name_data.append(row_labels_ordered[i])
        sample_name_data.append(col_labels_ordered[j])

heatmap_source = ColumnDataSource(
    data={"x": x_data, "y": y_data, "value": value_data, "gene": gene_name_data, "sample": sample_name_data}
)

# Create main heatmap figure with extra space for labels
heatmap = figure(
    width=heatmap_width + label_space,
    height=heatmap_height + label_space,
    x_range=(-0.5, n_samples + 5),  # Extra space for gene labels and axis label on right
    y_range=(-5, n_genes - 0.5),  # Extra space for sample labels and axis label at bottom
    toolbar_location=None,
    tools="",
)

# Render heatmap rectangles
heatmap_rects = heatmap.rect(
    x="x",
    y="y",
    width=1,
    height=1,
    source=heatmap_source,
    fill_color={"field": "value", "transform": mapper},
    line_color="white",
    line_width=0.5,
)

# Add hover tooltip
hover = HoverTool(
    renderers=[heatmap_rects], tooltips=[("Gene", "@gene"), ("Sample", "@sample"), ("Expression", "@value{0.00}")]
)
heatmap.add_tools(hover)

# Add column labels (samples) at bottom - angled for readability
for j, label in enumerate(col_labels_ordered):
    heatmap.add_layout(
        Label(
            x=j,
            y=-1.0,
            text=label,
            text_font_size="18pt",
            text_align="right",
            angle=0.785,  # 45 degrees
            angle_units="rad",
            text_color=INK_SOFT,
        )
    )

# Add row labels (genes) on right side
for i, label in enumerate(row_labels_ordered):
    heatmap.add_layout(
        Label(
            x=n_samples + 0.2,
            y=n_genes - 1 - i,
            text=label,
            text_font_size="18pt",
            text_align="left",
            text_baseline="middle",
            text_color=INK_SOFT,
        )
    )

# Style heatmap
heatmap.axis.visible = False
heatmap.grid.grid_line_color = None
heatmap.outline_line_color = None
heatmap.background_fill_color = PAGE_BG
heatmap.border_fill_color = PAGE_BG

# Add axis labels as text (since axis is hidden)
heatmap.add_layout(
    Label(
        x=(n_samples - 1) / 2,
        y=-3.5,
        text="Samples",
        text_font_size="22pt",
        text_align="center",
        text_baseline="top",
        text_font_style="bold",
        text_color=INK,
    )
)
heatmap.add_layout(
    Label(
        x=n_samples + 3,
        y=(n_genes - 1) / 2,
        text="Genes",
        text_font_size="22pt",
        text_align="center",
        text_baseline="middle",
        angle=1.5708,  # 90 degrees in radians
        angle_units="rad",
        text_font_style="bold",
        text_color=INK,
    )
)

# Add color bar
color_bar = ColorBar(
    color_mapper=mapper,
    ticker=BasicTicker(desired_num_ticks=7),
    formatter=PrintfTickFormatter(format="%.1f"),
    label_standoff=20,
    border_line_color=INK_SOFT,
    location=(0, 0),
    title="Expression (z-score)",
    title_text_font_size="18pt",
    title_text_color=INK,
    major_label_text_font_size="16pt",
    major_label_text_color=INK_SOFT,
    width=30,
)
heatmap.add_layout(color_bar, "right")

# Create column dendrogram (top)
col_icoord = np.array(col_dendro["icoord"])
col_dcoord = np.array(col_dendro["dcoord"])
col_max_d = np.max(col_dcoord) * 1.1

col_dendro_fig = figure(
    width=heatmap_width + label_space,
    height=dendro_size,
    x_range=heatmap.x_range,
    y_range=(0, col_max_d),
    toolbar_location=None,
    tools="",
)

# Draw column dendrogram lines
for i in range(len(col_icoord)):
    # Scale x coordinates: dendrogram uses 5, 15, 25, ... for leaves
    x_coords = [(x - 5) / 10 for x in col_icoord[i]]
    col_dendro_fig.line(x_coords, col_dcoord[i], line_color=INK_SOFT, line_width=2)

col_dendro_fig.axis.visible = False
col_dendro_fig.grid.grid_line_color = None
col_dendro_fig.outline_line_color = None
col_dendro_fig.background_fill_color = PAGE_BG
col_dendro_fig.border_fill_color = PAGE_BG

# Create row dendrogram (left)
row_icoord = np.array(row_dendro["icoord"])
row_dcoord = np.array(row_dendro["dcoord"])
row_max_d = np.max(row_dcoord) * 1.1

row_dendro_fig = figure(
    width=dendro_size,
    height=heatmap_height + label_space,
    x_range=(row_max_d, 0),  # Reversed for left orientation
    y_range=heatmap.y_range,
    toolbar_location=None,
    tools="",
)

# Draw row dendrogram lines (rotated - swap x/y)
for i in range(len(row_icoord)):
    # Scale y coordinates to match heatmap, flip to match y-axis direction
    y_coords = [(y - 5) / 10 for y in row_icoord[i]]
    row_dendro_fig.line(row_dcoord[i], y_coords, line_color=INK_SOFT, line_width=2)

row_dendro_fig.axis.visible = False
row_dendro_fig.grid.grid_line_color = None
row_dendro_fig.outline_line_color = None
row_dendro_fig.background_fill_color = PAGE_BG
row_dendro_fig.border_fill_color = PAGE_BG

# Create title
title_fig = figure(
    width=heatmap_width + dendro_size + label_space,
    height=100,
    toolbar_location=None,
    tools="",
    x_range=(0, 1),
    y_range=(0, 1),
)
title_fig.text(
    x=[0.5],
    y=[0.5],
    text=["heatmap-clustered · bokeh · pyplots.ai"],
    text_font_size="28pt",
    text_align="center",
    text_baseline="middle",
    text_color=INK,
)
title_fig.axis.visible = False
title_fig.grid.grid_line_color = None
title_fig.outline_line_color = None
title_fig.background_fill_color = PAGE_BG
title_fig.border_fill_color = PAGE_BG

# Spacer for top-left corner
spacer = Spacer(width=dendro_size, height=dendro_size)

# Assemble layout
top_row = bokeh_row(spacer, col_dendro_fig)
bottom_row = bokeh_row(row_dendro_fig, heatmap)
layout = column(title_fig, top_row, bottom_row)

# Save outputs - HTML first
output_file(f"plot-{THEME}.html")
save(layout, resources=CDN, title="heatmap-clustered · bokeh · pyplots.ai")

# Screenshot with headless Chrome — Selenium 4 / Selenium Manager
W, H = 4800, 2700
opts = Options()
for arg in (
    "--headless=new",
    "--no-sandbox",
    "--disable-dev-shm-usage",
    "--disable-gpu",
    f"--window-size={W},{H}",
    "--hide-scrollbars",
):
    opts.add_argument(arg)
driver = webdriver.Chrome(options=opts)
driver.set_window_size(W, H)
driver.get(f"file://{Path(f'plot-{THEME}.html').resolve()}")
time.sleep(3)  # let bokeh's JS render the canvas
driver.save_screenshot(f"plot-{THEME}.png")
driver.quit()
Runnable source as JSON, for any HTTP client: https://api.anyplot.ai/specs/heatmap-clustered/bokeh/code. Any spec id and library id listed in llms-full.txt fit the same URL shape; every URL below is complete and callable.
{
  "spec_id": "heatmap-clustered",
  "language": "python",
  "library": "bokeh",
  "page": "https://anyplot.ai/heatmap-clustered/python/bokeh",
  "hub": "https://anyplot.ai/heatmap-clustered",
  "code_json": "https://api.anyplot.ai/specs/heatmap-clustered/bokeh/code",
  "spec_json": "https://api.anyplot.ai/specs/heatmap-clustered",
  "render_light_png": "https://storage.googleapis.com/anyplot-images/plots/heatmap-clustered/python/bokeh/plot-light.png",
  "render_dark_png": "https://storage.googleapis.com/anyplot-images/plots/heatmap-clustered/python/bokeh/plot-dark.png",
  "interactive_light_html": "https://storage.googleapis.com/anyplot-images/plots/heatmap-clustered/python/bokeh/plot-light.html",
  "interactive_dark_html": "https://storage.googleapis.com/anyplot-images/plots/heatmap-clustered/python/bokeh/plot-dark.html",
  "quality_score": 92.0,
  "license": "MIT",
  "guide": "https://anyplot.ai/llms.txt"
}
Part of Clustered Heatmap on anyplot.ai.