The same plot in 14 other libraries — JavaScript: D3.js, Apache ECharts, Highcharts, MUI X Charts; Python: Altair, Bokeh, lets-plot, Matplotlib, Plotly, plotnine, Pygal, Seaborn; R: ggplot2; Julia: Makie.jl. Compare all 15 side by side: Rainflow Counting Matrix for Fatigue Analysis in Python, R, Julia and JavaScript.
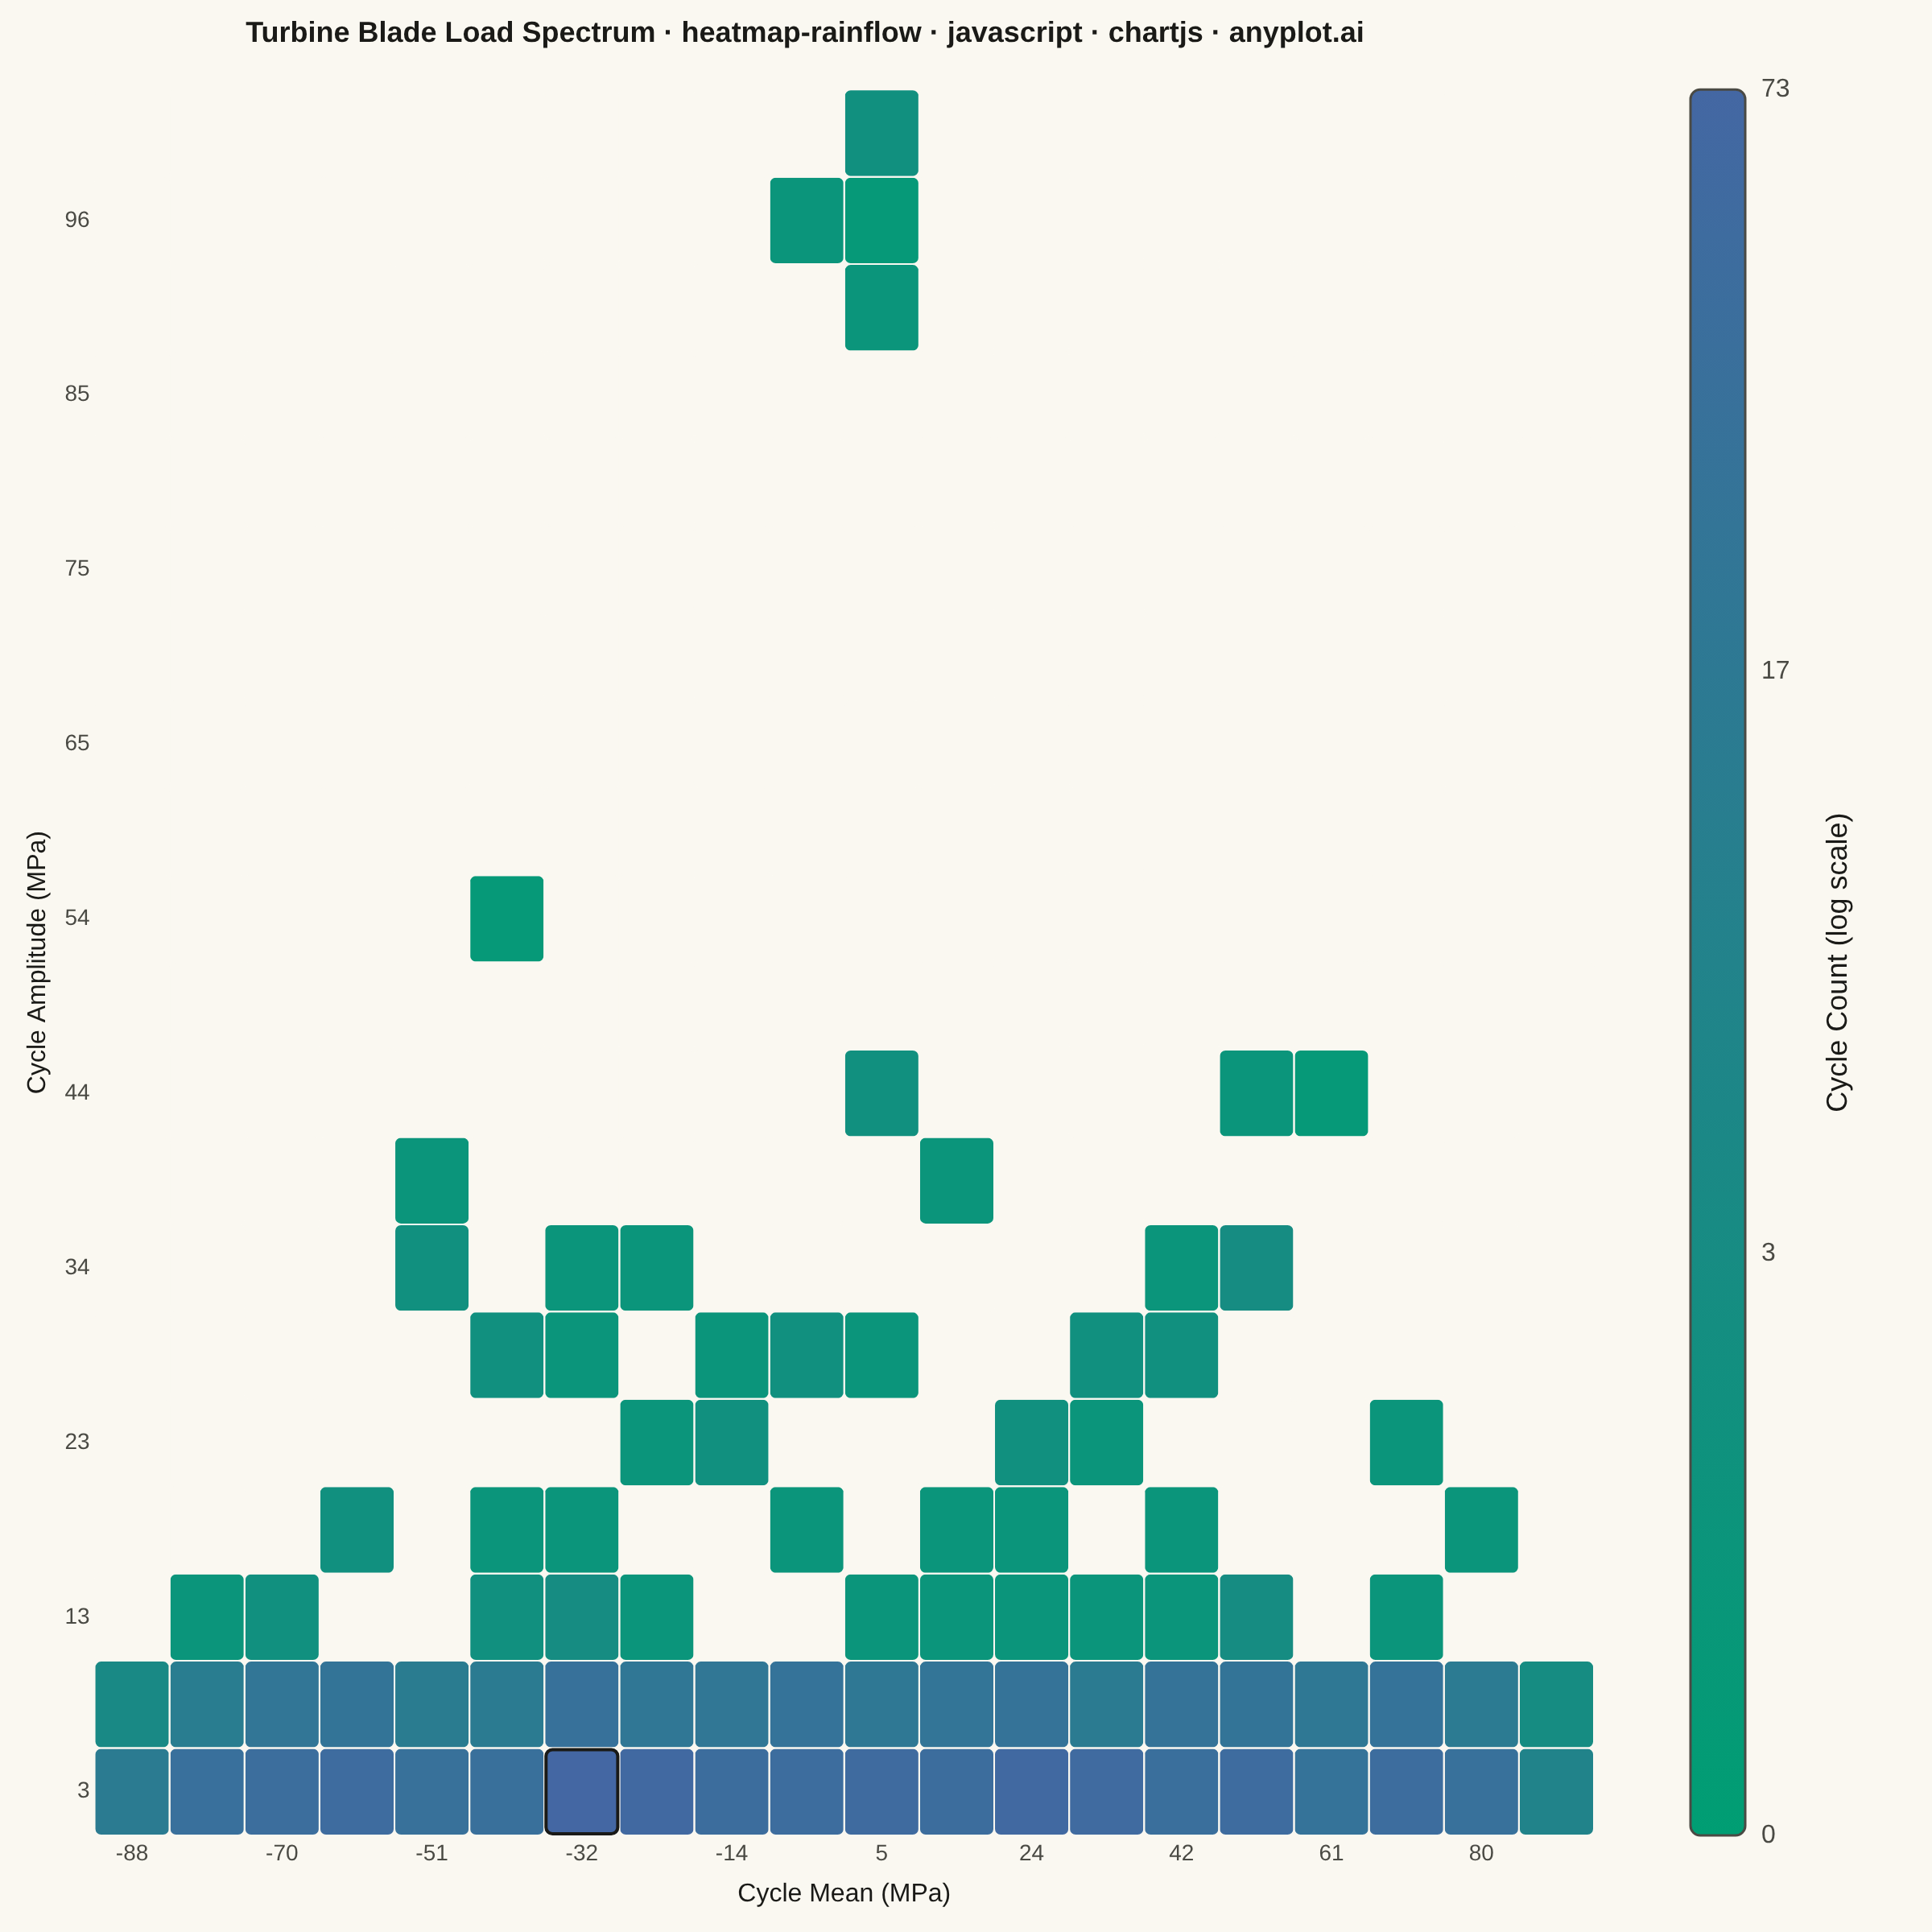
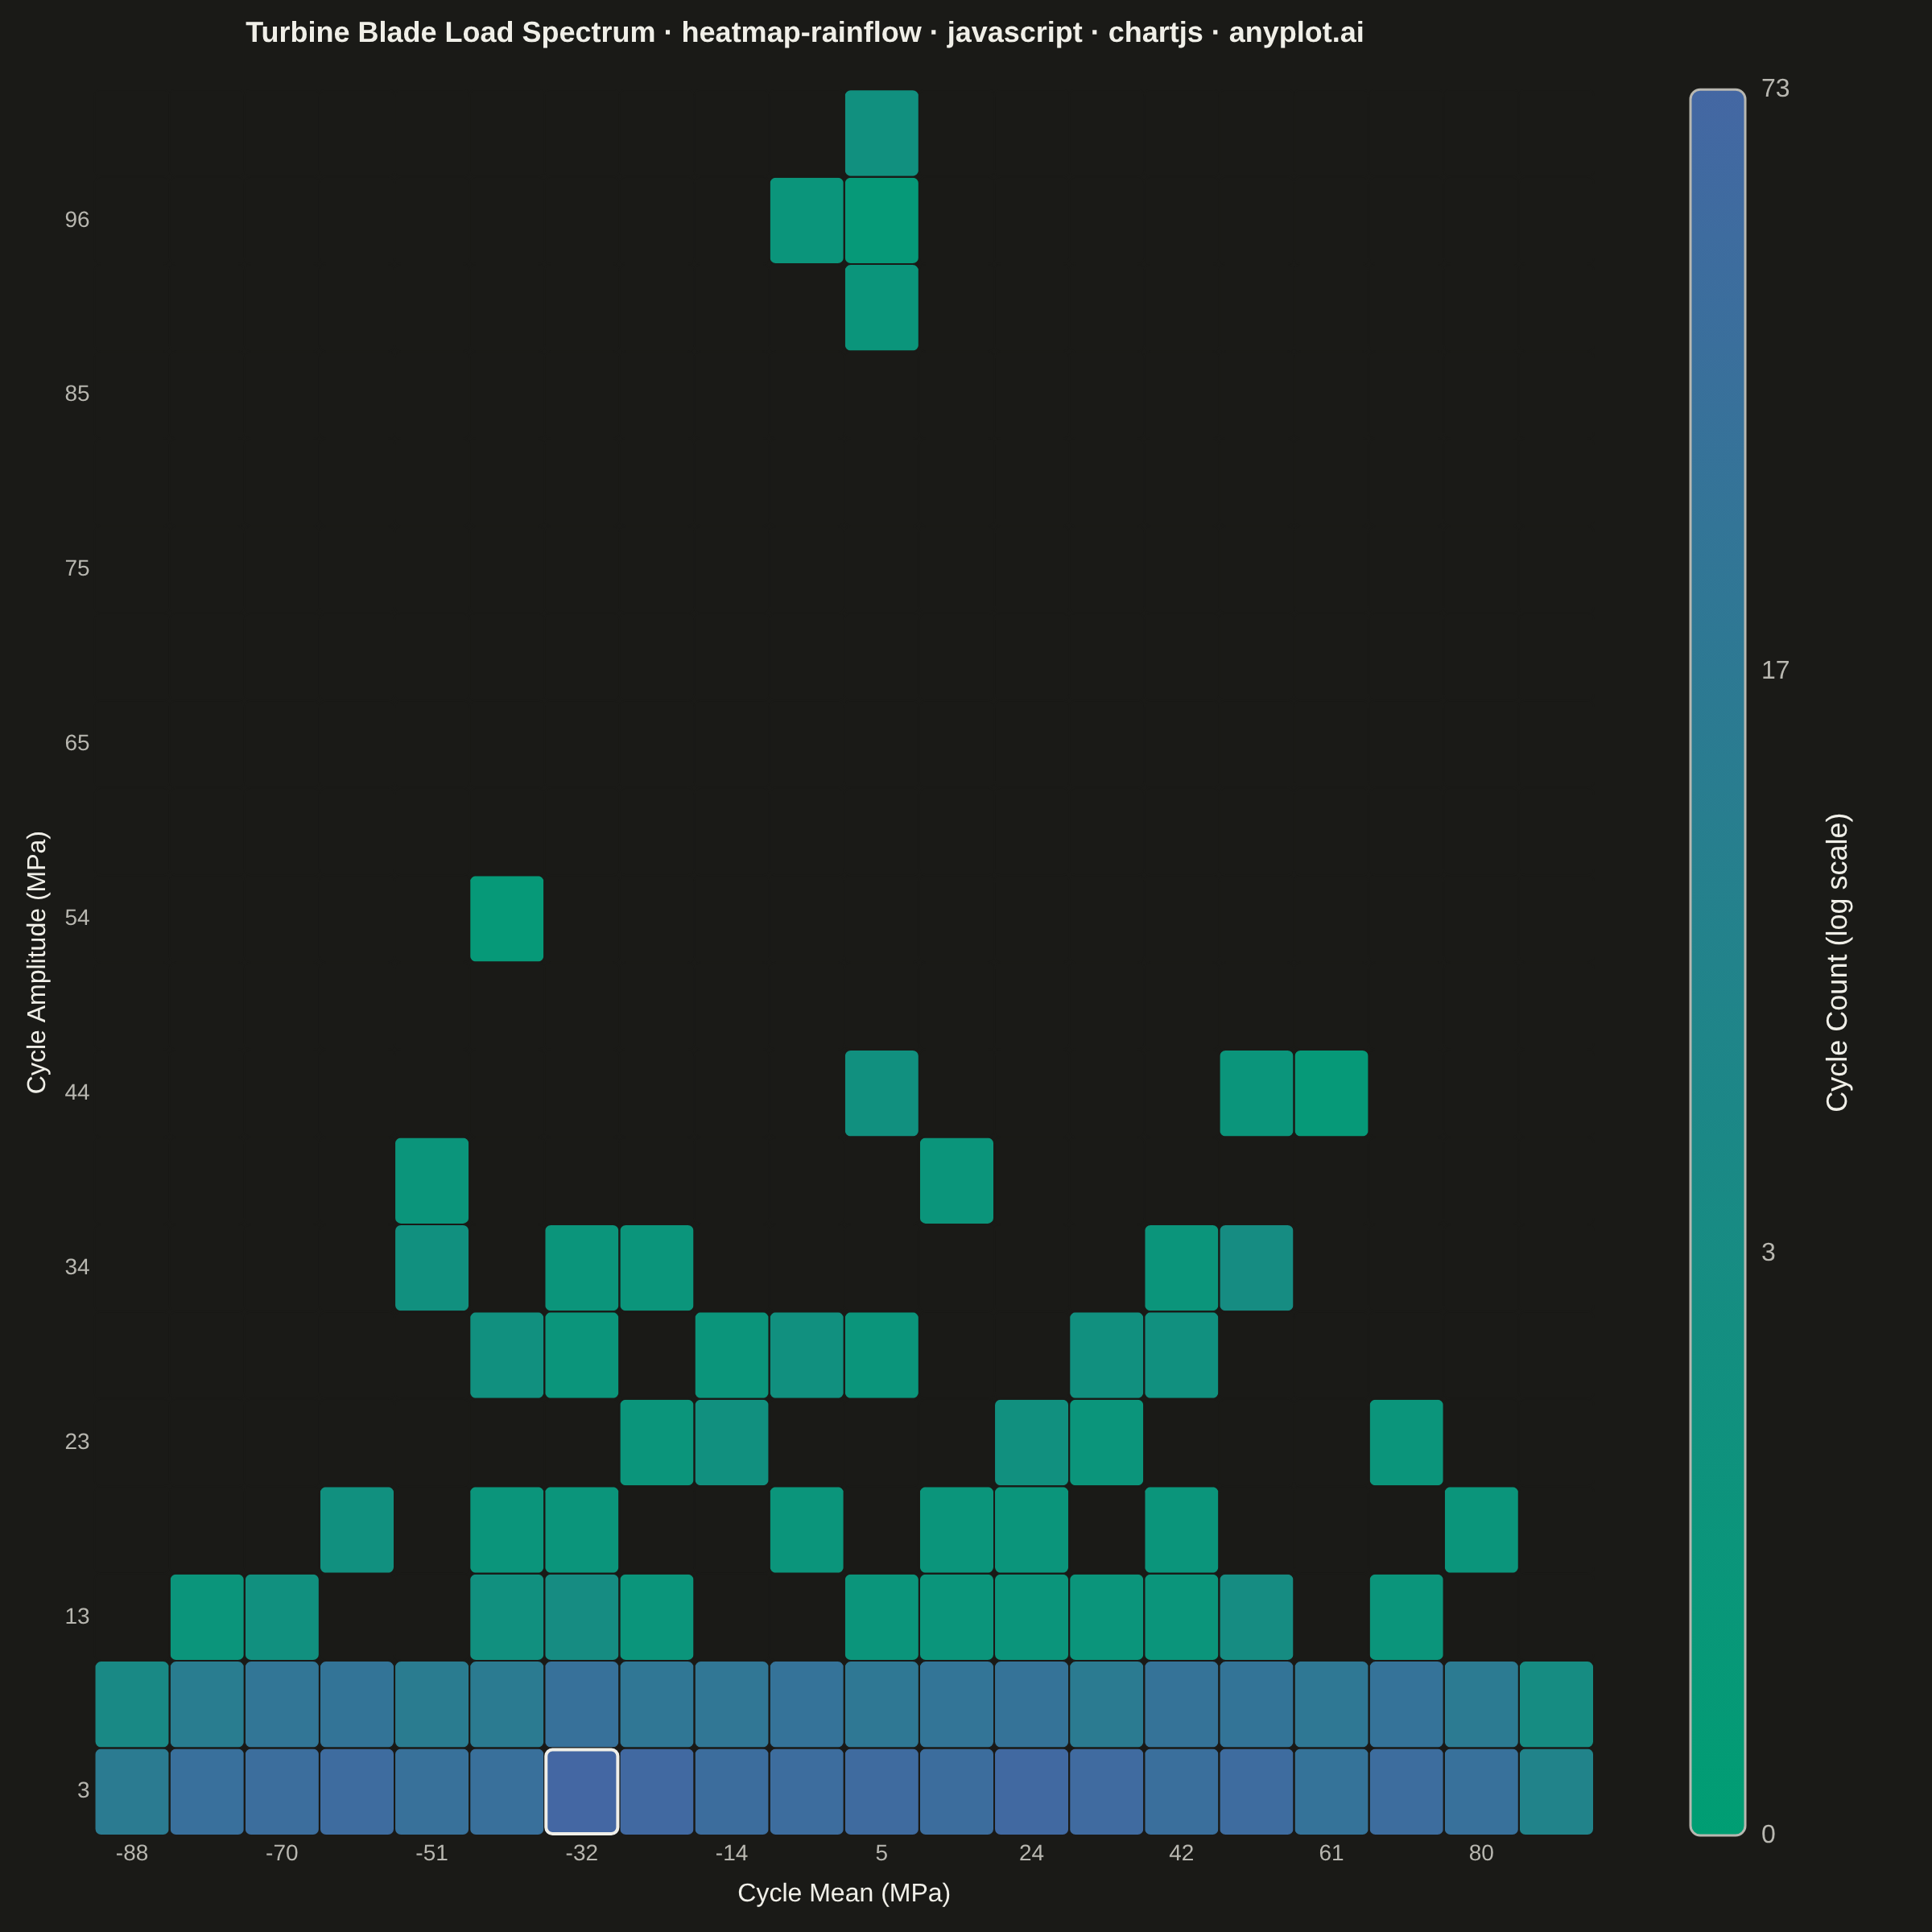
A rainflow counting matrix visualizes the results of rainflow cycle counting from a load or stress time history. The matrix displays cycle counts as a 2D heatmap where one axis represents cycle amplitude (half-range), the other represents cycle mean value, and color intensity represents the frequency of each cycle combination. This is a fundamental tool in fatigue analysis and durability engineering, used to characterize variable-amplitude loading for fatigue life prediction.
// anyplot.ai
// heatmap-rainflow: Rainflow Counting Matrix for Fatigue Analysis
// Library: chartjs 4.4.7 | JavaScript 22.23.2
// Quality: 88/100 | Created: 2026-08-25
//# anyplot-orientation: square

const t = window.ANYPLOT_TOKENS;

// --- Data: synthetic turbine blade root bending-moment load history --------
// Deterministic LCG — the browser has no seeded RNG.
function lcg(seed) {
  let s = seed;
  return () => {
    s = (s * 1664525 + 1013904223) % 4294967296;
    return s / 4294967296;
  };
}
const rand = lcg(42);

const N_SAMPLES = 4000;
const signal = new Array(N_SAMPLES);
for (let i = 0; i < N_SAMPLES; i++) {
  const tt = i / 40;
  const gust = rand() < 0.01 ? (rand() - 0.5) * 90 : 0;
  signal[i] =
    60 * Math.sin(tt * 0.31) +
    25 * Math.sin(tt * 1.7 + 1.1) +
    12 * Math.sin(tt * 4.3 + 0.4) +
    18 * (rand() - 0.5) +
    gust;
}

// Turning points (local extrema) — rainflow counting operates on peaks/valleys.
const turningPoints = [signal[0]];
for (let i = 1; i < N_SAMPLES - 1; i++) {
  const prev = signal[i - 1];
  const cur = signal[i];
  const next = signal[i + 1];
  if ((cur - prev) * (next - cur) < 0) turningPoints.push(cur);
}
turningPoints.push(signal[N_SAMPLES - 1]);

// --- Rainflow cycle counting (ASTM E1049 four-point stack algorithm) -------
const cycles = [];
const stack = [];
for (const point of turningPoints) {
  stack.push(point);
  while (stack.length >= 4) {
    const k = stack.length;
    const b = stack[k - 4];
    const c = stack[k - 3];
    const d = stack[k - 2];
    const e = stack[k - 1];
    const innerRange = Math.abs(d - c);
    const outerRange = Math.abs(e - d);
    if (outerRange >= innerRange) {
      cycles.push({ amplitude: innerRange / 2, mean: (c + d) / 2, weight: 1 });
      stack.splice(k - 3, 2);
    } else {
      break;
    }
  }
}
// Points left on the stack close as residual half-cycles.
for (let i = 0; i < stack.length - 1; i++) {
  const range = Math.abs(stack[i + 1] - stack[i]);
  cycles.push({
    amplitude: range / 2,
    mean: (stack[i] + stack[i + 1]) / 2,
    weight: 0.5,
  });
}

// --- Bin cycles into an amplitude x mean matrix -----------------------------
const N_BINS = 20;
const maxAmplitude = Math.max(...cycles.map((cy) => cy.amplitude));
const meanMin = Math.min(...cycles.map((cy) => cy.mean));
const meanMax = Math.max(...cycles.map((cy) => cy.mean));
const ampStep = maxAmplitude / N_BINS;
const meanStep = (meanMax - meanMin) / N_BINS;

const matrix = Array.from({ length: N_BINS }, () => new Array(N_BINS).fill(0));
for (const { amplitude, mean, weight } of cycles) {
  const ampIdx = Math.min(N_BINS - 1, Math.floor(amplitude / ampStep));
  const meanIdx = Math.min(N_BINS - 1, Math.floor((mean - meanMin) / meanStep));
  matrix[ampIdx][meanIdx] += weight;
}

const ampLabels = Array.from({ length: N_BINS }, (_, i) =>
  String(Math.round((i + 0.5) * ampStep)),
);
const meanLabels = Array.from({ length: N_BINS }, (_, i) =>
  String(Math.round(meanMin + (i + 0.5) * meanStep)),
);

const maxCount = Math.max(...matrix.flat());
const maxLog = Math.log10(maxCount + 1);
let maxAmpIdx = 0;
let maxMeanIdx = 0;
for (let ampIdx = 0; ampIdx < N_BINS; ampIdx++) {
  for (let meanIdx = 0; meanIdx < N_BINS; meanIdx++) {
    if (matrix[ampIdx][meanIdx] === maxCount) {
      maxAmpIdx = ampIdx;
      maxMeanIdx = meanIdx;
    }
  }
}

// --- Color helpers (Imprint imprint_seq, single-polarity) ------------------
function hexToRgb(hex) {
  const num = parseInt(hex.replace("#", ""), 16);
  return [(num >> 16) & 255, (num >> 8) & 255, num & 255];
}
function lerp(a, b, f) {
  return Math.round(a + (b - a) * f);
}
function sequentialRgb(frac) {
  const [lo, hi] = t.seq;
  const a = hexToRgb(lo);
  const b = hexToRgb(hi);
  return [lerp(a[0], b[0], frac), lerp(a[1], b[1], frac), lerp(a[2], b[2], frac)];
}
function rgbToCss(rgb) {
  return `rgb(${rgb[0]}, ${rgb[1]}, ${rgb[2]})`;
}

// --- Mount -------------------------------------------------------------------
const canvas = document.createElement("canvas");
document.getElementById("container").appendChild(canvas);

const cellData = [];
for (let ampIdx = 0; ampIdx < N_BINS; ampIdx++) {
  for (let meanIdx = 0; meanIdx < N_BINS; meanIdx++) {
    cellData.push({ x: meanIdx, y: ampIdx, count: matrix[ampIdx][meanIdx] });
  }
}

// --- Chart --------------------------------------------------------------
// Chart.js has no native matrix/heatmap type; a scatter chart supplies
// properly scaled category axes while a custom plugin paints the cells and
// colorbar directly on the canvas. Zero-count bins are left unpainted so
// they blend into the page background, per the spec's "visually distinct"
// note for empty amplitude-mean combinations.
const heatmapPlugin = {
  id: "rainflowHeatmap",
  afterDraw(chart) {
    const { ctx, chartArea, scales } = chart;
    const xScale = scales.x;
    const yScale = scales.y;
    const cellW = xScale.getPixelForValue(1) - xScale.getPixelForValue(0);
    const cellH = yScale.getPixelForValue(1) - yScale.getPixelForValue(0);

    const cellRadius = Math.min(4, Math.abs(cellH) / 4, cellW / 4);

    ctx.save();
    for (const { x: col, y: row, count } of cellData) {
      const cx = xScale.getPixelForValue(col);
      const cy = yScale.getPixelForValue(row);
      ctx.fillStyle =
        count > 0
          ? rgbToCss(sequentialRgb(Math.log10(count + 1) / maxLog))
          : t.pageBg;
      ctx.beginPath();
      ctx.roundRect(
        cx - cellW / 2,
        cy - Math.abs(cellH) / 2,
        cellW,
        Math.abs(cellH),
        cellRadius,
      );
      ctx.fill();
    }
    ctx.strokeStyle = t.pageBg;
    ctx.lineWidth = 1;
    for (const { x: col, y: row } of cellData) {
      const cx = xScale.getPixelForValue(col);
      const cy = yScale.getPixelForValue(row);
      ctx.beginPath();
      ctx.roundRect(
        cx - cellW / 2,
        cy - Math.abs(cellH) / 2,
        cellW,
        Math.abs(cellH),
        cellRadius,
      );
      ctx.stroke();
    }

    // Highlight the peak cell — the single most-populated amplitude-mean
    // combination, i.e. the dominant fatigue-damage contributor.
    const peakCx = xScale.getPixelForValue(maxMeanIdx);
    const peakCy = yScale.getPixelForValue(maxAmpIdx);
    ctx.strokeStyle = t.ink;
    ctx.lineWidth = 2;
    ctx.beginPath();
    ctx.roundRect(
      peakCx - cellW / 2 + 1,
      peakCy - Math.abs(cellH) / 2 + 1,
      cellW - 2,
      Math.abs(cellH) - 2,
      cellRadius,
    );
    ctx.stroke();

    // --- Colorbar (log-scaled cycle count) ----------------------------------
    const barW = 34;
    const barX = chartArea.right + 60;
    const barTop = chartArea.top;
    const barBottom = chartArea.bottom;

    const gradient = ctx.createLinearGradient(0, barTop, 0, barBottom);
    const STOPS = 12;
    for (let s = 0; s <= STOPS; s++) {
      gradient.addColorStop(s / STOPS, rgbToCss(sequentialRgb(1 - s / STOPS)));
    }
    const barRadius = 6;
    ctx.fillStyle = gradient;
    ctx.beginPath();
    ctx.roundRect(barX, barTop, barW, barBottom - barTop, barRadius);
    ctx.fill();
    ctx.strokeStyle = t.inkSoft;
    ctx.lineWidth = 1.5;
    ctx.beginPath();
    ctx.roundRect(barX, barTop, barW, barBottom - barTop, barRadius);
    ctx.stroke();

    ctx.font = "16px sans-serif";
    ctx.fillStyle = t.inkSoft;
    ctx.textAlign = "left";
    ctx.textBaseline = "middle";
    for (const frac of [0, 1 / 3, 2 / 3, 1]) {
      const value = Math.round(10 ** (frac * maxLog) - 1);
      const y = barBottom - frac * (barBottom - barTop);
      ctx.fillText(String(value), barX + barW + 10, y);
    }

    ctx.save();
    ctx.translate(barX + barW + 58, (barTop + barBottom) / 2);
    ctx.rotate(-Math.PI / 2);
    ctx.textAlign = "center";
    ctx.font = "18px sans-serif";
    ctx.fillStyle = t.ink;
    ctx.fillText("Cycle Count (log scale)", 0, 0);
    ctx.restore();

    ctx.restore();
  },
};

new Chart(canvas, {
  type: "scatter",
  data: {
    datasets: [
      {
        data: [
          { x: 0, y: 0 },
          { x: N_BINS - 1, y: N_BINS - 1 },
        ],
        pointStyle: false,
        showLine: false,
      },
    ],
  },
  options: {
    responsive: true,
    maintainAspectRatio: false,
    animation: false,
    layout: {
      padding: { top: 10, right: 210, bottom: 10, left: 10 },
    },
    plugins: {
      title: {
        display: true,
        text: "Turbine Blade Load Spectrum · heatmap-rainflow · javascript · chartjs · anyplot.ai",
        color: t.ink,
        font: { size: 18 },
        padding: { bottom: 24 },
      },
      legend: { display: false },
      tooltip: { enabled: false },
    },
    scales: {
      x: {
        type: "category",
        labels: meanLabels,
        bounds: "ticks",
        offset: true,
        position: "bottom",
        grid: { display: false, drawTicks: false },
        border: { display: false },
        ticks: { color: t.inkSoft, font: { size: 14 }, autoSkip: true, maxTicksLimit: 10 },
        title: {
          display: true,
          text: "Cycle Mean (MPa)",
          color: t.ink,
          font: { size: 16 },
        },
      },
      y: {
        type: "category",
        labels: ampLabels,
        bounds: "ticks",
        offset: true,
        reverse: true,
        grid: { display: false, drawTicks: false },
        border: { display: false },
        ticks: { color: t.inkSoft, font: { size: 14 }, autoSkip: true, maxTicksLimit: 10 },
        title: {
          display: true,
          text: "Cycle Amplitude (MPa)",
          color: t.ink,
          font: { size: 16 },
        },
      },
    },
  },
  plugins: [heatmapPlugin],
});
Runnable source as JSON, for any HTTP client: https://api.anyplot.ai/specs/heatmap-rainflow/chartjs/code. Any spec id and library id listed in llms-full.txt fit the same URL shape; every URL below is complete and callable.
{
  "spec_id": "heatmap-rainflow",
  "language": "javascript",
  "library": "chartjs",
  "page": "https://anyplot.ai/heatmap-rainflow/javascript/chartjs",
  "hub": "https://anyplot.ai/heatmap-rainflow",
  "code_json": "https://api.anyplot.ai/specs/heatmap-rainflow/chartjs/code",
  "spec_json": "https://api.anyplot.ai/specs/heatmap-rainflow",
  "render_light_png": "https://storage.googleapis.com/anyplot-images/plots/heatmap-rainflow/javascript/chartjs/plot-light.png",
  "render_dark_png": "https://storage.googleapis.com/anyplot-images/plots/heatmap-rainflow/javascript/chartjs/plot-dark.png",
  "interactive_light_html": "https://storage.googleapis.com/anyplot-images/plots/heatmap-rainflow/javascript/chartjs/plot-light.html",
  "interactive_dark_html": "https://storage.googleapis.com/anyplot-images/plots/heatmap-rainflow/javascript/chartjs/plot-dark.html",
  "quality_score": 88.0,
  "license": "MIT",
  "guide": "https://anyplot.ai/llms.txt"
}
Part of Rainflow Counting Matrix for Fatigue Analysis on anyplot.ai.