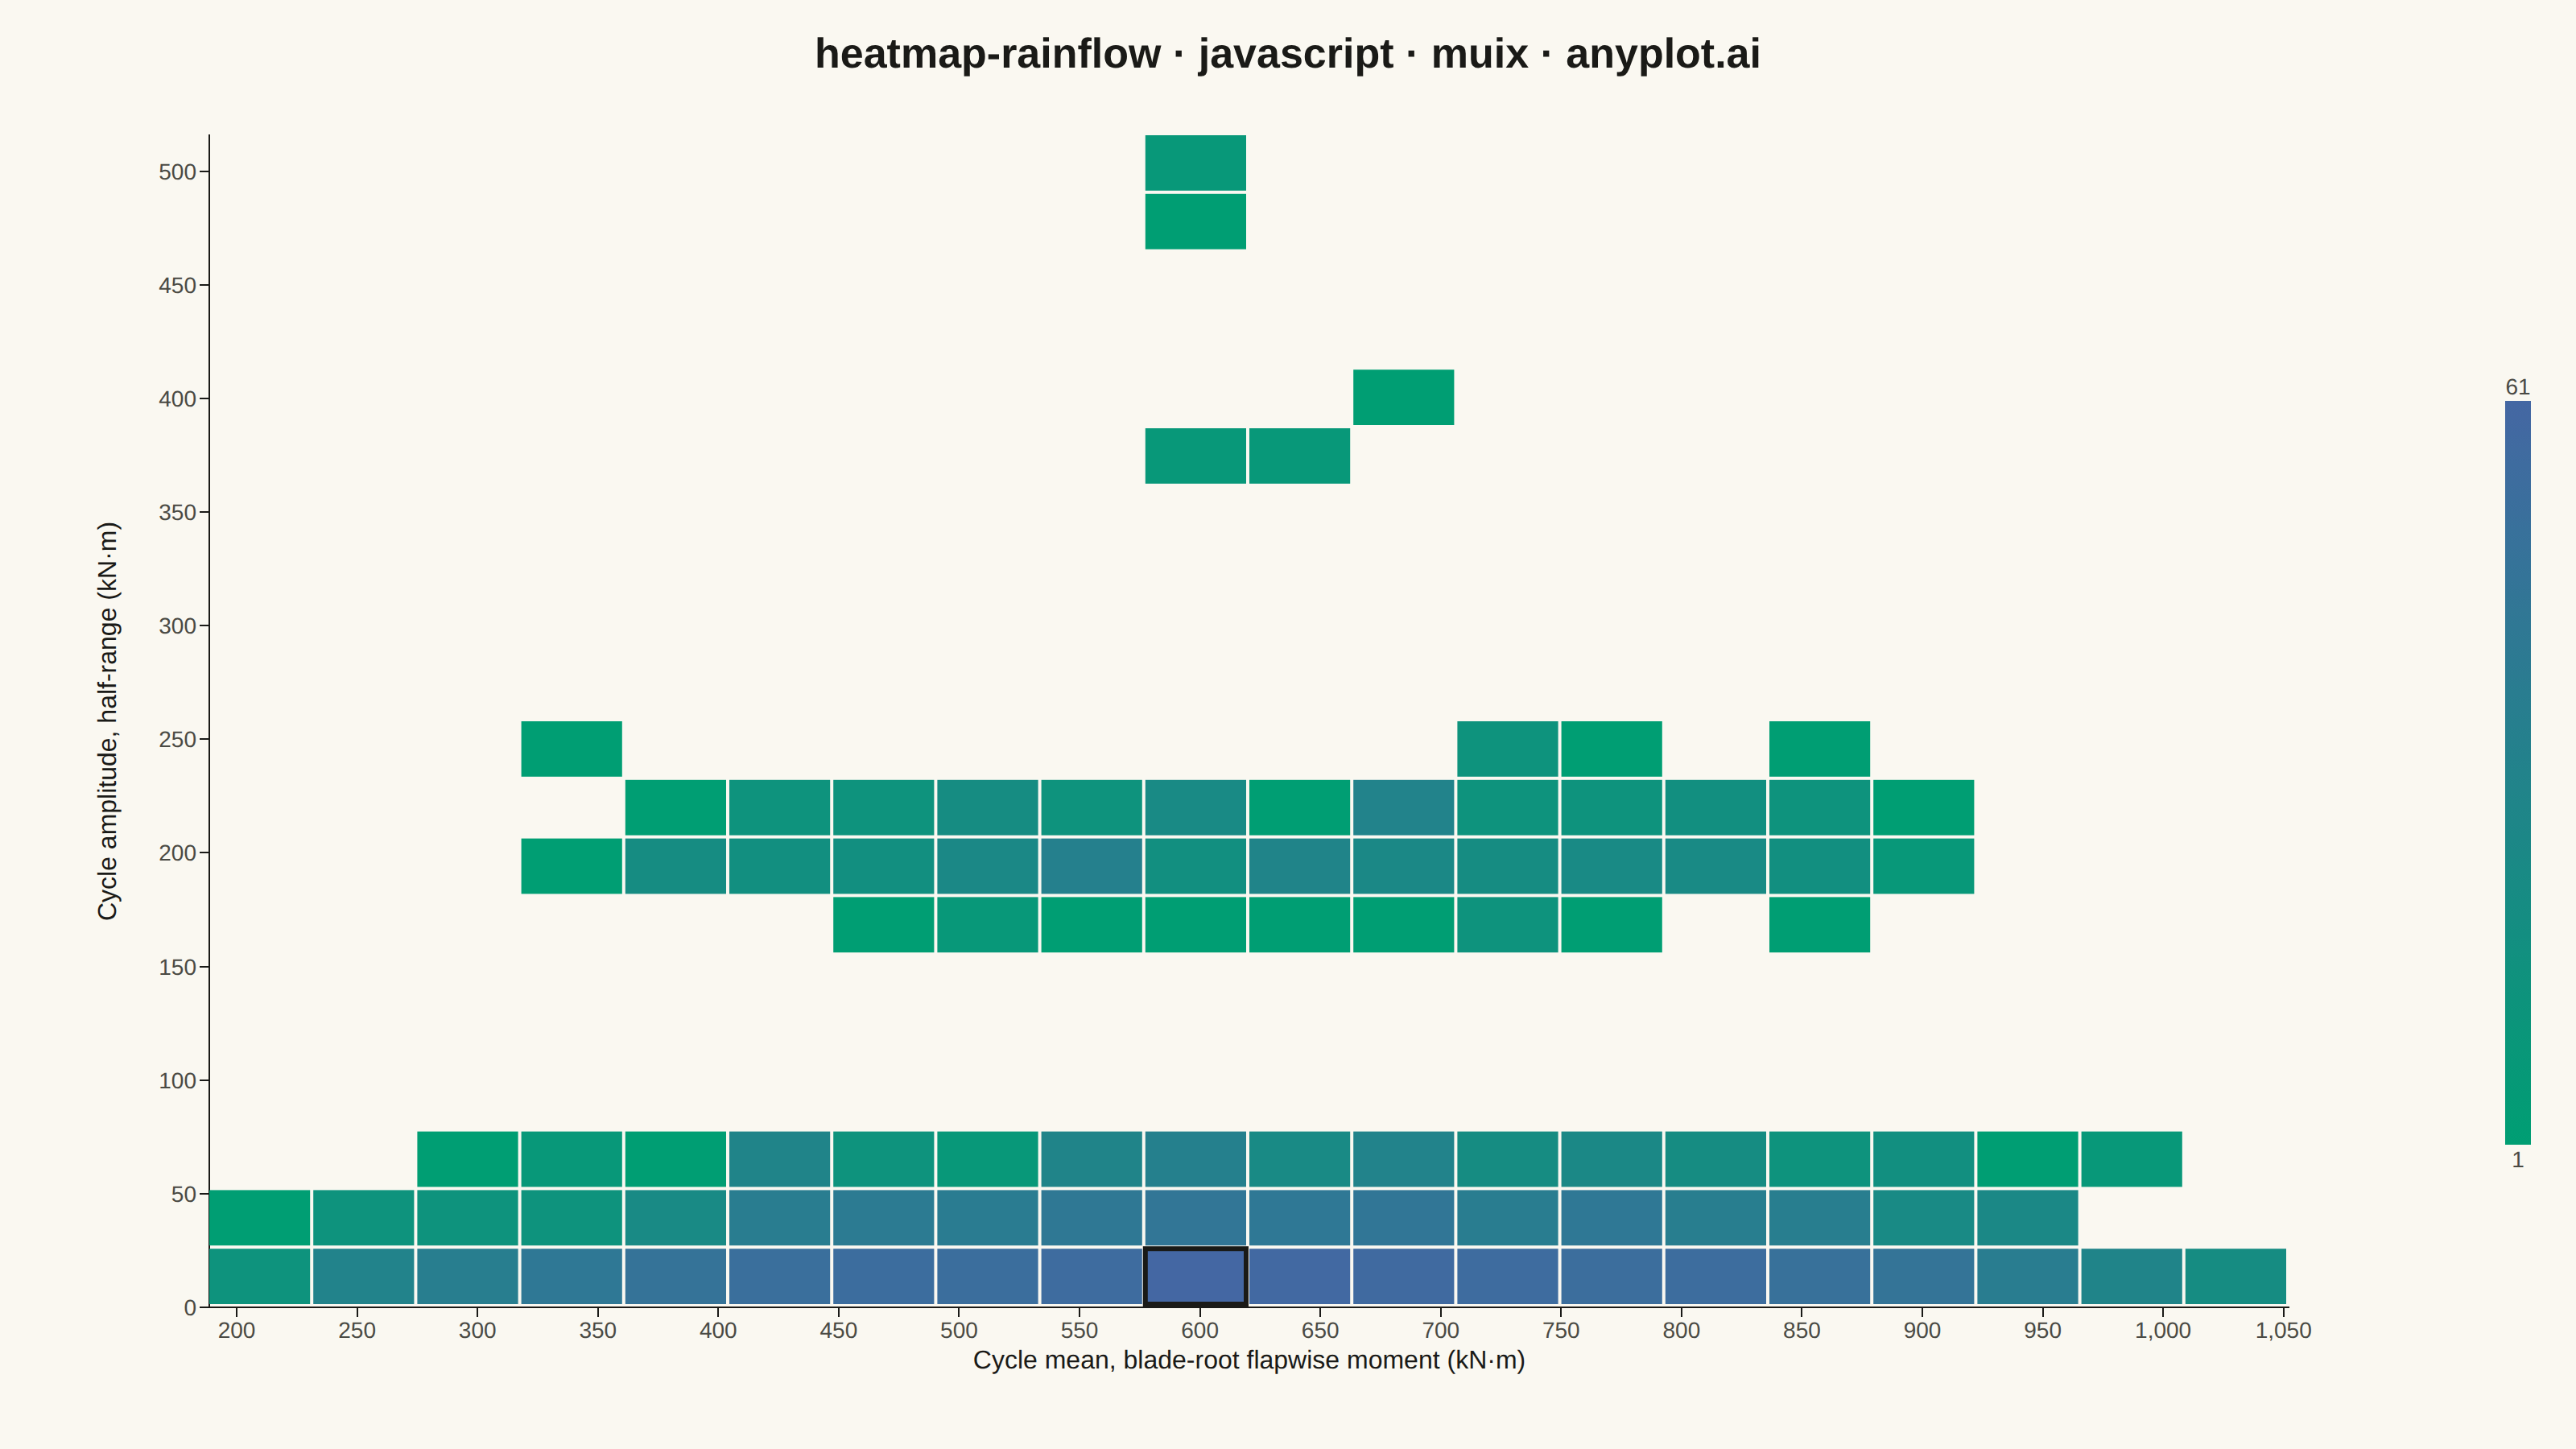
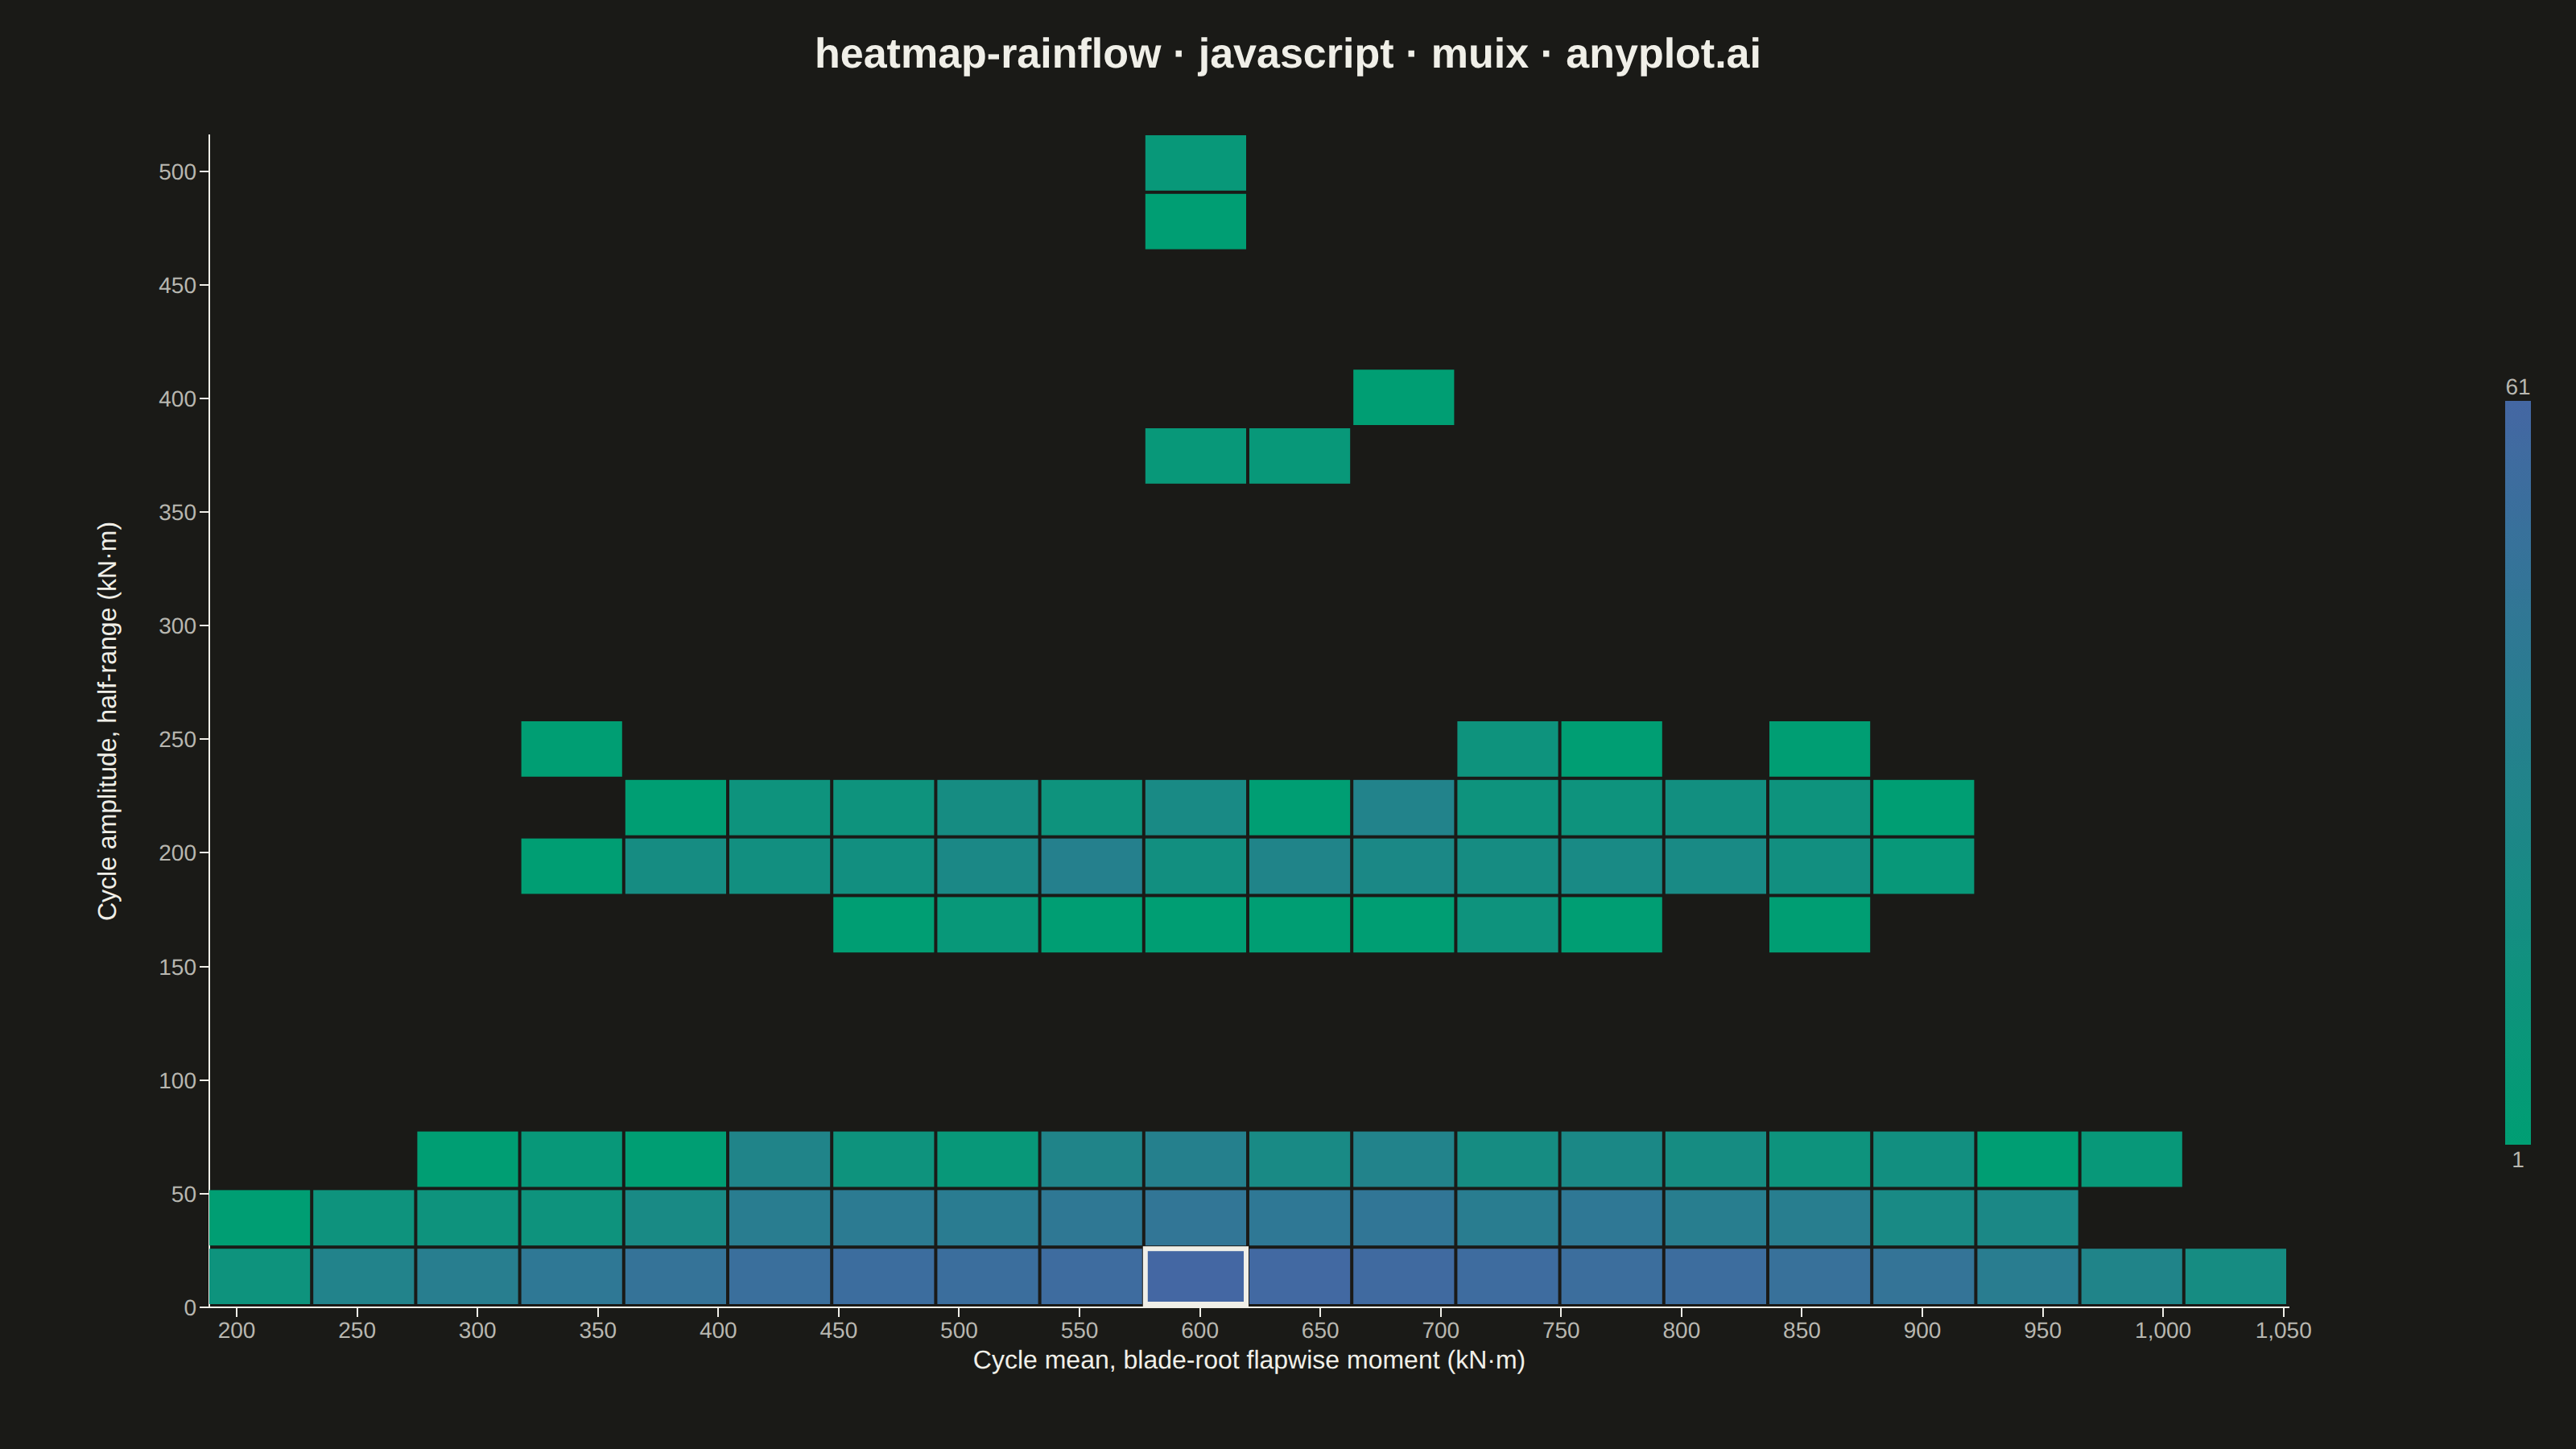
The same plot in 14 other libraries — JavaScript: Chart.js, D3.js, Apache ECharts, Highcharts; Python: Altair, Bokeh, lets-plot, Matplotlib, Plotly, plotnine, Pygal, Seaborn; R: ggplot2; Julia: Makie.jl. Compare all 15 side by side: Rainflow Counting Matrix for Fatigue Analysis in Python, R, Julia and JavaScript.
A rainflow counting matrix visualizes the results of rainflow cycle counting from a load or stress time history. The matrix displays cycle counts as a 2D heatmap where one axis represents cycle amplitude (half-range), the other represents cycle mean value, and color intensity represents the frequency of each cycle combination. This is a fundamental tool in fatigue analysis and durability engineering, used to characterize variable-amplitude loading for fatigue life prediction.
// anyplot.ai
// heatmap-rainflow: Rainflow Counting Matrix for Fatigue Analysis
// Library: muix 7.29.1 | JavaScript 22.23.2
// Quality: 90/100 | Created: 2026-08-25
import { ScatterChart } from "@mui/x-charts/ScatterChart";
import { ContinuousColorLegend } from "@mui/x-charts/ChartsLegend";
import Box from "@mui/material/Box";
import Typography from "@mui/material/Typography";

const t = window.ANYPLOT_TOKENS;

// Deterministic LCG (seed 42) — no Math.random() in the browser harness
function makeLcg(seed) {
  let state = seed >>> 0;
  return () => {
    state = (Math.imul(state, 1664525) + 1013904223) >>> 0;
    return state / 4294967296;
  };
}
const rng = makeLcg(42);

// --- Data: synthetic wind-turbine blade-root flapwise bending moment ------
// A slow operating-condition trend (gusts, pitch changes) carries fast
// turbulent fluctuations. Rainflow counting turns this load history into a
// 2D matrix of cycle amplitude vs. cycle mean — the standard input for
// fatigue-life (Miner's rule / S-N curve) calculations.
const SAMPLE_COUNT = 6000;
const loadSignal = [];
for (let i = 0; i < SAMPLE_COUNT; i += 1) {
  const trend = 620 + 180 * Math.sin((2 * Math.PI * i) / 900) + 90 * Math.sin((2 * Math.PI * i) / 2600 + 1.1);
  const turbulence =
    140 * Math.sin((2 * Math.PI * i) / 41) +
    70 * Math.sin((2 * Math.PI * i) / 17 + 0.6) +
    40 * Math.sin((2 * Math.PI * i) / 6.3 + 2.4) +
    50 * (rng() - 0.5);
  loadSignal.push(trend + turbulence);
}

// Reduce the signal to its turning points (local peaks/valleys) — rainflow
// counting only operates on reversals, not every sample.
function findTurningPoints(series) {
  const points = [series[0]];
  for (let i = 1; i < series.length - 1; i += 1) {
    const risingIn = series[i] > series[i - 1];
    const risingOut = series[i + 1] > series[i];
    if (risingIn !== risingOut) points.push(series[i]);
  }
  points.push(series[series.length - 1]);
  return points;
}

// ASTM E1049 three-point rainflow counting: extract a closed cycle whenever
// the innermost range is no larger than its neighbor, then collapse it out
// of the stack. Full cycles get weight 1; the leftover residual sequence is
// counted as half-cycles (weight 0.5), the standard convention.
function countRainflowCycles(turningPoints) {
  const stack = [];
  const cycles = [];
  turningPoints.forEach((point) => {
    stack.push(point);
    while (stack.length >= 3) {
      const n = stack.length;
      const innerRange = Math.abs(stack[n - 2] - stack[n - 3]);
      const outerRange = Math.abs(stack[n - 1] - stack[n - 2]);
      if (innerRange > outerRange) break;
      cycles.push({ range: innerRange, mean: (stack[n - 2] + stack[n - 3]) / 2, weight: 1 });
      stack.splice(n - 3, 2);
    }
  });
  for (let i = 0; i < stack.length - 1; i += 1) {
    cycles.push({ range: Math.abs(stack[i + 1] - stack[i]), mean: (stack[i + 1] + stack[i]) / 2, weight: 0.5 });
  }
  return cycles;
}

const cycles = countRainflowCycles(findTurningPoints(loadSignal));
const amplitudes = cycles.map((cycle) => cycle.range / 2);
const means = cycles.map((cycle) => cycle.mean);
const amplitudeMax = Math.max(...amplitudes);
const meanMin = Math.min(...means);
const meanMax = Math.max(...means);

// Bin into a 20x20 amplitude-by-mean matrix (typical rainflow matrix size).
const BIN_COUNT = 20;
const amplitudeBinWidth = amplitudeMax / BIN_COUNT;
const meanBinWidth = (meanMax - meanMin) / BIN_COUNT;

const binWeights = new Map();
cycles.forEach((cycle, i) => {
  const amplitudeIndex = Math.min(BIN_COUNT - 1, Math.floor(amplitudes[i] / amplitudeBinWidth));
  const meanIndex = Math.min(BIN_COUNT - 1, Math.floor((cycle.mean - meanMin) / meanBinWidth));
  const key = `${amplitudeIndex}-${meanIndex}`;
  binWeights.set(key, (binWeights.get(key) ?? 0) + cycle.weight);
});

// Zero-count bins are simply never added, so they stay fully transparent —
// the page background shows through instead of a drawn (misleadingly
// "zero-but-colored") cell.
let cycleCountMax = 0;
let cycleCountMin = Infinity;
let peakBinKey = null;
const matrixPoints = [];
binWeights.forEach((weight, key) => {
  const [amplitudeIndex, meanIndex] = key.split("-").map(Number);
  const count = Math.round(weight);
  if (count <= 0) return;
  if (count > cycleCountMax) {
    cycleCountMax = count;
    peakBinKey = key;
  }
  cycleCountMin = Math.min(cycleCountMin, count);
  matrixPoints.push({
    id: key,
    x: meanMin + (meanIndex + 0.5) * meanBinWidth,
    y: (amplitudeIndex + 0.5) * amplitudeBinWidth,
    z: Math.log1p(count),
  });
});
// Color on a log scale — rainflow matrices are heavily right-skewed (many
// low-count bins, a few dominant ones), so log contrast reads much better
// than linear. The domain (and legend) bottom anchors on the true rendered
// minimum (count=1's log1p), not log1p(0), since zero-count bins are never
// drawn at all — anchoring at 0 would understate how saturated the palest
// rendered cell actually is.
const colorDomainMin = Math.log1p(cycleCountMin);
const colorDomainMax = Math.log1p(cycleCountMax);

// Community @mui/x-charts has no Heatmap component (that's Pro-only) — a
// ScatterChart with a custom rect marker, sized from the bin width via the
// underlying linear scales, reproduces a true tiled heatmap grid instead of
// circular bubbles.
function MatrixCell(props) {
  const { series, xScale, yScale, colorGetter, color } = props;
  const cellWidth = Math.abs(xScale(meanBinWidth) - xScale(0));
  const cellHeight = Math.abs(yScale(amplitudeBinWidth) - yScale(0));

  return (
    <g>
      {series.data.map((point, i) => {
        // Outline the single dominant cell — the spec calls out "identifying
        // dominant cycle combinations" as a use case, so the peak bin gets a
        // visible focal point instead of blending into the ramp.
        const isPeak = point.id === peakBinKey;
        return (
          <rect
            key={point.id}
            x={xScale(point.x) - cellWidth / 2}
            y={yScale(point.y) - cellHeight / 2}
            width={Math.max(cellWidth - 2, 0)}
            height={Math.max(cellHeight - 2, 0)}
            fill={colorGetter ? colorGetter(i) : color}
            stroke={isPeak ? t.ink : "none"}
            strokeWidth={isPeak ? 3 : 0}
          />
        );
      })}
    </g>
  );
}

// --- Chart (default-exported component — the harness mounts it) -----------
export default function Chart() {
  const { width, height } = window.ANYPLOT_SIZE;
  const titleHeight = 60;
  const legendEdgeBuffer = 28; // ContinuousColorLegend right-aligns to the
  // chart's own width, not the margin box — trim the chart width so the
  // legend's max-value label doesn't sit flush against the canvas edge.
  const chartWidth = width - legendEdgeBuffer;

  return (
    <Box sx={{ width, height, bgcolor: t.pageBg, display: "flex", flexDirection: "column" }}>
      <Typography
        sx={{
          color: t.ink,
          fontSize: 26,
          fontWeight: 600,
          textAlign: "center",
          lineHeight: 1.2,
          pt: "18px",
          height: titleHeight,
          fontFamily: "inherit",
        }}
      >
        heatmap-rainflow · javascript · muix · anyplot.ai
      </Typography>
      <ScatterChart
        width={chartWidth}
        height={height - titleHeight}
        series={[
          {
            id: "rainflow-matrix",
            type: "scatter",
            data: matrixPoints,
            label: "Cycle count",
            zAxisId: "count",
          },
        ]}
        xAxis={[
          {
            scaleType: "linear",
            min: meanMin,
            max: meanMax,
            label: "Cycle mean, blade-root flapwise moment (kN·m)",
            tickLabelStyle: { fontSize: 14, fill: t.inkSoft },
            labelStyle: { fontSize: 16, fill: t.ink },
          },
        ]}
        yAxis={[
          {
            scaleType: "linear",
            min: 0,
            max: amplitudeMax,
            label: "Cycle amplitude, half-range (kN·m)",
            // tickFontSize only drives the y-axis label's clearance from the
            // tick text (it does not size the ticks themselves, that's
            // tickLabelStyle below) — bump it so the rotated label doesn't
            // sit on top of wide 3-4 digit tick numbers.
            tickFontSize: 42,
            tickLabelStyle: { fontSize: 14, fill: t.inkSoft },
            labelStyle: { fontSize: 16, fill: t.ink },
          },
        ]}
        zAxis={[
          {
            id: "count",
            min: colorDomainMin,
            max: colorDomainMax,
            colorMap: {
              type: "continuous",
              min: colorDomainMin,
              max: colorDomainMax,
              color: [t.seq[0], t.seq[1]],
            },
          },
        ]}
        margin={{ top: 24, right: 150, bottom: 88, left: 130 }}
        slots={{ scatter: MatrixCell }}
        slotProps={{ legend: { hidden: true } }}
        skipAnimation
      >
        <ContinuousColorLegend
          axisId="count"
          axisDirection="z"
          direction="column"
          position={{ horizontal: "right", vertical: "middle" }}
          length="55%"
          thickness={16}
          minLabel={`${cycleCountMin}`}
          maxLabel={`${cycleCountMax}`}
          labelStyle={{ fontSize: 14, fill: t.inkSoft, fontFamily: "inherit" }}
        />
      </ScatterChart>
    </Box>
  );
}
Runnable source as JSON, for any HTTP client: https://api.anyplot.ai/specs/heatmap-rainflow/muix/code. Any spec id and library id listed in llms-full.txt fit the same URL shape; every URL below is complete and callable.
{
  "spec_id": "heatmap-rainflow",
  "language": "javascript",
  "library": "muix",
  "page": "https://anyplot.ai/heatmap-rainflow/javascript/muix",
  "hub": "https://anyplot.ai/heatmap-rainflow",
  "code_json": "https://api.anyplot.ai/specs/heatmap-rainflow/muix/code",
  "spec_json": "https://api.anyplot.ai/specs/heatmap-rainflow",
  "render_light_png": "https://storage.googleapis.com/anyplot-images/plots/heatmap-rainflow/javascript/muix/plot-light.png",
  "render_dark_png": "https://storage.googleapis.com/anyplot-images/plots/heatmap-rainflow/javascript/muix/plot-dark.png",
  "interactive_light_html": "https://storage.googleapis.com/anyplot-images/plots/heatmap-rainflow/javascript/muix/plot-light.html",
  "interactive_dark_html": "https://storage.googleapis.com/anyplot-images/plots/heatmap-rainflow/javascript/muix/plot-dark.html",
  "quality_score": 90.0,
  "license": "MIT",
  "guide": "https://anyplot.ai/llms.txt"
}
Part of Rainflow Counting Matrix for Fatigue Analysis on anyplot.ai.