The same plot in 14 other libraries — JavaScript: Chart.js, D3.js, Highcharts, MUI X Charts; Python: Altair, Bokeh, lets-plot, Matplotlib, Plotly, plotnine, Pygal, Seaborn; R: ggplot2; Julia: Makie.jl. Compare all 15 side by side: Rainflow Counting Matrix for Fatigue Analysis in Python, R, Julia and JavaScript.
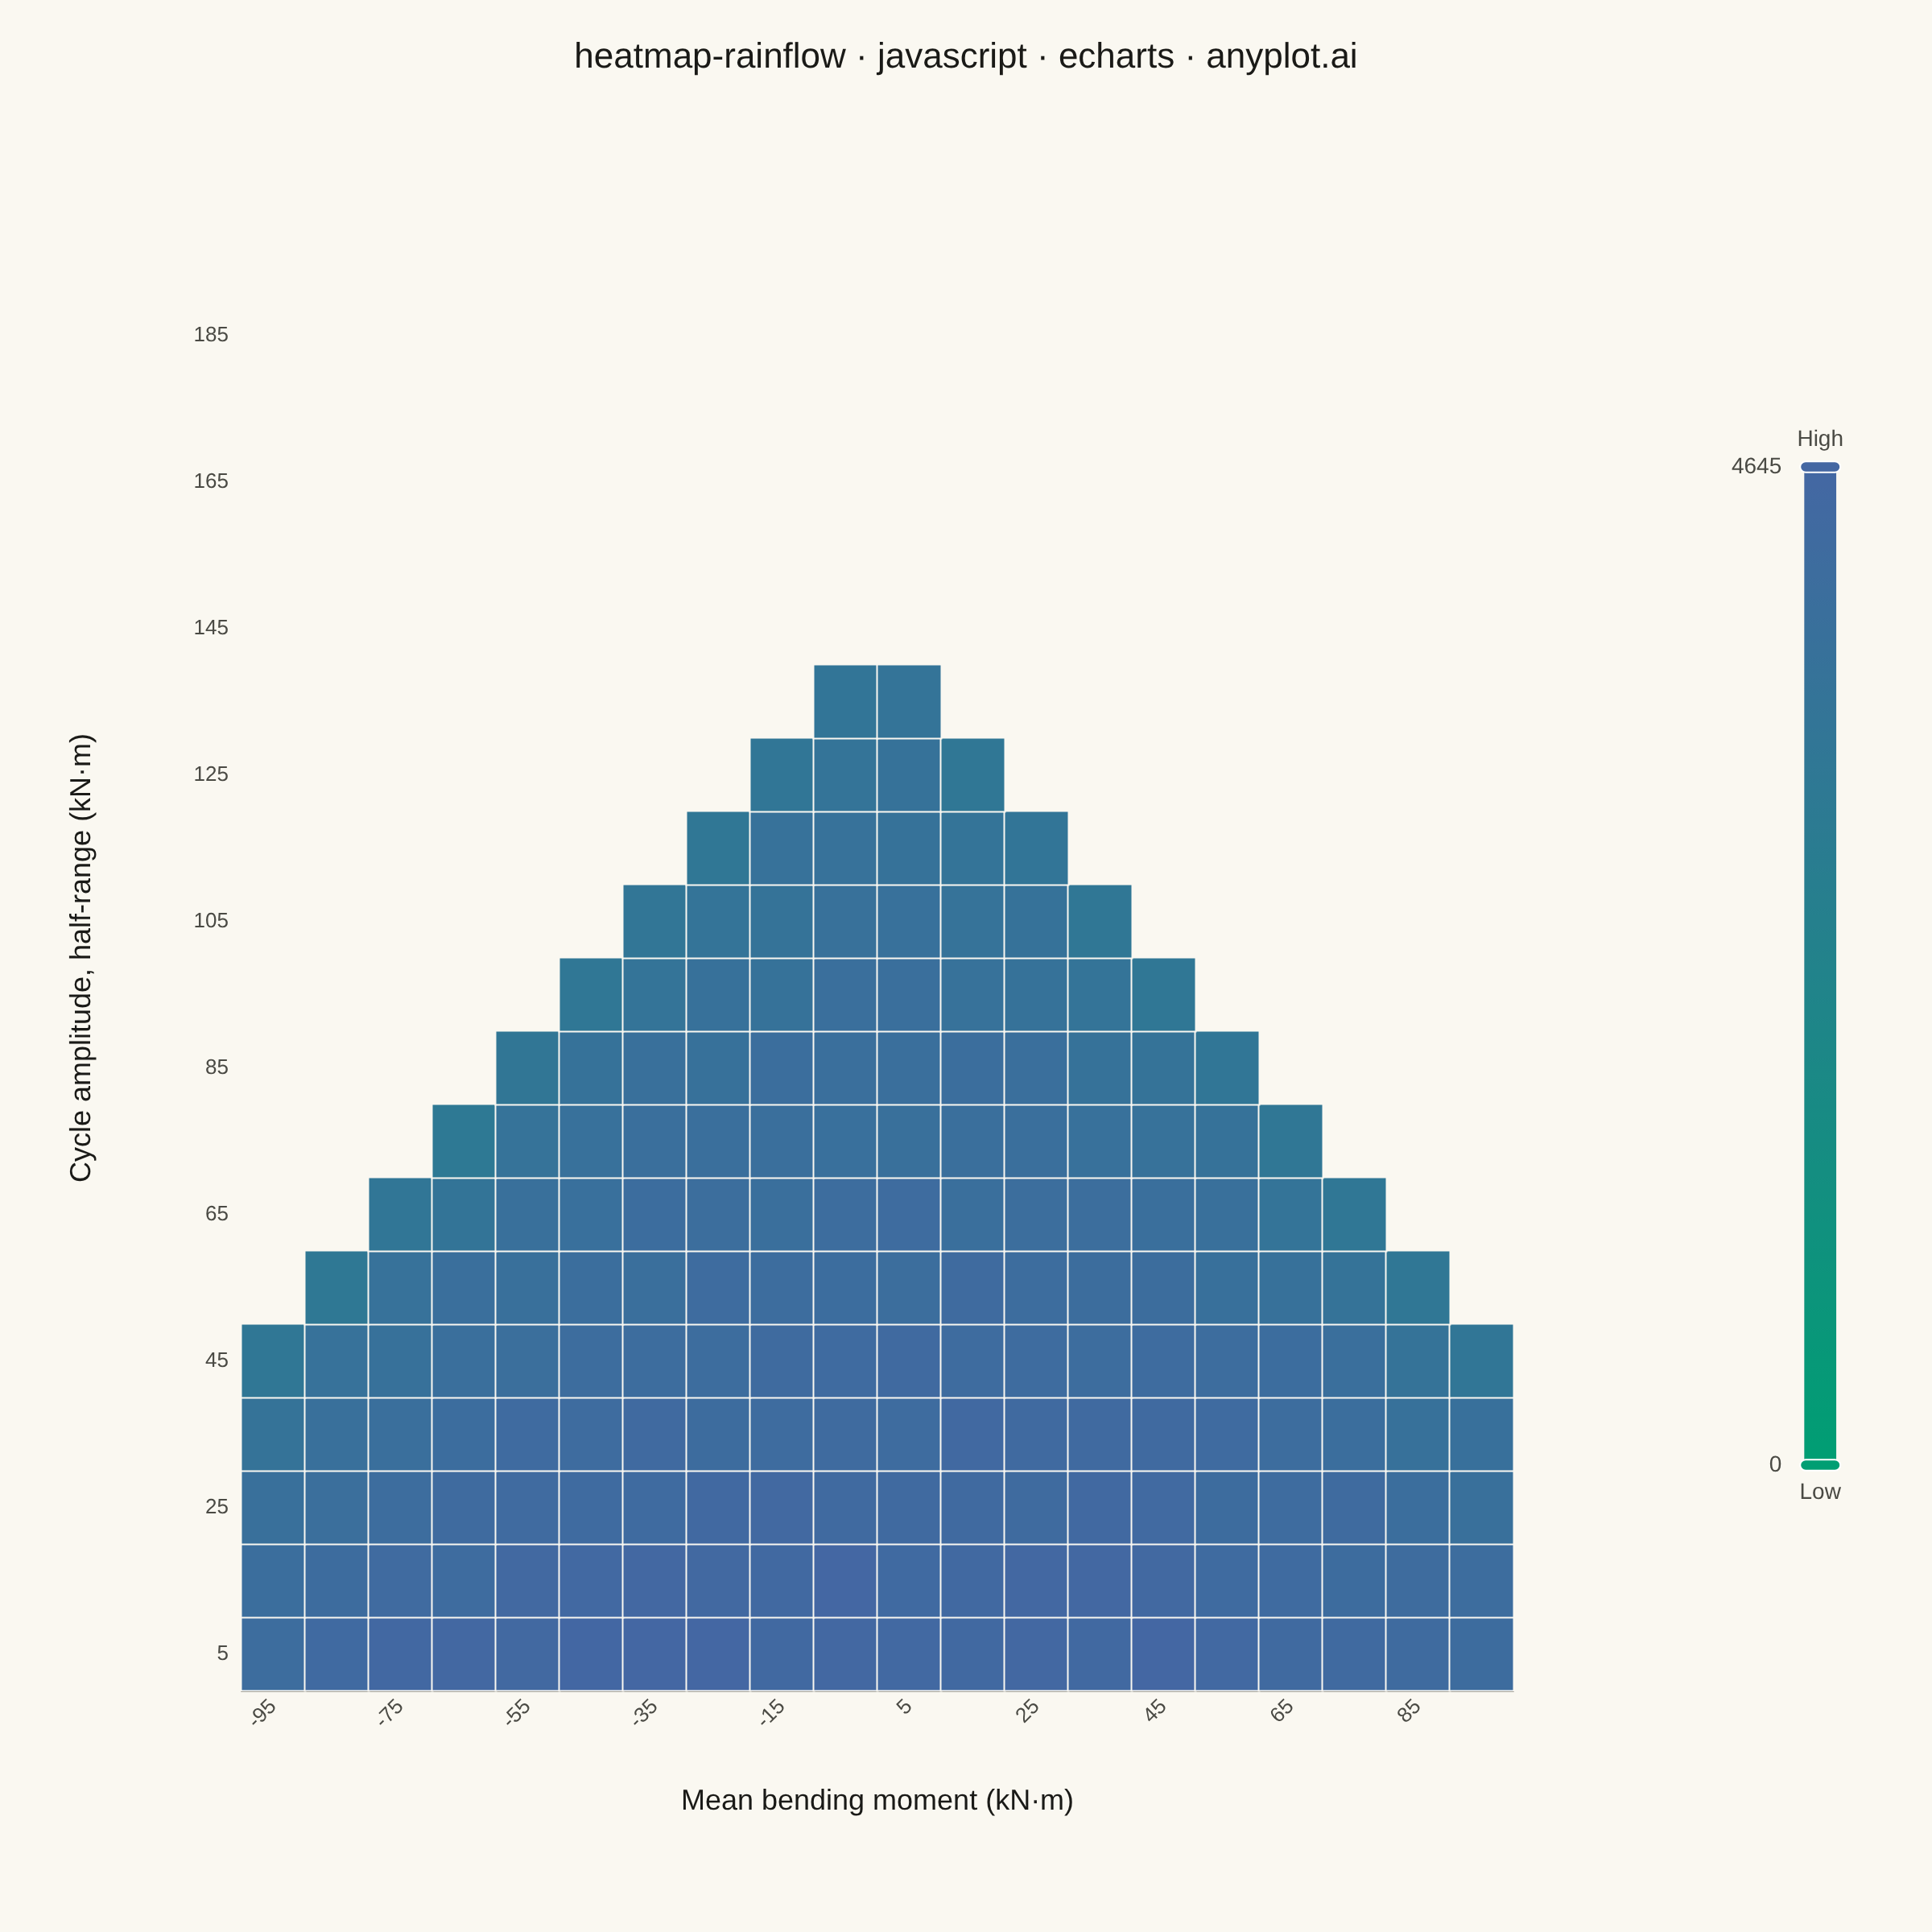
A rainflow counting matrix visualizes the results of rainflow cycle counting from a load or stress time history. The matrix displays cycle counts as a 2D heatmap where one axis represents cycle amplitude (half-range), the other represents cycle mean value, and color intensity represents the frequency of each cycle combination. This is a fundamental tool in fatigue analysis and durability engineering, used to characterize variable-amplitude loading for fatigue life prediction.
// anyplot.ai
// heatmap-rainflow: Rainflow Counting Matrix for Fatigue Analysis
// Library: echarts 6.1.0 | JavaScript 22.23.2
// Quality: 87/100 | Created: 2026-08-25

//# anyplot-orientation: square
const t = window.ANYPLOT_TOKENS;

// --- Data: rainflow counting matrix -----------------------------------------
// Simulated rainflow cycle counting from a wind-turbine blade-root flapwise
// bending-moment load history: many small-amplitude cycles spread across a
// wide range of mean values, progressively fewer and more mean-centered
// cycles as the amplitude grows (the classic "diamond" shape of a measured
// variable-amplitude load spectrum).
let seed = 1337;
function lcg() {
  seed = (seed * 1103515245 + 12345) & 0x7fffffff;
  return seed / 0x7fffffff;
}

const N_AMP = 20;
const N_MEAN = 20;
const AMP_STEP = 10; // kN·m
const MEAN_STEP = 10; // kN·m
const ampCenters = Array.from({ length: N_AMP }, (_, i) => 5 + i * AMP_STEP); // 5..195 kN·m
const meanCenters = Array.from({ length: N_MEAN }, (_, i) => -95 + i * MEAN_STEP); // -95..95 kN·m

// Physical envelope constraint: a cycle's peak and valley (mean +/- amplitude)
// are bounded by the blade root's overall load range, so |mean| <= ENV_LIMIT -
// amplitude. This is what produces the classic tapering "diamond" shape of a
// measured rainflow matrix — wide mean spread at low amplitude, narrowing to
// zero mean spread at the highest amplitudes.
const ENV_LIMIT = 150; // kN·m
const AMP_DECAY = 70; // kN·m, controls how fast cycle counts fall off with amplitude
const PEAK_COUNT = 4500;

const cells = [];
let maxCount = 0;
for (let ai = 0; ai < N_AMP; ai++) {
  const amp = ampCenters[ai];
  const meanLimit = ENV_LIMIT - amp;
  const ampFactor = Math.exp(-amp / AMP_DECAY);
  for (let mi = 0; mi < N_MEAN; mi++) {
    const mean = meanCenters[mi];
    let count = 0;
    if (meanLimit > 0) {
      // Parabolic falloff within the envelope: peaks at mean=0, reaches
      // exactly 0 at the envelope edges +/- meanLimit.
      const meanFactor = Math.max(0, 1 - (mean / meanLimit) ** 2);
      const jitter = 0.75 + 0.5 * lcg();
      count = Math.round(PEAK_COUNT * ampFactor * meanFactor * jitter);
    }
    if (count > maxCount) maxCount = count;
    // Zero/near-zero bins are skipped entirely so they stay visually distinct
    // (transparent background) rather than rendered as a "dark zero" cell.
    if (count > 2) {
      cells.push([mi, ai, Math.log10(count + 1)]);
    }
  }
}
const maxLog = Math.log10(maxCount + 1);

// --- Init --------------------------------------------------------------------
const chart = echarts.init(document.getElementById("container"));

// --- Option --------------------------------------------------------------------
chart.setOption({
  animation: false,
  backgroundColor: "transparent",
  title: {
    text: "heatmap-rainflow · javascript · echarts · anyplot.ai",
    left: "center",
    top: 20,
    textStyle: { color: t.ink, fontSize: 22, fontWeight: 500 },
  },
  tooltip: {
    formatter: (p) =>
      `Mean: ${meanCenters[p.value[0]]} kN·m<br/>Amplitude: ${ampCenters[p.value[1]]} kN·m<br/>Cycles: ${Math.round(10 ** p.value[2] - 1)}`,
  },
  grid: {
    left: 150,
    right: 260,
    top: 140,
    bottom: 150,
  },
  xAxis: {
    type: "category",
    data: meanCenters,
    name: "Mean bending moment (kN·m)",
    nameLocation: "middle",
    nameGap: 60,
    nameTextStyle: { color: t.ink, fontSize: 18 },
    axisLabel: { color: t.inkSoft, fontSize: 13, interval: 1, rotate: 45 },
    axisLine: { lineStyle: { color: t.inkSoft } },
    axisTick: { show: false },
    splitArea: { show: false },
  },
  yAxis: {
    type: "category",
    data: ampCenters,
    name: "Cycle amplitude, half-range (kN·m)",
    nameLocation: "middle",
    nameGap: 90,
    nameTextStyle: { color: t.ink, fontSize: 18 },
    axisLabel: { color: t.inkSoft, fontSize: 13, interval: 1 },
    axisLine: { show: false },
    axisTick: { show: false },
    splitArea: { show: false },
  },
  visualMap: {
    type: "continuous",
    min: 0,
    max: maxLog,
    calculable: true,
    orient: "vertical",
    right: 40,
    top: "middle",
    itemHeight: 620,
    inRange: { color: t.seq },
    text: ["High", "Low"],
    textStyle: { color: t.inkSoft, fontSize: 14 },
    formatter: (value) => `${Math.round(Math.pow(10, value) - 1)}`,
  },
  series: [
    {
      type: "heatmap",
      data: cells,
      itemStyle: { borderColor: t.pageBg, borderWidth: 1 },
      emphasis: {
        itemStyle: { borderColor: t.ink, borderWidth: 2 },
      },
    },
  ],
});
Runnable source as JSON, for any HTTP client: https://api.anyplot.ai/specs/heatmap-rainflow/echarts/code. Any spec id and library id listed in llms-full.txt fit the same URL shape; every URL below is complete and callable.
{
  "spec_id": "heatmap-rainflow",
  "language": "javascript",
  "library": "echarts",
  "page": "https://anyplot.ai/heatmap-rainflow/javascript/echarts",
  "hub": "https://anyplot.ai/heatmap-rainflow",
  "code_json": "https://api.anyplot.ai/specs/heatmap-rainflow/echarts/code",
  "spec_json": "https://api.anyplot.ai/specs/heatmap-rainflow",
  "render_light_png": "https://storage.googleapis.com/anyplot-images/plots/heatmap-rainflow/javascript/echarts/plot-light.png",
  "render_dark_png": "https://storage.googleapis.com/anyplot-images/plots/heatmap-rainflow/javascript/echarts/plot-dark.png",
  "interactive_light_html": "https://storage.googleapis.com/anyplot-images/plots/heatmap-rainflow/javascript/echarts/plot-light.html",
  "interactive_dark_html": "https://storage.googleapis.com/anyplot-images/plots/heatmap-rainflow/javascript/echarts/plot-dark.html",
  "quality_score": 87.0,
  "license": "MIT",
  "guide": "https://anyplot.ai/llms.txt"
}
Part of Rainflow Counting Matrix for Fatigue Analysis on anyplot.ai.