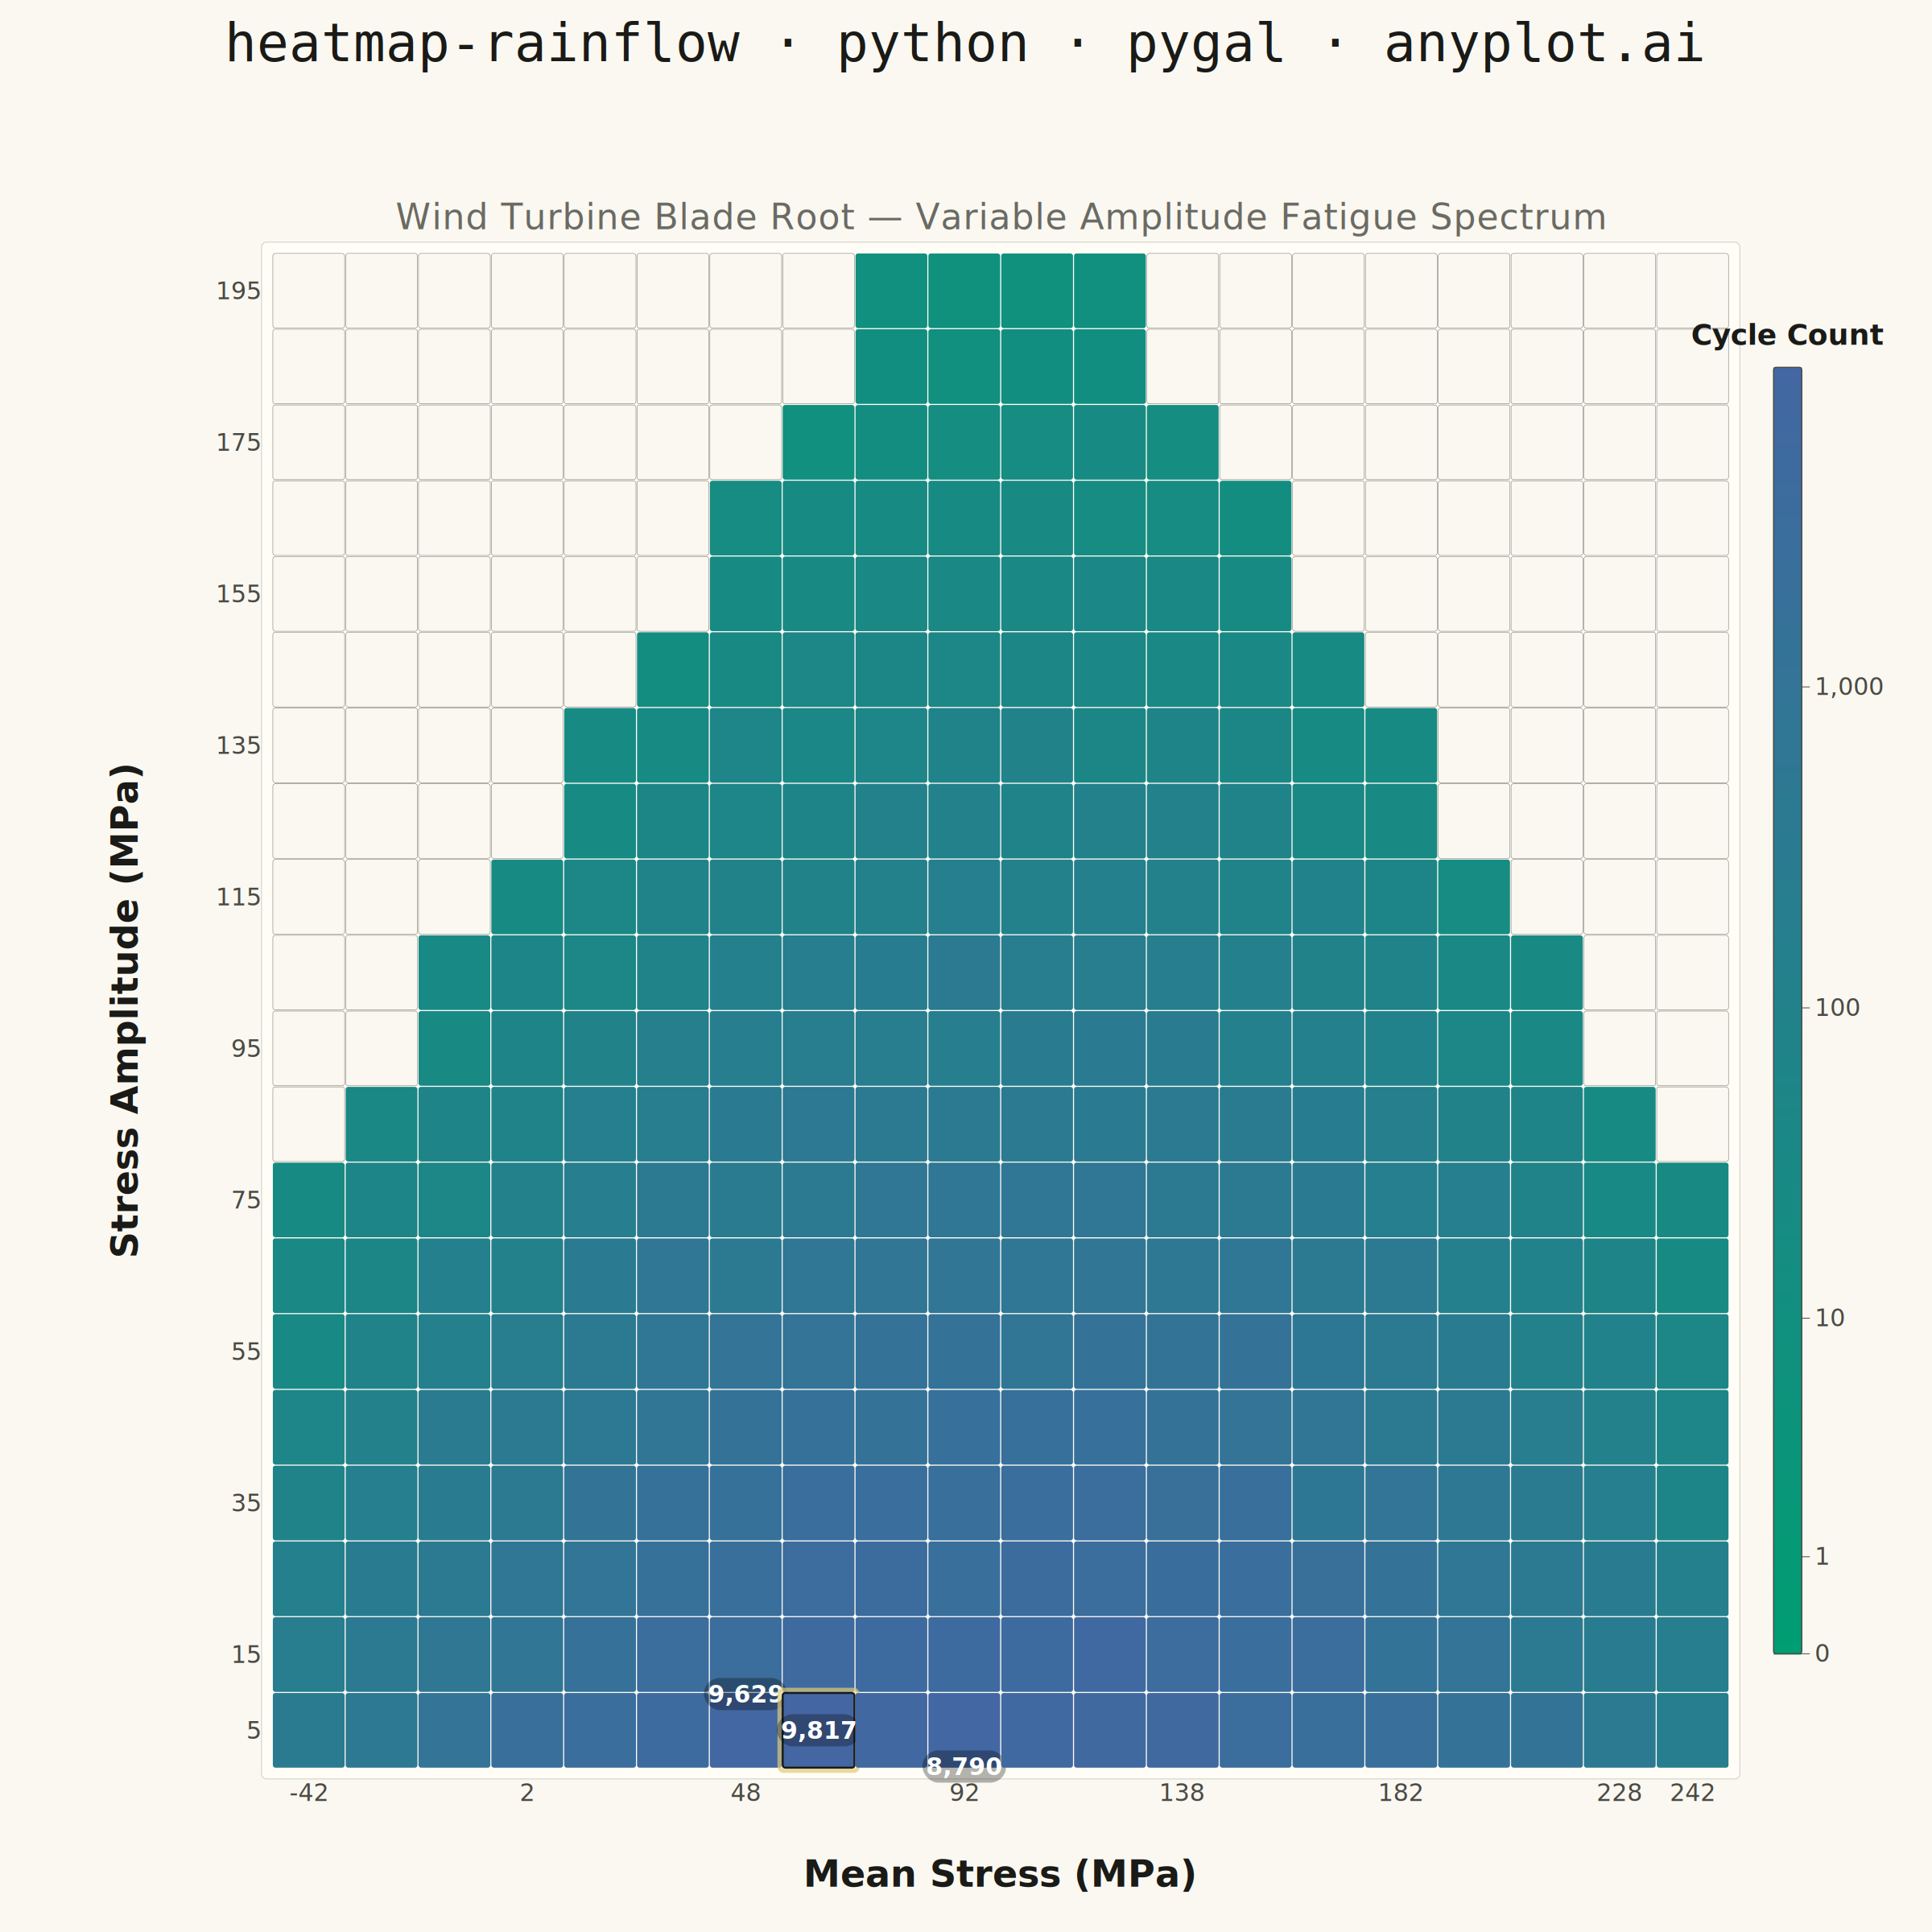
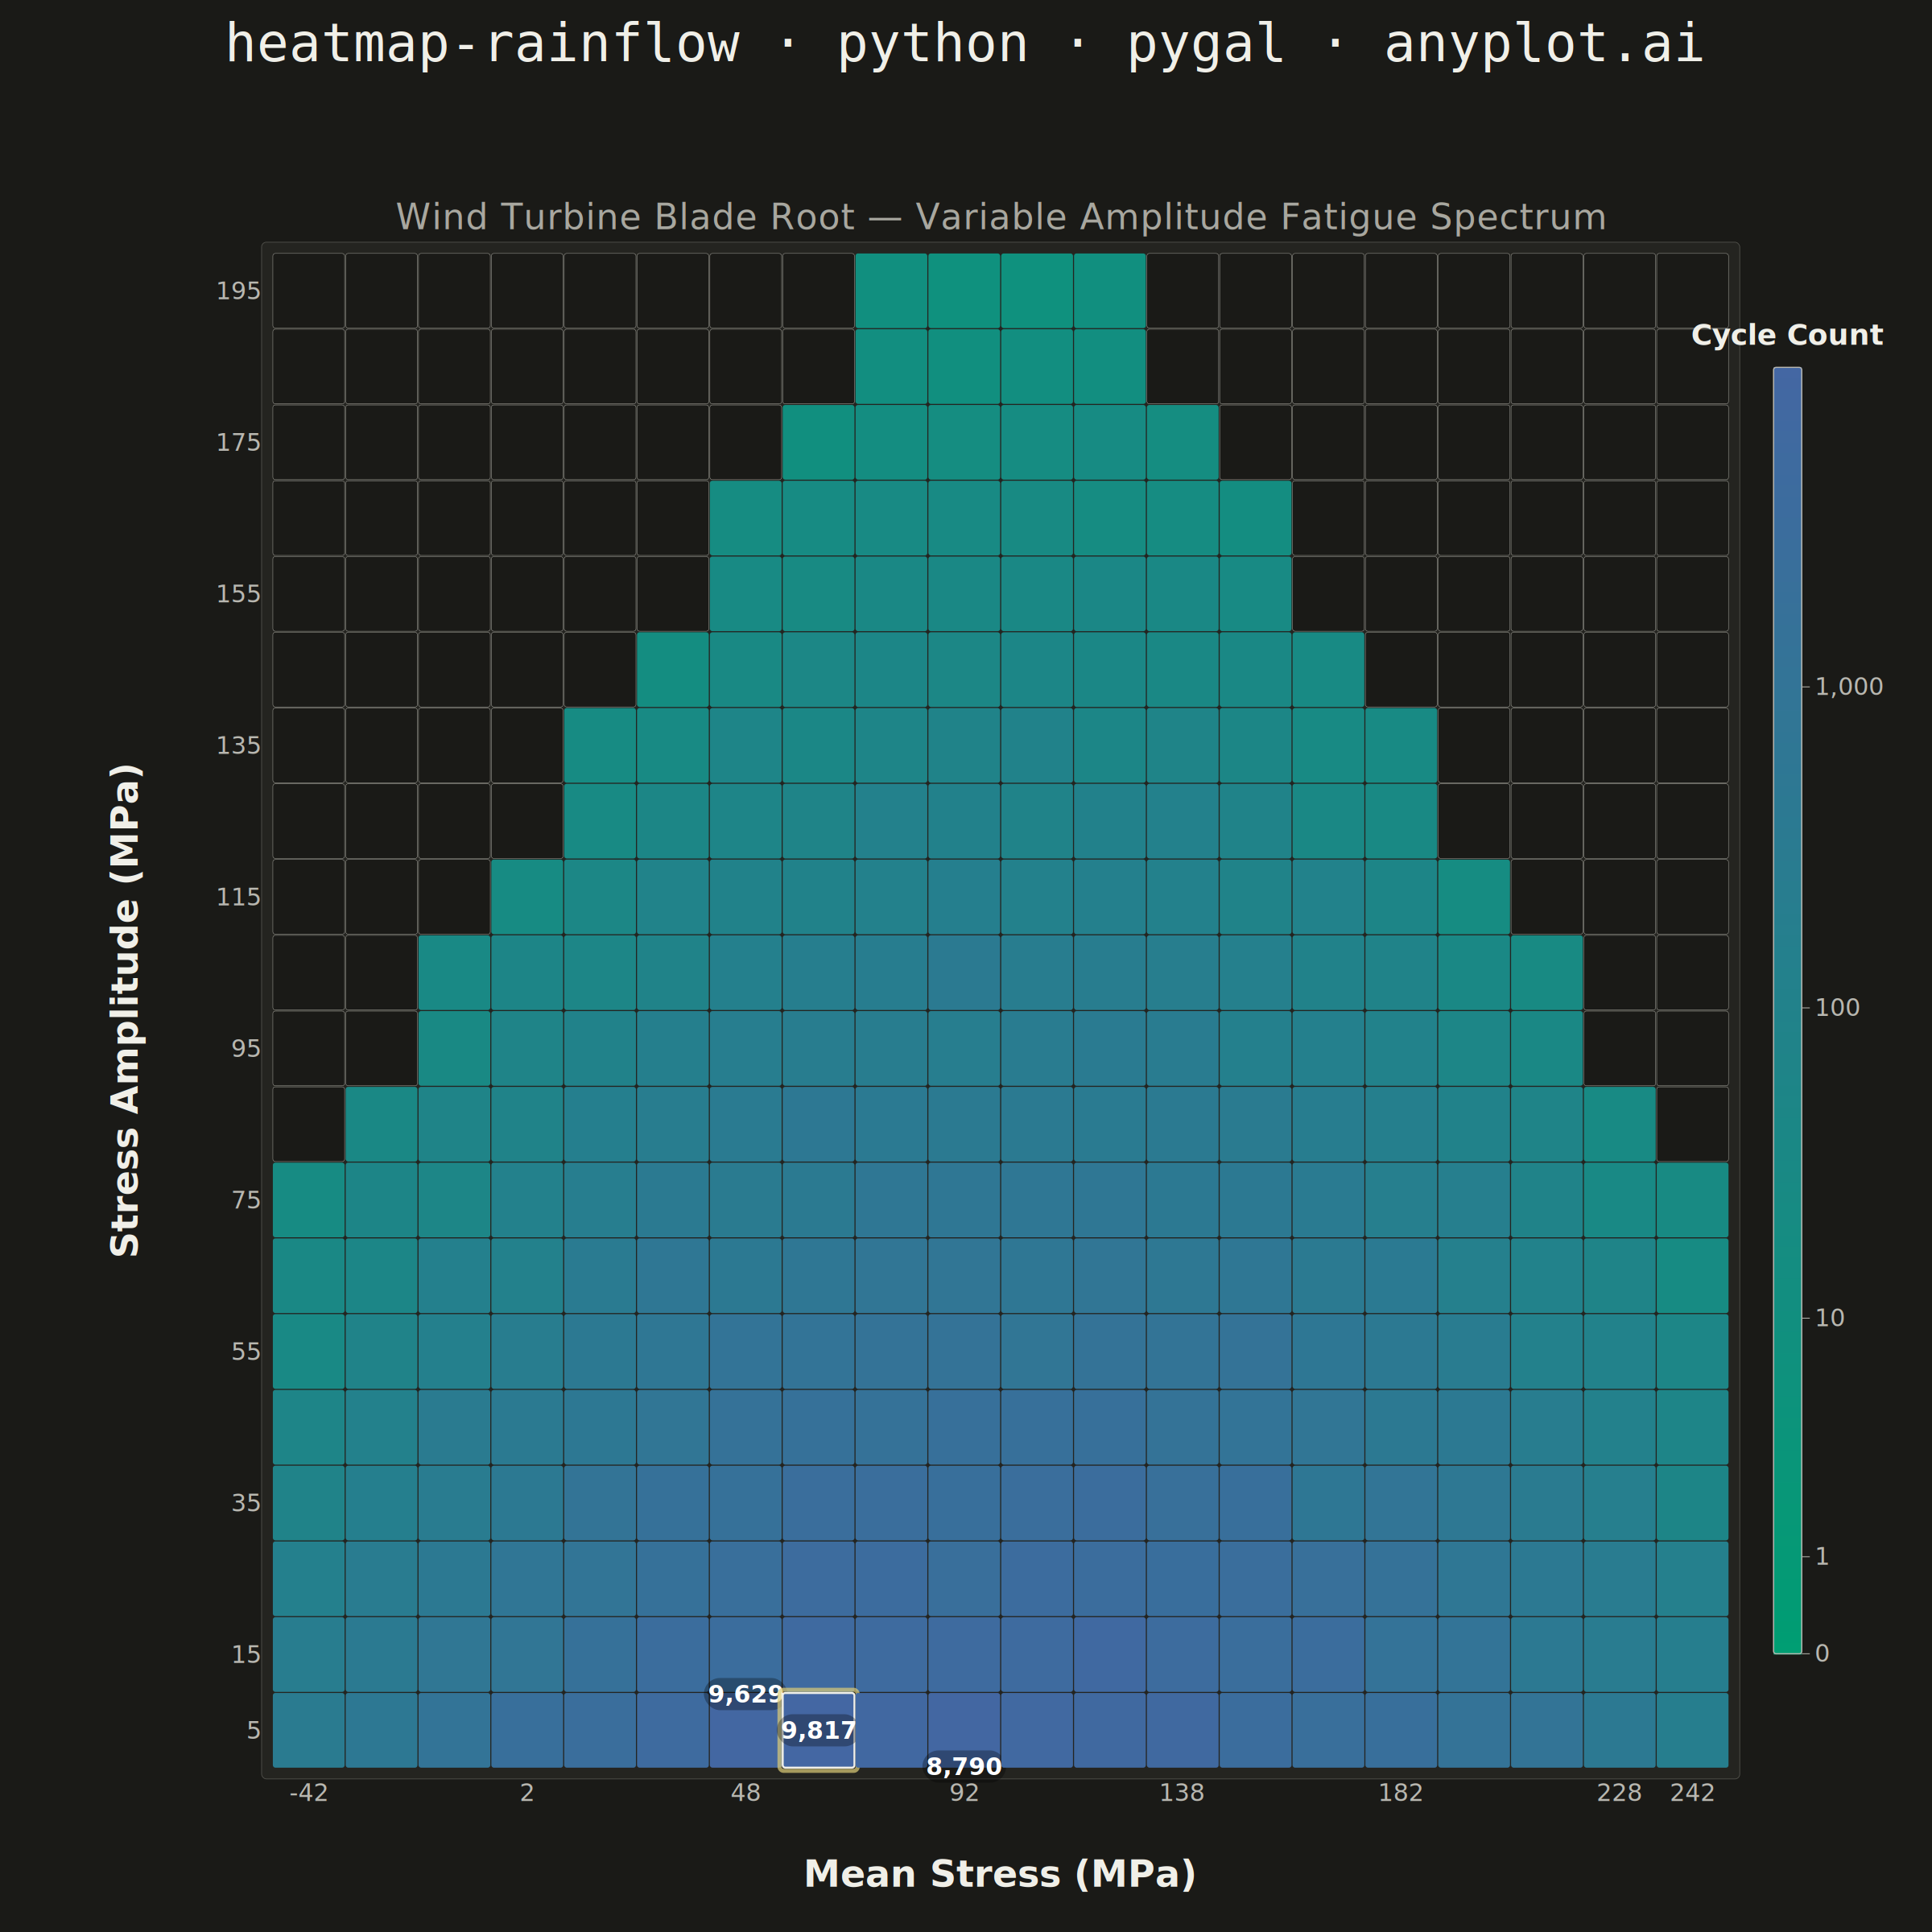
A rainflow counting matrix visualizes the results of rainflow cycle counting from a load or stress time history. The matrix displays cycle counts as a 2D heatmap where one axis represents cycle amplitude (half-range), the other represents cycle mean value, and color intensity represents the frequency of each cycle combination. This is a fundamental tool in fatigue analysis and durability engineering, used to characterize variable-amplitude loading for fatigue life prediction.
""" anyplot.ai
heatmap-rainflow: Rainflow Counting Matrix for Fatigue Analysis
Library: pygal 3.1.0 | Python 3.13.13
Quality: 88/100 | Updated: 2026-06-02
"""

import math
import os
import sys

import numpy as np


# Theme tokens — Imprint palette chrome
THEME = os.getenv("ANYPLOT_THEME", "light")
PAGE_BG = "#FAF8F1" if THEME == "light" else "#1A1A17"
ELEVATED_BG = "#FFFDF6" if THEME == "light" else "#242420"
INK = "#1A1A17" if THEME == "light" else "#F0EFE8"
INK_SOFT = "#4A4A44" if THEME == "light" else "#B8B7B0"
INK_MUTED = "#6B6A63" if THEME == "light" else "#A8A79F"

# Imprint sequential colormap: brand-green → blue (single-polarity continuous data)
N_CMAP = 16
IMPRINT_SEQ = [
    "#{:02X}{:02X}{:02X}".format(
        round(0x00 + (0x44 - 0x00) * i / (N_CMAP - 1)),
        round(0x9E + (0x67 - 0x9E) * i / (N_CMAP - 1)),
        round(0x73 + (0xA3 - 0x73) * i / (N_CMAP - 1)),
    )
    for i in range(N_CMAP)
]

# This file shares its name with the pygal package; temporarily remove the
# current directory from sys.path so the real package is found first.
sys.path, _saved_path = sys.path[1:], sys.path[0]
from pygal.graph.graph import Graph
from pygal.style import Style


sys.path.insert(0, _saved_path)


class RainflowHeatmap(Graph):
    def __init__(self, *args, **kwargs):
        self.matrix_data = kwargs.pop("matrix_data", [])
        self.row_labels = kwargs.pop("row_labels", [])
        self.col_labels = kwargs.pop("col_labels", [])
        self.colormap = kwargs.pop("colormap", [])
        self.vmax = kwargs.pop("vmax", 1)
        self.x_axis_title = kwargs.pop("x_axis_title", "")
        self.y_axis_title = kwargs.pop("y_axis_title", "")
        self.colorbar_title = kwargs.pop("colorbar_title", "")
        self.subtitle_text = kwargs.pop("subtitle_text", "")
        super().__init__(*args, **kwargs)

    def _plot(self):
        if not self.matrix_data:
            return

        cmap = self.colormap
        log_max = math.log10(self.vmax + 1)

        def color_at(t):
            t = max(0.0, min(1.0, t))
            pos = t * (len(cmap) - 1)
            lo = int(pos)
            hi = min(lo + 1, len(cmap) - 1)
            f = pos - lo
            c1, c2 = cmap[lo], cmap[hi]
            rgb = tuple(int(int(c1[k : k + 2], 16) * (1 - f) + int(c2[k : k + 2], 16) * f) for k in (1, 3, 5))
            return f"#{rgb[0]:02x}{rgb[1]:02x}{rgb[2]:02x}"

        def log_norm(value):
            if value <= 0:
                return -1.0
            return math.log10(value + 1) / log_max

        def svg_text(parent, x, y, label, size, **kw):
            node = self.svg.node(parent, "text", x=x, y=y)
            node.set("text-anchor", kw.get("anchor", "middle"))
            node.set("fill", kw.get("fill", INK))
            weight = "bold" if kw.get("bold") else "normal"
            if kw.get("weight"):
                weight = kw["weight"]
            style_str = f"font-size:{size}px;font-weight:{weight};font-family:sans-serif"
            if kw.get("letter_spacing"):
                style_str += f";letter-spacing:{kw['letter_spacing']}px"
            node.set("style", style_str)
            if "rotation" in kw:
                node.set("transform", f"rotate({kw['rotation']}, {x}, {y})")
            node.text = label

        nr = len(self.matrix_data)
        nc = len(self.matrix_data[0])
        pw, ph = self.view.width, self.view.height

        # Proportional margins within the view area
        ml = int(pw * 0.09)
        mr = int(pw * 0.09)
        mt = int(ph * 0.02)
        mb = int(ph * 0.08)

        aw, ah = pw - ml - mr, ph - mt - mb
        cw = aw / nc * 0.97
        ch = ah / nr * 0.97
        gap = min(cw, ch) * 0.015
        gw = nc * (cw + gap) - gap
        gh = nr * (ch + gap) - gap

        x0 = self.view.x(0) + ml + (aw - gw) / 2
        y0 = self.view.y(nr) + mt + (ah - gh) / 2

        g = self.svg.node(self.nodes["plot"], class_="heatmap")

        # Subtitle sits in the margin_top gap between pygal title and grid
        if self.subtitle_text:
            svg_text(
                g,
                pw / 2 + self.view.x(0),
                y0 - 30,
                self.subtitle_text,
                44,
                fill=INK_MUTED,
                weight="300",
                letter_spacing=1,
            )

        # Elevated background panel behind heatmap grid
        pad = 14
        panel = self.svg.node(g, "rect", x=x0 - pad, y=y0 - pad, width=gw + 2 * pad, height=gh + 2 * pad, rx=6, ry=6)
        panel.set("fill", ELEVATED_BG)
        panel.set("stroke", INK_MUTED)
        panel.set("stroke-width", "0.8")
        panel.set("stroke-opacity", "0.4")

        # Y-axis title (rotated 90°)
        if self.y_axis_title:
            svg_text(g, x0 - int(pw * 0.075), y0 + gh / 2, self.y_axis_title, 46, bold=True, fill=INK, rotation=-90)

        # Row labels — every other to prevent crowding
        rf = min(30, int(ch * 0.5))
        for i, lbl in enumerate(self.row_labels):
            if i % 2 == 0 or i == nr - 1:
                svg_text(g, x0 - 16, y0 + i * (ch + gap) + ch / 2 + rf * 0.35, lbl, rf, anchor="end", fill=INK_SOFT)

        # Column labels — every 3rd for clean spacing
        cf = min(30, int(cw * 0.45))
        for j, lbl in enumerate(self.col_labels):
            if j % 3 == 0 or j == nc - 1:
                x = x0 + j * (cw + gap) + cw / 2
                y = y0 + gh + gap + cf + 10
                svg_text(g, x, y, lbl, cf, fill=INK_SOFT)

        # X-axis title
        if self.x_axis_title:
            svg_text(g, x0 + gw / 2, y0 + gh + int(ph * 0.07), self.x_axis_title, 46, bold=True, fill=INK)

        # Top 3 peak cells for emphasis and annotation
        cell_values = [
            (self.matrix_data[i][j], i, j) for i in range(nr) for j in range(nc) if self.matrix_data[i][j] > 0
        ]
        cell_values.sort(reverse=True)
        top_peaks = {(i, j) for _, i, j in cell_values[:3]}
        peak_cell = (cell_values[0][1], cell_values[0][2]) if cell_values else None

        # Stagger pill vertical positions to prevent overlap when peaks share a row
        _row_peak_cols: dict = {}
        for _pi, _pj in top_peaks:
            _row_peak_cols.setdefault(_pi, []).append(_pj)
        _pill_v_off: dict = {}
        _sv = 45.0  # stagger amount in SVG px
        for _ri, _cs in _row_peak_cols.items():
            _sorted = sorted(_cs)
            _n = len(_sorted)
            if _n == 1:
                _pill_v_off[(_ri, _sorted[0])] = 0.0
            elif _n == 2:
                _pill_v_off[(_ri, _sorted[0])] = -_sv
                _pill_v_off[(_ri, _sorted[1])] = _sv
            else:
                _pill_v_off[(_ri, _sorted[0])] = -_sv
                _pill_v_off[(_ri, _sorted[1])] = 0.0
                _pill_v_off[(_ri, _sorted[2])] = _sv

        # Draw heatmap cells
        for i in range(nr):
            for j in range(nc):
                val = self.matrix_data[i][j]
                cx = x0 + j * (cw + gap)
                cy = y0 + i * (ch + gap)
                norm = log_norm(val)

                fill = PAGE_BG if norm < 0 else color_at(norm)
                stroke = INK_MUTED if norm < 0 else "none"
                sw = "0.5"

                # Amber glow halo on absolute peak cell — Imprint amber (#DDCC77)
                if (i, j) == peak_cell:
                    glow = self.svg.node(g, "rect", x=cx - 4, y=cy - 4, width=cw + 8, height=ch + 8, rx=5, ry=5)
                    glow.set("fill", "none")
                    glow.set("stroke", "#DDCC77")
                    glow.set("stroke-width", "5")
                    glow.set("opacity", "0.7")
                    stroke = INK
                    sw = "2.5"

                rect = self.svg.node(g, "rect", x=cx, y=cy, width=cw, height=ch, rx=3, ry=3)
                rect.set("fill", fill)
                rect.set("stroke", stroke)
                rect.set("stroke-width", sw)

                # Annotate top 3 peaks with a background pill for legibility
                if (i, j) in top_peaks:
                    v_off = _pill_v_off.get((i, j), 0.0)
                    txt = f"{int(val):,}"
                    sz = min(int(ch * 0.36), 30)
                    ink_color = "#ffffff" if norm > 0.45 else INK

                    pill_w = len(txt) * sz * 0.6 + 14
                    pill_h = sz + 10
                    pill_cx = cx + cw / 2
                    pill_cy = cy + ch / 2 + v_off
                    pill = self.svg.node(
                        g,
                        "rect",
                        x=pill_cx - pill_w / 2,
                        y=pill_cy - pill_h / 2,
                        width=pill_w,
                        height=pill_h,
                        rx=pill_h / 2,
                        ry=pill_h / 2,
                    )
                    pill.set("fill", "#000000" if norm > 0.45 else PAGE_BG)
                    pill.set("fill-opacity", "0.3" if norm > 0.45 else "0.75")

                    svg_text(g, pill_cx, pill_cy + sz * 0.35, txt, sz, fill=ink_color, bold=True)

        # Smooth gradient colorbar (120-segment approximation)
        cb_w = int(pw * 0.016)
        cb_h = int(gh * 0.85)
        cb_x = x0 + gw + int(pw * 0.025)
        cb_y = y0 + (gh - cb_h) / 2
        n_seg = 120
        seg_h = cb_h / n_seg

        for si in range(n_seg):
            t = 1 - si / (n_seg - 1)
            self.svg.node(g, "rect", x=cb_x, y=cb_y + si * seg_h, width=cb_w, height=seg_h + 1, fill=color_at(t))

        # Colorbar border
        border = self.svg.node(g, "rect", x=cb_x, y=cb_y, width=cb_w, height=cb_h, rx=3, ry=3)
        border.set("fill", "none")
        border.set("stroke", INK_SOFT)
        border.set("stroke-width", "1.5")

        # Colorbar ticks (log scale: 0, 1, 10, 100, 1000, ...)
        max_pow = int(math.log10(self.vmax)) if self.vmax > 0 else 0
        for tv in [0] + [10**p for p in range(max_pow + 1)]:
            t = 0 if tv == 0 else math.log10(tv + 1) / log_max
            ty = cb_y + cb_h * (1 - t)
            self.svg.node(g, "line", x1=cb_x + cb_w, y1=ty, x2=cb_x + cb_w + 10, y2=ty, stroke=INK_SOFT)
            label = f"{int(tv):,}" if tv >= 1000 else str(int(tv))
            svg_text(g, cb_x + cb_w + 16, ty + 10, label, 30, anchor="start", fill=INK_SOFT)

        # Colorbar title
        if self.colorbar_title:
            svg_text(g, cb_x + cb_w / 2, cb_y - 28, self.colorbar_title, 36, bold=True, fill=INK)

    def _compute(self):
        nr = len(self.matrix_data) if self.matrix_data else 1
        nc = len(self.matrix_data[0]) if self.matrix_data and self.matrix_data[0] else 1
        self._box.xmin, self._box.xmax = 0, nc
        self._box.ymin, self._box.ymax = 0, nr


# Data: wind turbine blade root fatigue loading (variable-amplitude spectrum)
np.random.seed(42)

n_amp_bins = 20
n_mean_bins = 20

amp_edges = np.linspace(0, 200, n_amp_bins + 1)
mean_edges = np.linspace(-50, 250, n_mean_bins + 1)
amp_centers = (amp_edges[:-1] + amp_edges[1:]) / 2
mean_centers = (mean_edges[:-1] + mean_edges[1:]) / 2

counts = np.zeros((n_amp_bins, n_mean_bins))
for i in range(n_amp_bins):
    for j in range(n_mean_bins):
        amp, mean_val = amp_centers[i], mean_centers[j]
        primary = np.exp(-amp / 28) * np.exp(-((mean_val - 100) ** 2) / (2 * 55**2))
        vibration = 0.5 * np.exp(-amp / 10) * np.exp(-((mean_val - 55) ** 2) / (2 * 20**2))
        base = 9000 * (primary + vibration) * (1 + 0.2 * np.random.randn())
        if amp + abs(mean_val - 100) > 220 or base < 2:
            counts[i][j] = 0
        else:
            counts[i][j] = int(round(max(0, base)))

# Flip so high amplitude is at top (fatigue matrix y-axis convention)
matrix = counts[::-1].tolist()
vmax = int(np.max(counts))

# Imprint palette for Style — first series is brand green
IMPRINT_PALETTE = ("#009E73", "#C475FD", "#4467A3", "#BD8233", "#AE3030", "#2ABCCD", "#954477", "#99B314")

custom_style = Style(
    background=PAGE_BG,
    plot_background=PAGE_BG,
    foreground=INK,
    foreground_strong=INK,
    foreground_subtle=INK_MUTED,
    colors=IMPRINT_PALETTE,
    title_font_size=66,
    label_font_size=56,
    major_label_font_size=44,
    legend_font_size=44,
    value_font_size=36,
    stroke_width=2.5,
)

chart = RainflowHeatmap(
    width=2400,
    height=2400,
    style=custom_style,
    title="heatmap-rainflow · python · pygal · anyplot.ai",
    subtitle_text="Wind Turbine Blade Root — Variable Amplitude Fatigue Spectrum",
    matrix_data=matrix,
    row_labels=[f"{v:.0f}" for v in amp_centers[::-1]],
    col_labels=[f"{v:.0f}" for v in mean_centers],
    colormap=IMPRINT_SEQ,
    vmax=vmax,
    show_legend=False,
    margin=80,
    margin_top=140,
    margin_bottom=60,
    show_x_labels=False,
    show_y_labels=False,
    x_axis_title="Mean Stress (MPa)",
    y_axis_title="Stress Amplitude (MPa)",
    colorbar_title="Cycle Count",
    explicit_size=True,
    pretty_print=True,
)

# Pygal requires at least one series to trigger the rendering pipeline
chart.add("", [0])

chart.render_to_png(f"plot-{THEME}.png")

# Interactive HTML export — leverages pygal's distinctive SVG/JS output
html_content = f"""<!DOCTYPE html>
<html>
<head>
    <meta charset="utf-8">
    <title>heatmap-rainflow · python · pygal · anyplot.ai</title>
    <style>
        body {{ margin: 0; display: flex; justify-content: center;
               align-items: center; min-height: 100vh; background: {PAGE_BG}; }}
        .chart {{ max-width: 100%; height: auto; }}
    </style>
</head>
<body>
    <figure class="chart">{chart.render(is_unicode=True)}</figure>
</body>
</html>"""

with open(f"plot-{THEME}.html", "w", encoding="utf-8") as f:
    f.write(html_content)
Runnable source as JSON, for any HTTP client: https://api.anyplot.ai/specs/heatmap-rainflow/pygal/code. Any spec id and library id listed in llms-full.txt fit the same URL shape; every URL below is complete and callable.
{
  "spec_id": "heatmap-rainflow",
  "language": "python",
  "library": "pygal",
  "page": "https://anyplot.ai/heatmap-rainflow/python/pygal",
  "hub": "https://anyplot.ai/heatmap-rainflow",
  "code_json": "https://api.anyplot.ai/specs/heatmap-rainflow/pygal/code",
  "spec_json": "https://api.anyplot.ai/specs/heatmap-rainflow",
  "render_light_png": "https://storage.googleapis.com/anyplot-images/plots/heatmap-rainflow/python/pygal/plot-light.png",
  "render_dark_png": "https://storage.googleapis.com/anyplot-images/plots/heatmap-rainflow/python/pygal/plot-dark.png",
  "interactive_light_html": "https://storage.googleapis.com/anyplot-images/plots/heatmap-rainflow/python/pygal/plot-light.html",
  "interactive_dark_html": "https://storage.googleapis.com/anyplot-images/plots/heatmap-rainflow/python/pygal/plot-dark.html",
  "quality_score": 88.0,
  "license": "MIT",
  "guide": "https://anyplot.ai/llms.txt"
}
Part of Rainflow Counting Matrix for Fatigue Analysis on anyplot.ai.