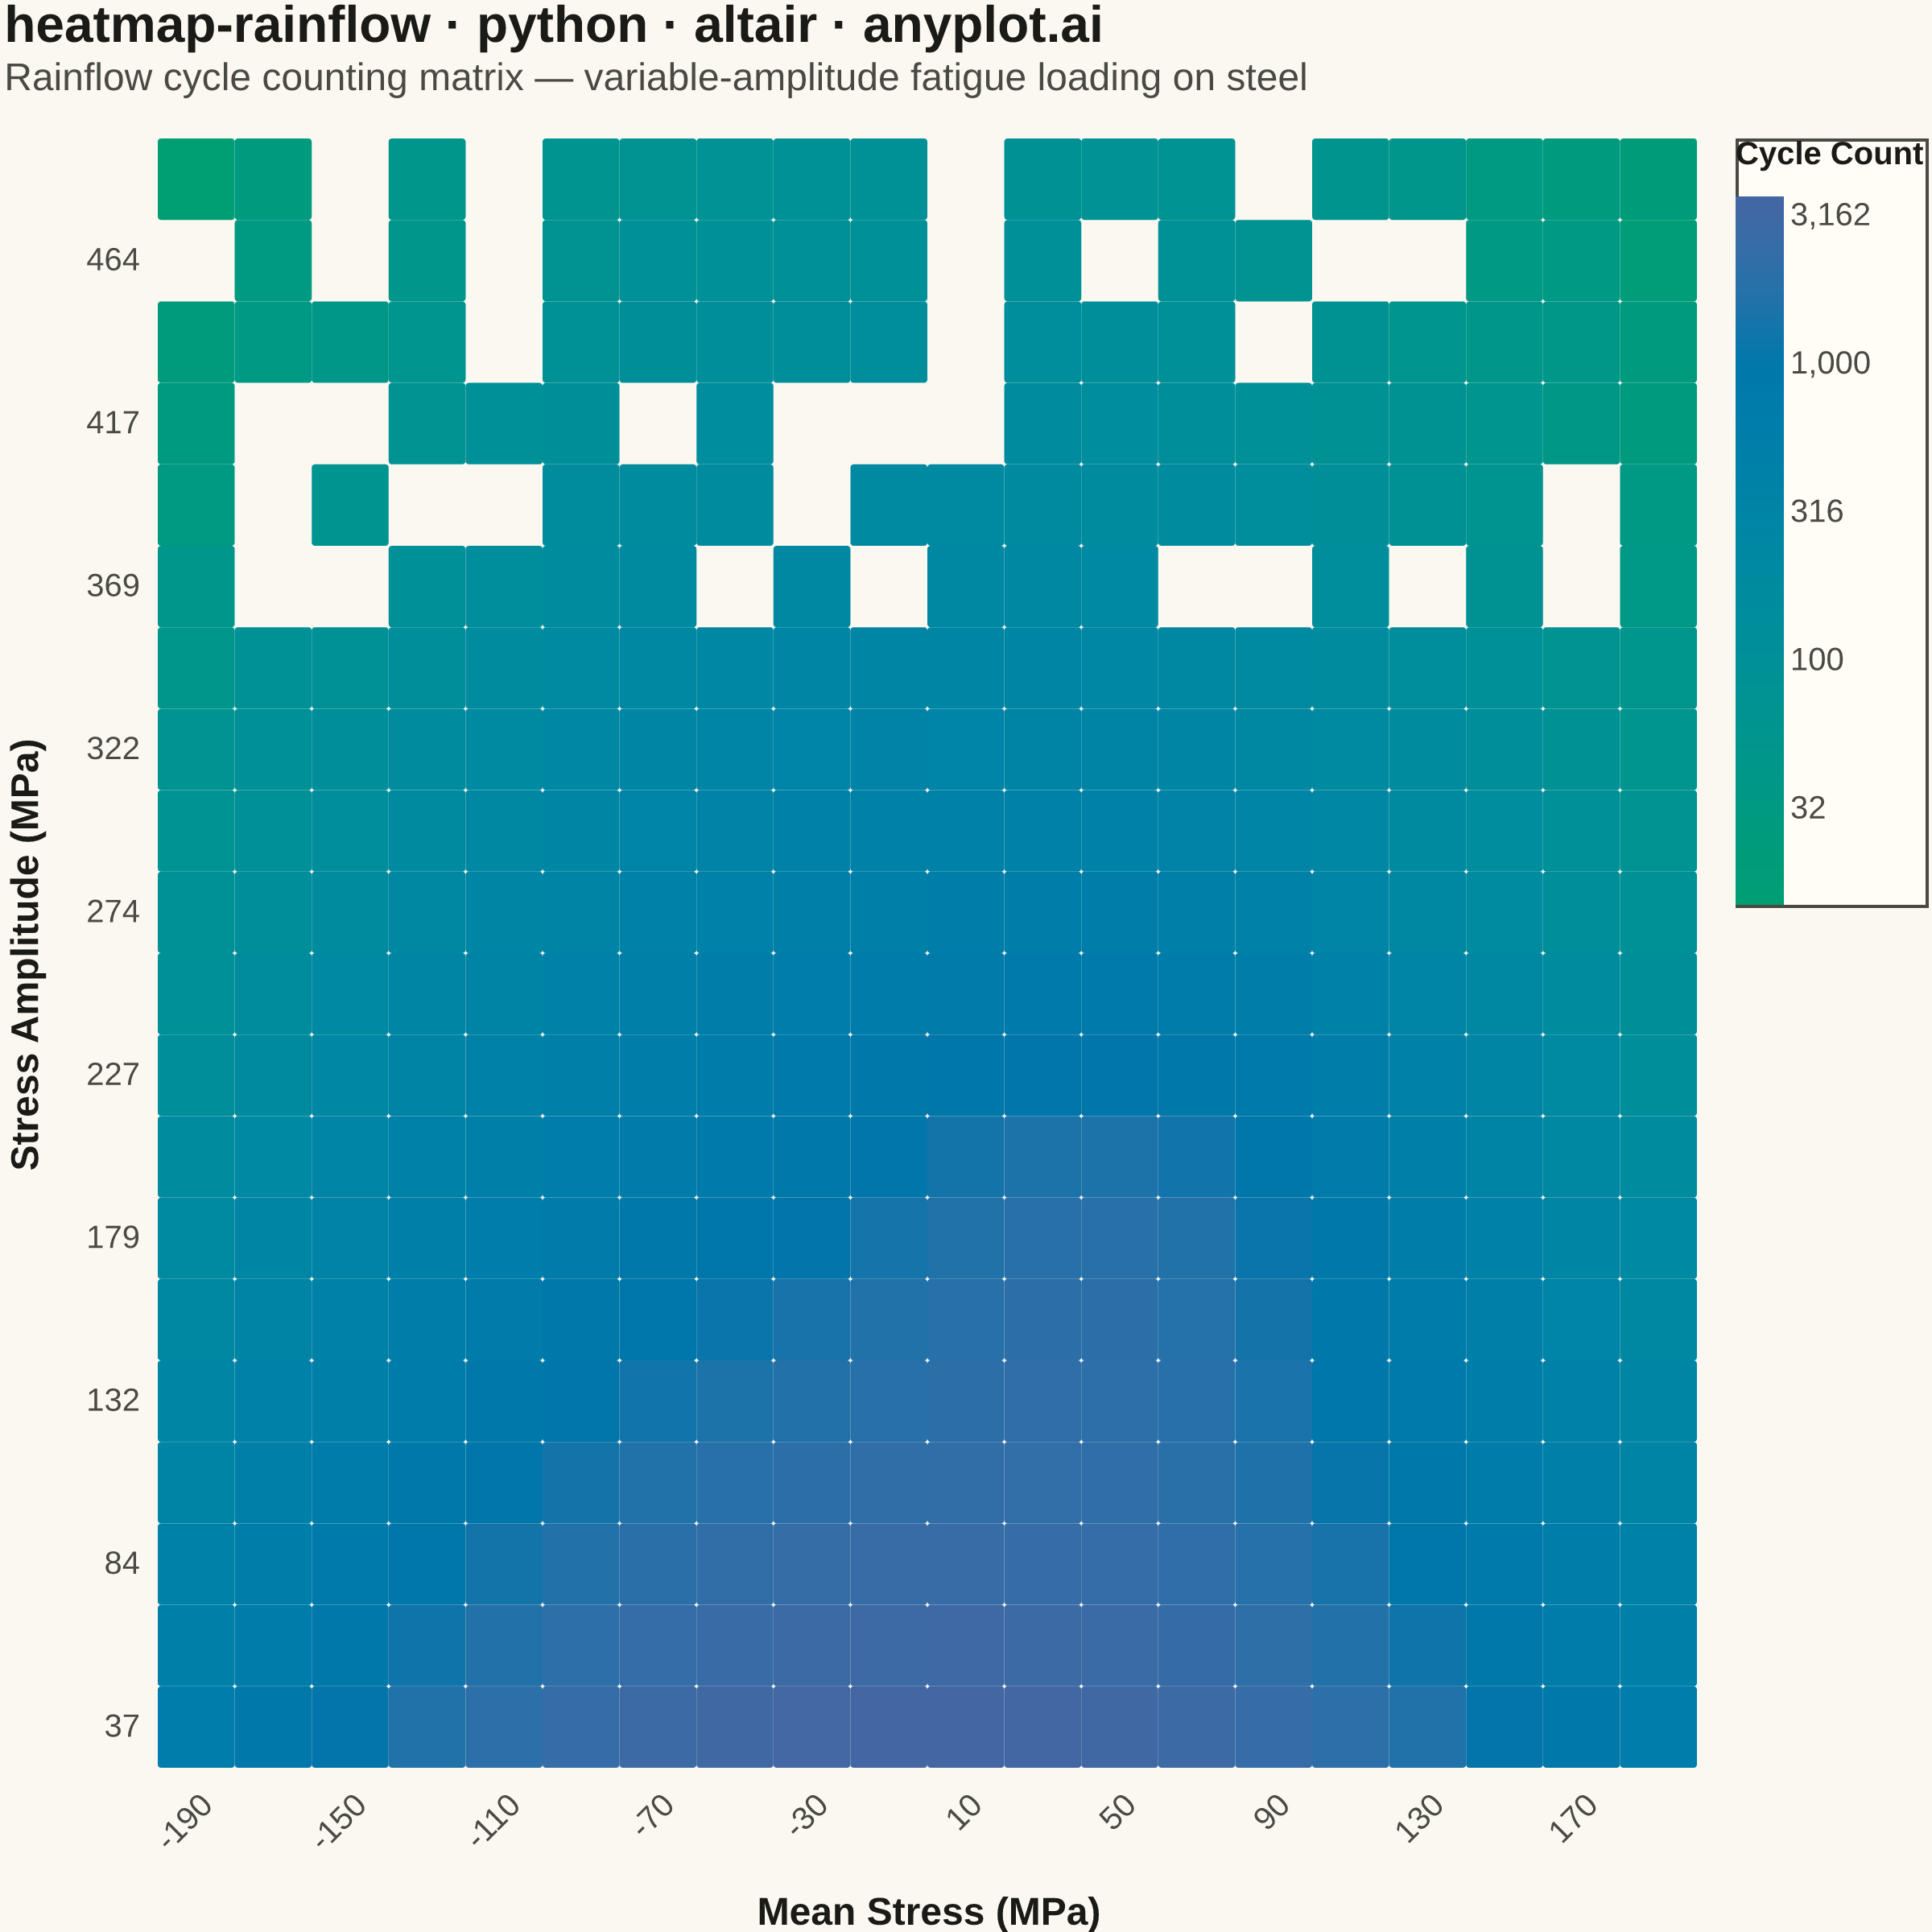
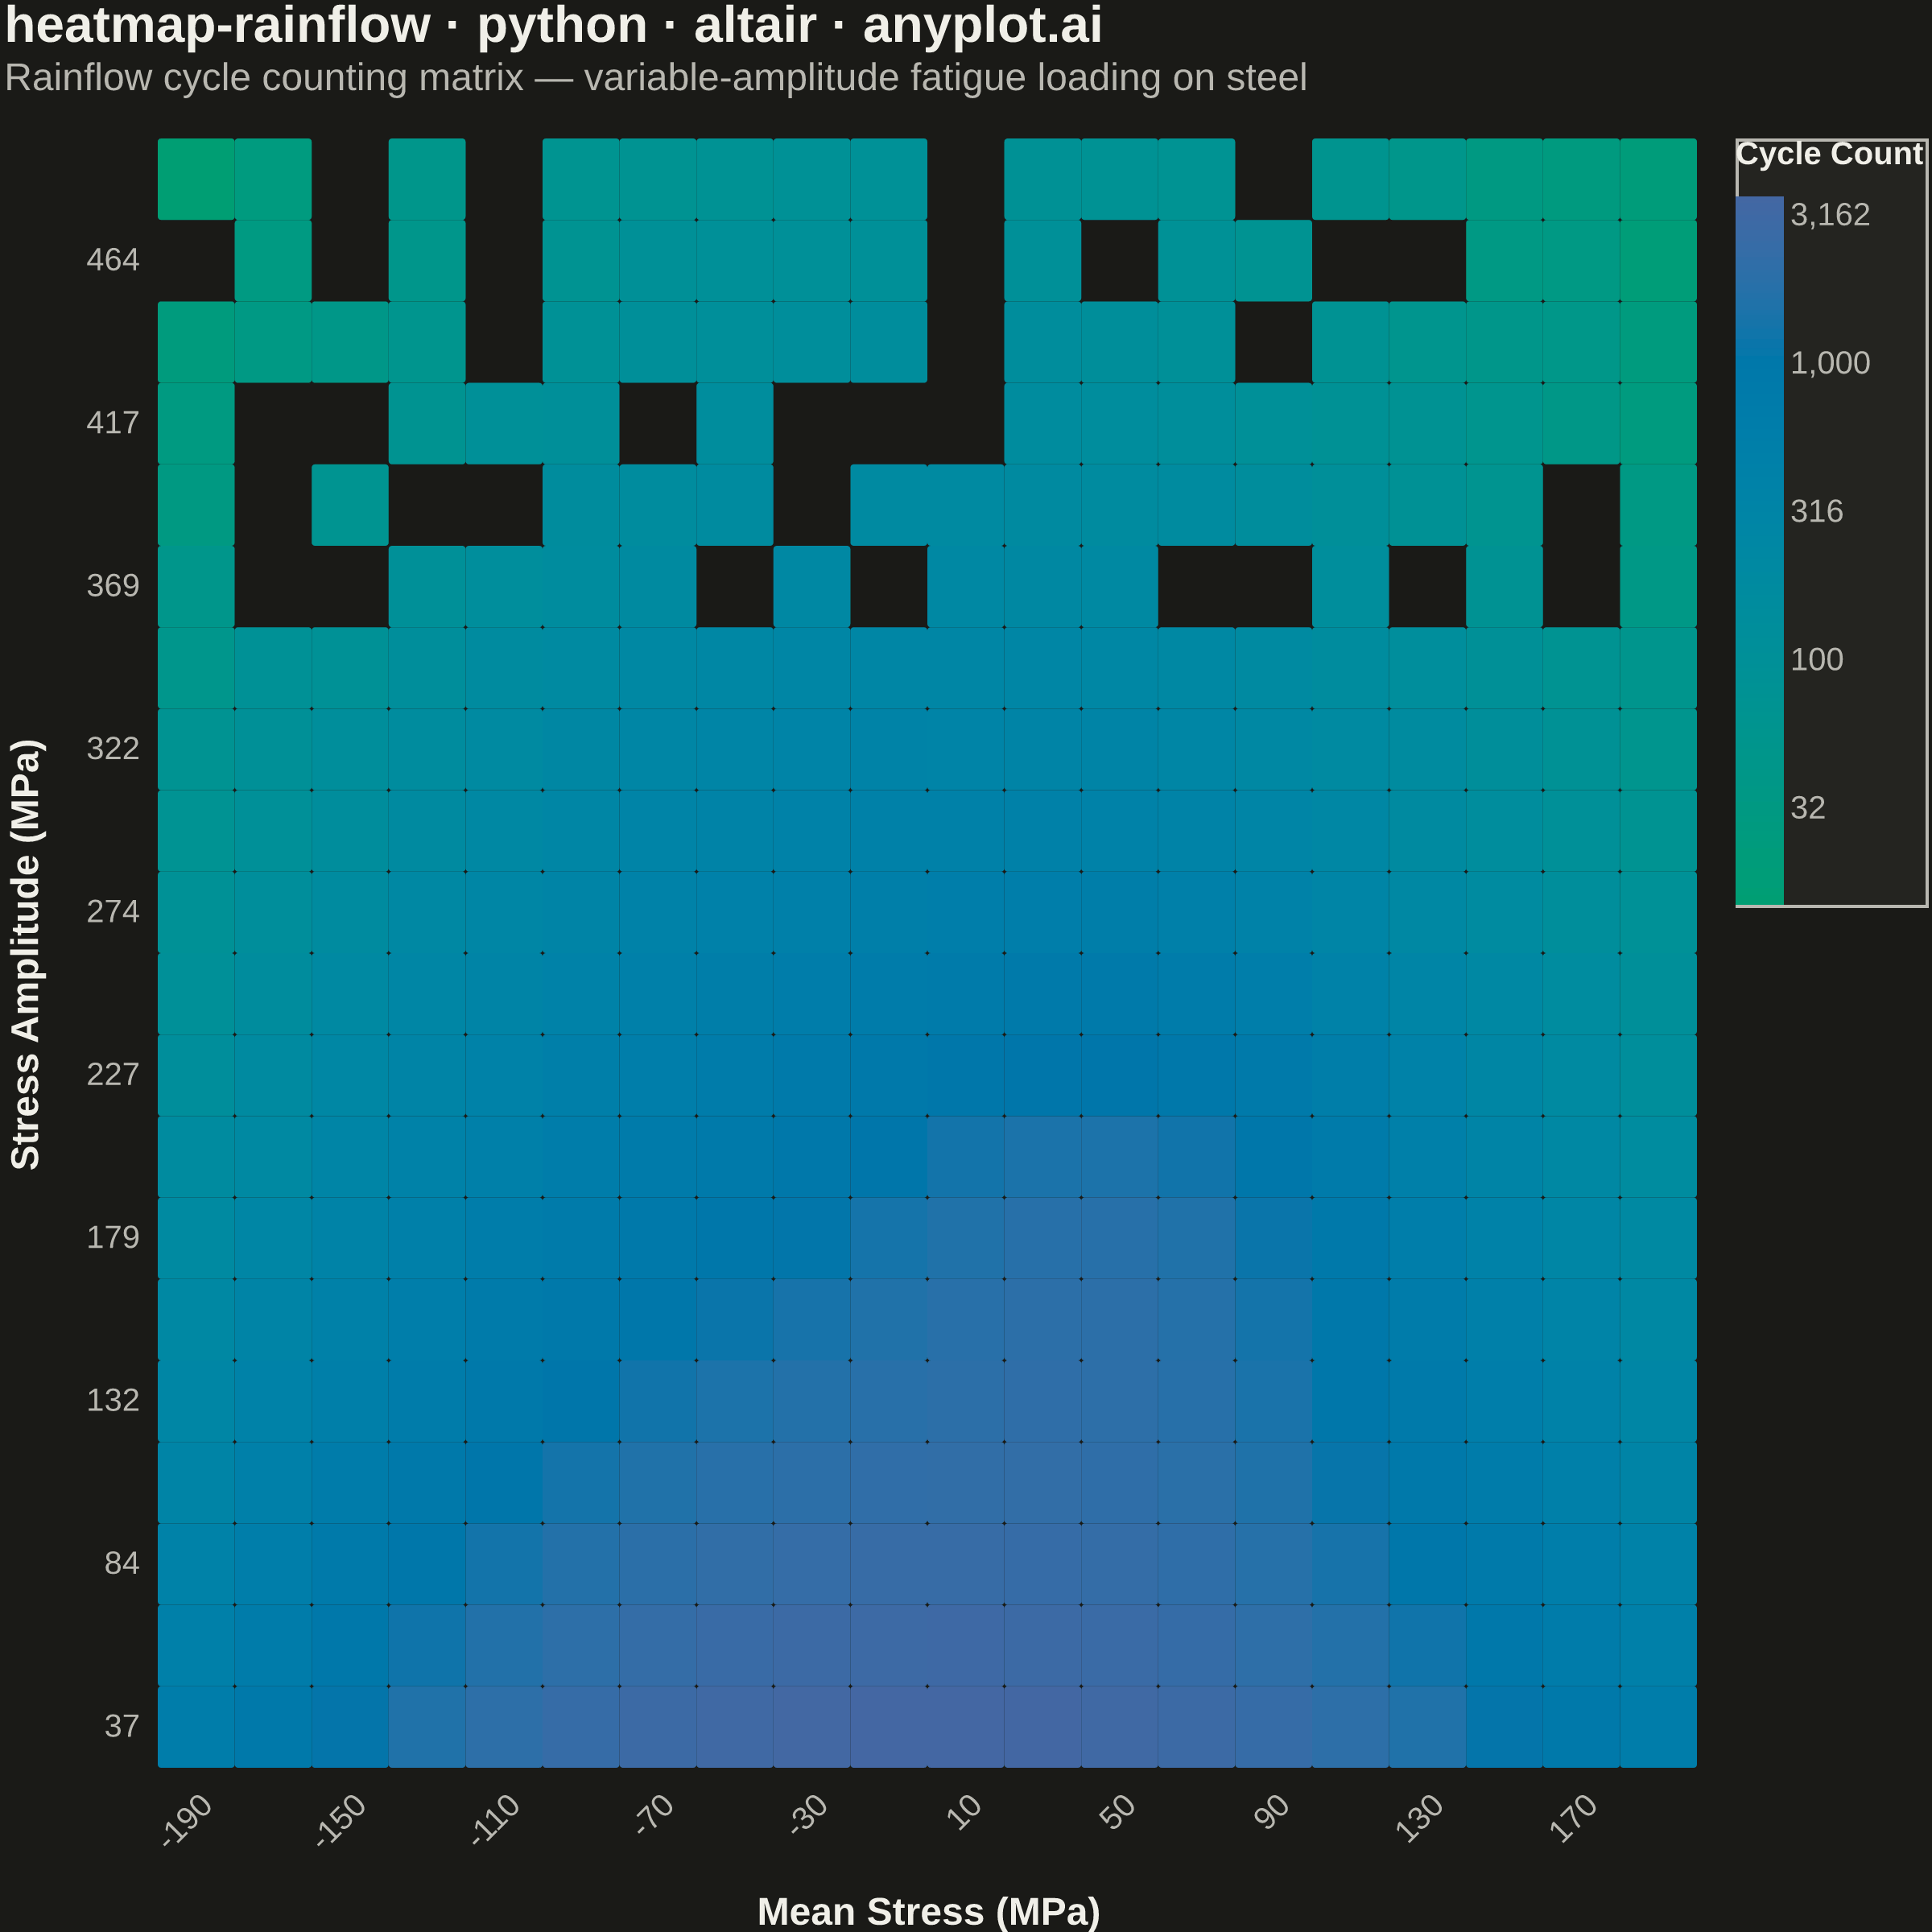
A rainflow counting matrix visualizes the results of rainflow cycle counting from a load or stress time history. The matrix displays cycle counts as a 2D heatmap where one axis represents cycle amplitude (half-range), the other represents cycle mean value, and color intensity represents the frequency of each cycle combination. This is a fundamental tool in fatigue analysis and durability engineering, used to characterize variable-amplitude loading for fatigue life prediction.
""" anyplot.ai
heatmap-rainflow: Rainflow Counting Matrix for Fatigue Analysis
Library: altair 6.1.0 | Python 3.13.13
Quality: 90/100 | Updated: 2026-06-02
"""

import os

import altair as alt
import numpy as np
import pandas as pd
from PIL import Image


# Theme tokens (see prompts/default-style-guide.md "Theme-adaptive Chrome")
THEME = os.getenv("ANYPLOT_THEME", "light")
PAGE_BG = "#FAF8F1" if THEME == "light" else "#1A1A17"
ELEVATED_BG = "#FFFDF6" if THEME == "light" else "#242420"
INK = "#1A1A17" if THEME == "light" else "#F0EFE8"
INK_SOFT = "#4A4A44" if THEME == "light" else "#B8B7B0"

# Imprint sequential colormap — single-polarity continuous data (cycle counts)
IMPRINT_SEQ = ["#009E73", "#4467A3"]

# Data — synthetic rainflow counting matrix for a steel component under variable-amplitude loading
np.random.seed(42)

n_amp_bins = 20
n_mean_bins = 20
amplitude_edges = np.linspace(25, 500, n_amp_bins + 1)
mean_edges = np.linspace(-200, 200, n_mean_bins + 1)
amplitude_centers = (amplitude_edges[:-1] + amplitude_edges[1:]) / 2
mean_centers = (mean_edges[:-1] + mean_edges[1:]) / 2

# Build count matrix: low amplitude cycles dominate, counts decay with amplitude
amp_grid, mean_grid = np.meshgrid(amplitude_centers, mean_centers, indexing="ij")

# Base distribution: exponential decay in amplitude, Gaussian in mean
base_counts = 5000 * np.exp(-amp_grid / 120) * np.exp(-0.5 * (mean_grid / 100) ** 2)

# Secondary cluster at moderate amplitude / slight positive mean (dominant load cycle)
cluster = 800 * np.exp(-0.5 * ((amp_grid - 175) / 50) ** 2 - 0.5 * ((mean_grid - 50) / 40) ** 2)
raw_counts = base_counts + cluster

# Add noise and round to integers
raw_counts += np.random.exponential(scale=5, size=raw_counts.shape)
cycle_counts = np.round(raw_counts).astype(int)
cycle_counts = np.clip(cycle_counts, 0, None)

# Sparsify high-amplitude region (fewer cycles at high stress range)
mask = np.random.rand(*cycle_counts.shape) < 0.3
cycle_counts[(amp_grid > 350) & mask] = 0

# Convert to long-form DataFrame (drop zero-count bins — PAGE_BG shows through as zero indicator)
rows = []
for i, amp in enumerate(amplitude_centers):
    for j, mean_val in enumerate(mean_centers):
        count = int(cycle_counts[i, j])
        if count > 0:
            rows.append(
                {
                    "Amplitude (MPa)": int(round(amp)),
                    "Mean Stress (MPa)": int(round(mean_val)),
                    "Cycle Count": count,
                    "Log Count": float(np.log10(max(count, 1))),
                }
            )

df = pd.DataFrame(rows)

# Sorted tick values for axes (every other bin center to avoid crowding)
amp_sorted = sorted(df["Amplitude (MPa)"].unique().tolist())
mean_sorted = sorted(df["Mean Stress (MPa)"].unique().tolist())

# Plot — rainflow heatmap with Imprint sequential colormap, log-scaled color
title = "heatmap-rainflow · python · altair · anyplot.ai"

heatmap = (
    alt.Chart(df)
    .mark_rect(cornerRadius=1)
    .encode(
        x=alt.X(
            "Mean Stress (MPa):O",
            title="Mean Stress (MPa)",
            sort=mean_sorted,
            axis=alt.Axis(labelAngle=-45, labelPadding=6, titlePadding=12, values=mean_sorted[::2]),
        ),
        y=alt.Y(
            "Amplitude (MPa):O",
            title="Stress Amplitude (MPa)",
            sort=sorted(amp_sorted, reverse=True),
            axis=alt.Axis(labelPadding=6, titlePadding=12, values=amp_sorted[::2]),
        ),
        color=alt.Color(
            "Log Count:Q",
            scale=alt.Scale(range=IMPRINT_SEQ),
            legend=alt.Legend(
                title="Cycle Count",
                titleFontSize=10,
                labelFontSize=10,
                gradientLength=220,
                gradientThickness=15,
                orient="right",
                titlePadding=8,
                offset=12,
                labelExpr=(
                    "pow(10, datum.value) < 10 ? "
                    "format(pow(10, datum.value), '.0f') : "
                    "format(pow(10, datum.value), ',.0f')"
                ),
            ),
        ),
        tooltip=[
            alt.Tooltip("Amplitude (MPa):O", title="Amplitude"),
            alt.Tooltip("Mean Stress (MPa):O", title="Mean Stress"),
            alt.Tooltip("Cycle Count:Q", title="Cycles", format=","),
        ],
    )
)

# Style and layout — square canvas: inner view 500×460, scale_factor=4.0 → pads to 2400×2400
chart = (
    heatmap.properties(
        width=478,
        height=506,
        background=PAGE_BG,
        title=alt.Title(
            title,
            subtitle="Rainflow cycle counting matrix — variable-amplitude fatigue loading on steel",
            fontSize=16,
            subtitleFontSize=12,
            color=INK,
            subtitleColor=INK_SOFT,
            anchor="start",
            offset=12,
        ),
        padding={"left": 0, "right": 0, "top": 0, "bottom": 0},
    )
    .configure_view(fill=PAGE_BG, strokeWidth=0)
    .configure_axis(
        grid=False, domain=False, ticks=False, labelColor=INK_SOFT, titleColor=INK, labelFontSize=10, titleFontSize=12
    )
    .configure_legend(fillColor=ELEVATED_BG, strokeColor=INK_SOFT, labelColor=INK_SOFT, titleColor=INK)
)

# Save PNG with theme suffix; pad canvas to exactly 2400×2400 (square Imprint target)
chart.save(f"plot-{THEME}.png", scale_factor=4.0)

TW, TH = 2400, 2400
_img = Image.open(f"plot-{THEME}.png").convert("RGB")
_w, _h = _img.size
if _w > TW or _h > TH:
    raise SystemExit(
        f"altair vl-convert produced {_w}×{_h}, exceeds target {TW}×{TH}. "
        f"Shrink chart .properties(width=, height=) values and re-render."
    )
if _w < TW or _h < TH:
    _canvas = Image.new("RGB", (TW, TH), PAGE_BG)
    _canvas.paste(_img, ((TW - _w) // 2, (TH - _h) // 2))
    _canvas.save(f"plot-{THEME}.png")

# Save interactive HTML
chart.save(f"plot-{THEME}.html")
Runnable source as JSON, for any HTTP client: https://api.anyplot.ai/specs/heatmap-rainflow/altair/code. Any spec id and library id listed in llms-full.txt fit the same URL shape; every URL below is complete and callable.
{
  "spec_id": "heatmap-rainflow",
  "language": "python",
  "library": "altair",
  "page": "https://anyplot.ai/heatmap-rainflow/python/altair",
  "hub": "https://anyplot.ai/heatmap-rainflow",
  "code_json": "https://api.anyplot.ai/specs/heatmap-rainflow/altair/code",
  "spec_json": "https://api.anyplot.ai/specs/heatmap-rainflow",
  "render_light_png": "https://storage.googleapis.com/anyplot-images/plots/heatmap-rainflow/python/altair/plot-light.png",
  "render_dark_png": "https://storage.googleapis.com/anyplot-images/plots/heatmap-rainflow/python/altair/plot-dark.png",
  "interactive_light_html": "https://storage.googleapis.com/anyplot-images/plots/heatmap-rainflow/python/altair/plot-light.html",
  "interactive_dark_html": "https://storage.googleapis.com/anyplot-images/plots/heatmap-rainflow/python/altair/plot-dark.html",
  "quality_score": 90.0,
  "license": "MIT",
  "guide": "https://anyplot.ai/llms.txt"
}
Part of Rainflow Counting Matrix for Fatigue Analysis on anyplot.ai.