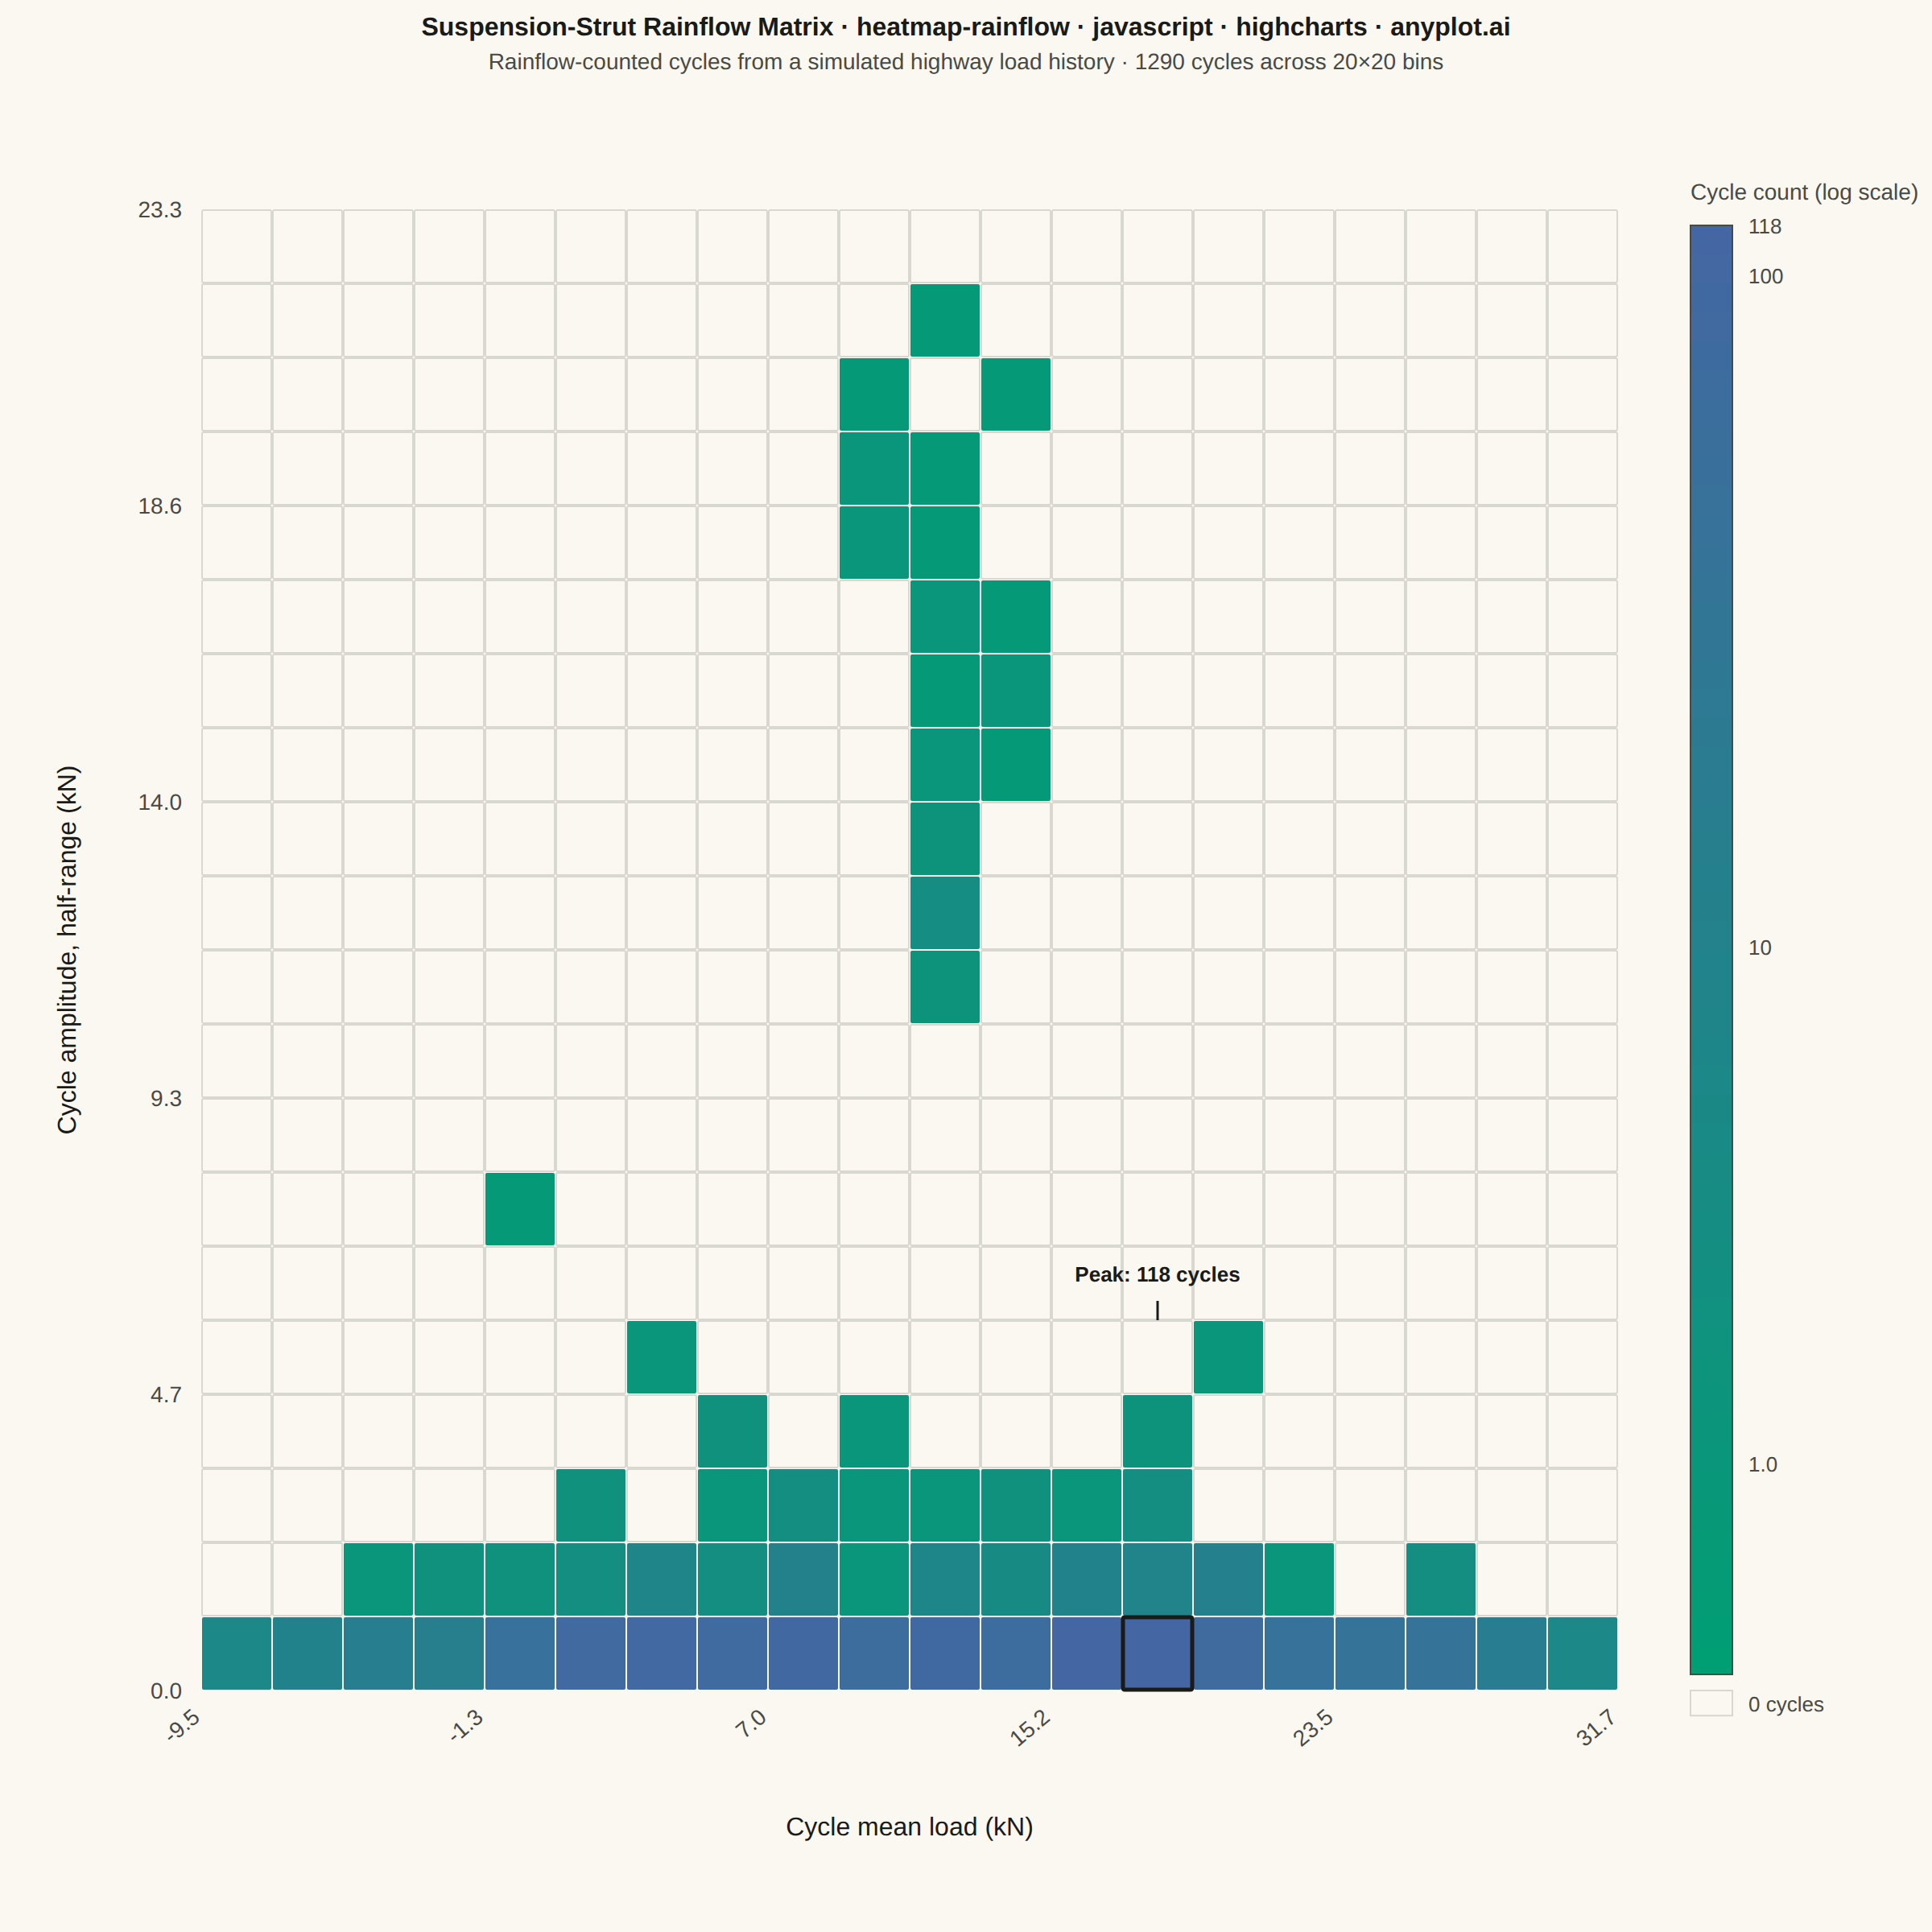
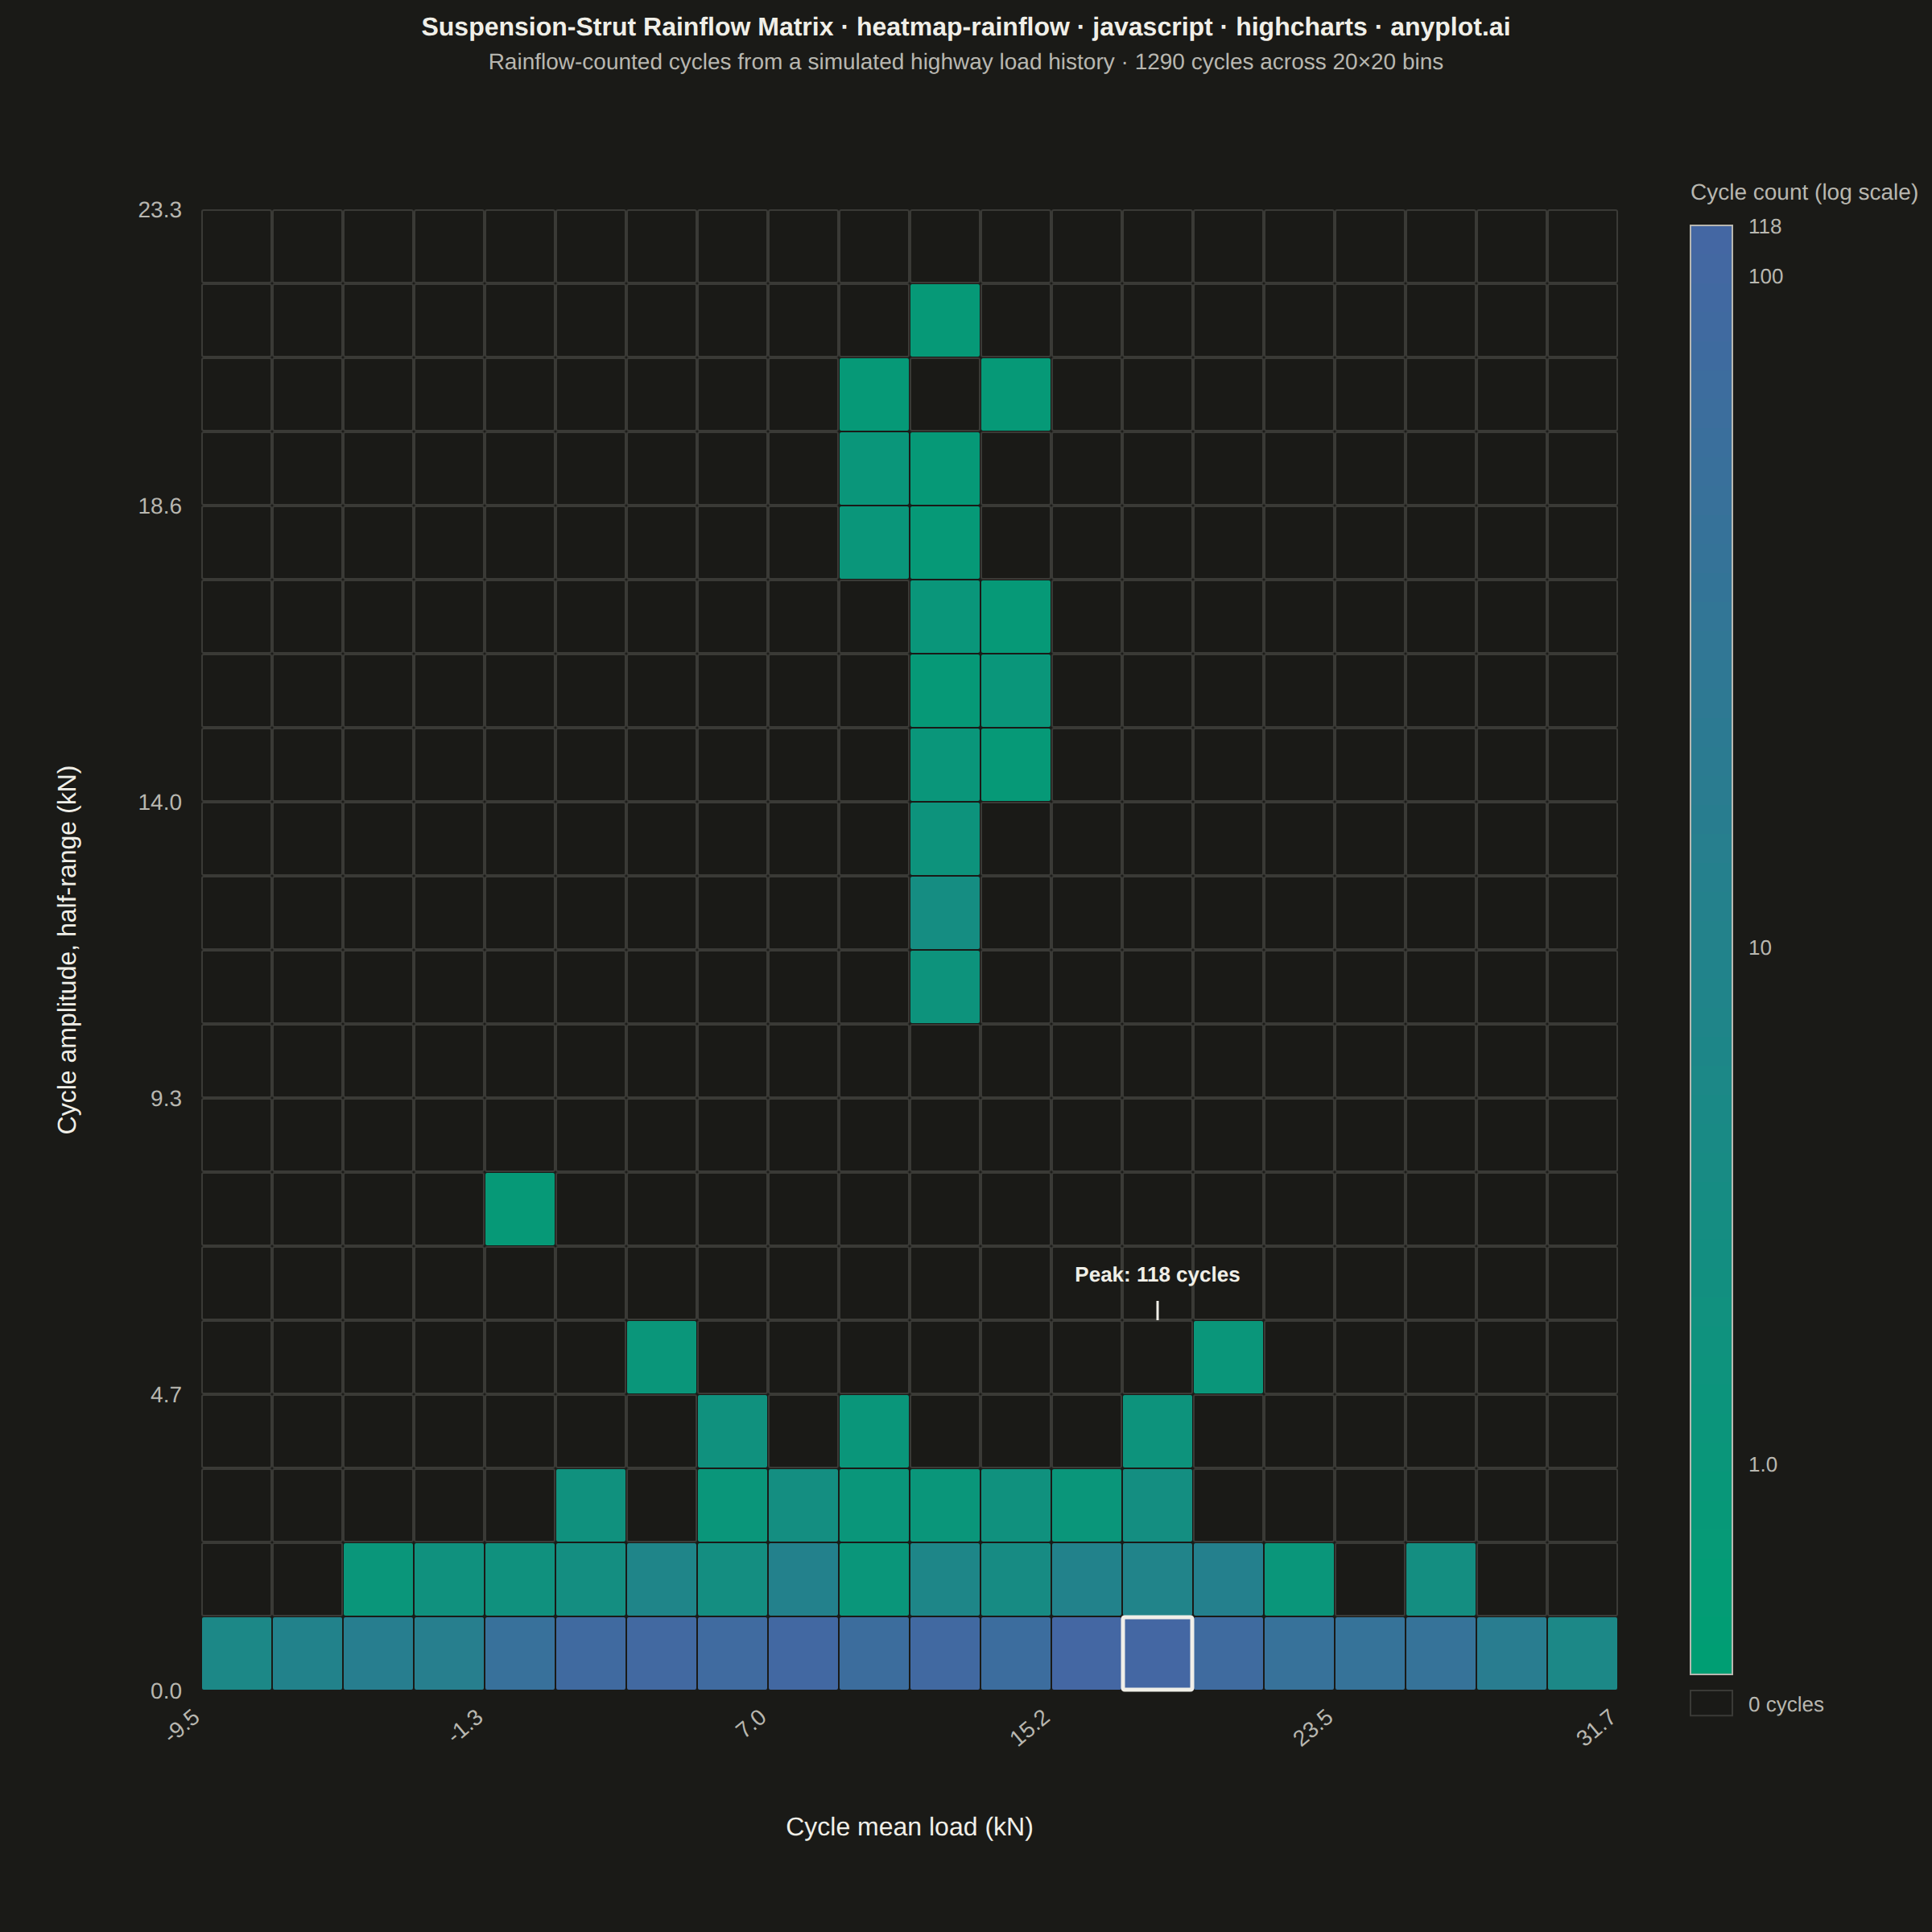
The same plot in 14 other libraries — JavaScript: Chart.js, D3.js, Apache ECharts, MUI X Charts; Python: Altair, Bokeh, lets-plot, Matplotlib, Plotly, plotnine, Pygal, Seaborn; R: ggplot2; Julia: Makie.jl. Compare all 15 side by side: Rainflow Counting Matrix for Fatigue Analysis in Python, R, Julia and JavaScript.
A rainflow counting matrix visualizes the results of rainflow cycle counting from a load or stress time history. The matrix displays cycle counts as a 2D heatmap where one axis represents cycle amplitude (half-range), the other represents cycle mean value, and color intensity represents the frequency of each cycle combination. This is a fundamental tool in fatigue analysis and durability engineering, used to characterize variable-amplitude loading for fatigue life prediction.
// anyplot.ai
// heatmap-rainflow: Rainflow Counting Matrix for Fatigue Analysis
// Library: highcharts 12.6.0 | JavaScript 22.23.2
// Quality: 90/100 | Created: 2026-08-25
//# anyplot-orientation: square

const t = window.ANYPLOT_TOKENS;

// --- Data: rainflow-counted suspension-strut load history -------------------
// A synthetic variable-amplitude strut load (kN) is generated, its turning
// points extracted, and a real ASTM-style four-point rainflow algorithm
// extracts (amplitude, mean) cycles from it — the matrix below is genuine
// counted output, not a hand-drawn distribution. The core Highcharts bundle
// has no heatmap/colorAxis-mapping module loaded, so the binned matrix is
// drawn cell-by-cell with the SVG renderer.
let seed = 20260825;
function rand() {
  seed = (seed * 1103515245 + 12345) & 0x7fffffff;
  return seed / 0x7fffffff;
}

const N_SAMPLES = 4000;
const signal = new Float64Array(N_SAMPLES);
for (let i = 0; i < N_SAMPLES; i++) {
  const tt = i / 40;
  // Slow envelope modulation mimics bursts of rough road between smooth stretches.
  const envelope = 8 + 6 * Math.sin(tt / 25) ** 2;
  const s1 = envelope * Math.sin(tt);
  const s2 = 0.4 * envelope * Math.sin(tt * 2.7 + 0.6);
  const s3 = 0.2 * envelope * Math.sin(tt * 5.3 + 1.1);
  const noise = (rand() - 0.5) * 3;
  signal[i] = 12 + s1 + s2 + s3 + noise; // 12 kN static preload
}

// Turning points: keep only local extrema (drop monotonic run interiors).
function turningPoints(sig) {
  const tp = [sig[0]];
  for (let i = 1; i < sig.length - 1; i++) {
    const d1 = sig[i] - sig[i - 1];
    const d2 = sig[i + 1] - sig[i];
    if ((d1 > 0 && d2 < 0) || (d1 < 0 && d2 > 0)) tp.push(sig[i]);
  }
  tp.push(sig[sig.length - 1]);
  return tp;
}

// Four-point rainflow: a closed cycle is extracted whenever the middle range
// of the last four points read is no larger than either flanking range. Full
// cycles count as 1; the unresolved residual left on the stack is closed out
// as half-cycles (standard rainflow practice for a finite-length signal).
function rainflowCycles(points) {
  const cycles = [];
  const stack = [];
  for (const p of points) {
    stack.push(p);
    while (stack.length >= 4) {
      const n = stack.length;
      const [a, b, c, d] = [stack[n - 4], stack[n - 3], stack[n - 2], stack[n - 1]];
      const rangeAB = Math.abs(b - a);
      const rangeBC = Math.abs(c - b);
      const rangeCD = Math.abs(d - c);
      if (rangeBC <= rangeAB && rangeBC <= rangeCD) {
        cycles.push({ range: rangeBC, mean: (b + c) / 2, count: 1 });
        stack.splice(n - 3, 2); // discard b, c — keep a, d for the next window
      } else {
        break;
      }
    }
  }
  for (let k = 0; k < stack.length - 1; k++) {
    cycles.push({ range: Math.abs(stack[k + 1] - stack[k]), mean: (stack[k + 1] + stack[k]) / 2, count: 0.5 });
  }
  return cycles;
}

const cycles = rainflowCycles(turningPoints(signal)).map((c) => ({ ...c, amplitude: c.range / 2 }));

// --- Binning: amplitude x mean, ~20x20 (spec: 10x10-64x64 typical) ---------
const N_AMP = 20;
const N_MEAN = 20;
let maxAmp = 0;
let minMean = Infinity;
let maxMean = -Infinity;
cycles.forEach((c) => {
  if (c.amplitude > maxAmp) maxAmp = c.amplitude;
  if (c.mean < minMean) minMean = c.mean;
  if (c.mean > maxMean) maxMean = c.mean;
});
const AMP_MAX = Math.ceil(maxAmp * 1.05 * 10) / 10;
const MEAN_MIN = Math.floor(minMean * 10) / 10;
const MEAN_MAX = Math.ceil(maxMean * 10) / 10;
const ampEdges = Array.from({ length: N_AMP + 1 }, (_, i) => (AMP_MAX * i) / N_AMP);
const meanEdges = Array.from({ length: N_MEAN + 1 }, (_, i) => MEAN_MIN + ((MEAN_MAX - MEAN_MIN) * i) / N_MEAN);

const matrix = Array.from({ length: N_AMP }, () => new Array(N_MEAN).fill(0));
function binIndex(value, edges) {
  const n = edges.length - 1;
  for (let i = 0; i < n; i++) {
    if (value >= edges[i] && (value < edges[i + 1] || i === n - 1)) return i;
  }
  return -1;
}
let totalCycles = 0;
cycles.forEach((c) => {
  const row = binIndex(c.amplitude, ampEdges);
  const col = binIndex(c.mean, meanEdges);
  if (row >= 0 && col >= 0) {
    matrix[row][col] += c.count;
    totalCycles += c.count;
  }
});

let maxCount = 0;
let peakRow = 0;
let peakCol = 0;
matrix.forEach((row, r) =>
  row.forEach((v, c) => {
    if (v > maxCount) {
      maxCount = v;
      peakRow = r;
      peakCol = c;
    }
  })
);
const maxLog = Math.log10(maxCount + 1);

// --- Color: imprint_seq on a log scale — cycle counts are heavily skewed ---
function hexToRgb(hex) {
  return [parseInt(hex.slice(1, 3), 16), parseInt(hex.slice(3, 5), 16), parseInt(hex.slice(5, 7), 16)];
}
const SEQ_LO = hexToRgb(t.seq[0]); // #009E73
const SEQ_HI = hexToRgb(t.seq[1]); // #4467A3
function countFill(count) {
  const f = Math.log10(count + 1) / maxLog;
  const rgb = SEQ_LO.map((lo, i) => Math.round(lo + (SEQ_HI[i] - lo) * f));
  return `rgb(${rgb.join(',')})`;
}

// --- Title (fontsize scaled off the 67-char baseline) ----------------------
const TITLE_TEXT = 'Suspension-Strut Rainflow Matrix · heatmap-rainflow · javascript · highcharts · anyplot.ai';
const TITLE_FS = Math.max(Math.round(22 * Math.min(1, 67 / TITLE_TEXT.length)), 14);

// Fixed chart geometry (square canvas, harness-guaranteed 1200x1200 CSS px) —
// single source of truth for the margin, the grid, and the invisible hover
// layer below, so everything lines up without a runtime resync.
const CHART_MARGIN = [130, 195, 150, 125]; // [top, right, bottom, left]
const CELL_W = (window.ANYPLOT_SIZE.width - CHART_MARGIN[1] - CHART_MARGIN[3]) / N_MEAN;
const CELL_H = (window.ANYPLOT_SIZE.height - CHART_MARGIN[0] - CHART_MARGIN[2]) / N_AMP;
const MARKER_RADIUS = Math.max(Math.min(CELL_W, CELL_H) / 2 - 2, 3);

const drawn = [];
function clearDrawn() {
  drawn.forEach((el) => {
    try {
      el.destroy();
    } catch (_err) {
      // already removed
    }
  });
  drawn.length = 0;
}

// Intentional: no heatmap/colorAxis module is loaded in the core bundle, so
// drawAll() paints the matrix cell-by-cell via chart.renderer primitives
// instead of a Highcharts series — a deliberate workaround, not an oversight.
function drawAll() {
  const chart = this;
  clearDrawn();
  const r = chart.renderer;

  const cellW = chart.plotWidth / N_MEAN;
  const cellH = chart.plotHeight / N_AMP;

  // Grid cells — amplitude increases upward (row 0 = bottom), mean rightward.
  for (let row = 0; row < N_AMP; row++) {
    for (let col = 0; col < N_MEAN; col++) {
      const count = matrix[row][col];
      const x = chart.plotLeft + col * cellW;
      const y = chart.plotTop + (N_AMP - 1 - row) * cellH;
      const isZero = count <= 0;
      drawn.push(
        r
          .rect(x + 0.5, y + 0.5, cellW - 1, cellH - 1, 1)
          .attr({
            fill: isZero ? 'transparent' : countFill(count),
            stroke: isZero ? t.grid : 'none',
            'stroke-width': isZero ? 1 : 0,
            zIndex: 2,
          })
          .add()
      );
    }
  }

  // Explicit callout on the dominant high-count cluster (DE-03: sharpen the
  // story instead of relying solely on implicit color/spatial pattern). The
  // label is pushed past the last occupied row within +/-2 columns of the
  // peak so it never lands on top of colored data (VQ-02: no overlap).
  const peakX = chart.plotLeft + (peakCol + 0.5) * cellW;
  const peakCellY = chart.plotTop + (N_AMP - 1 - peakRow) * cellH;
  const labelAbove = peakRow < N_AMP / 2;
  const neighborhoodClear = (row) => {
    for (let col = Math.max(0, peakCol - 2); col <= Math.min(N_MEAN - 1, peakCol + 2); col++) {
      if (matrix[row][col] > 0) return false;
    }
    return true;
  };
  let clearRow = peakRow;
  if (labelAbove) {
    while (clearRow + 1 < N_AMP && !neighborhoodClear(clearRow + 1)) clearRow++;
  } else {
    while (clearRow - 1 >= 0 && !neighborhoodClear(clearRow - 1)) clearRow--;
  }
  const boundaryY = labelAbove ? chart.plotTop + (N_AMP - 1 - clearRow) * cellH : chart.plotTop + (N_AMP - clearRow) * cellH;
  const labelY = labelAbove ? Math.max(boundaryY - 24, chart.plotTop + 14) : Math.min(boundaryY + 24, chart.plotTop + chart.plotHeight - 6);
  drawn.push(
    r
      .rect(chart.plotLeft + peakCol * cellW + 0.5, peakCellY + 0.5, cellW - 1, cellH - 1, 1)
      .attr({ fill: 'none', stroke: t.ink, 'stroke-width': 2.5, zIndex: 3 })
      .add()
  );
  drawn.push(
    r
      .path(['M', peakX, boundaryY, 'L', peakX, labelY + (labelAbove ? 12 : -12)])
      .attr({ stroke: t.ink, 'stroke-width': 1.5, zIndex: 3 })
      .add()
  );
  drawn.push(
    r
      .text(`Peak: ${Math.round(maxCount)} cycles`, peakX, labelY)
      .attr({ align: 'center', zIndex: 3 })
      .css({ color: t.ink, fontSize: '13px', fontWeight: '600' })
      .add()
  );

  // Amplitude tick labels (left, every 4th bin edge) + rotated axis title.
  for (let row = 0; row <= N_AMP; row += 4) {
    const cy = chart.plotTop + (N_AMP - row) * cellH + 5;
    drawn.push(
      r
        .text(ampEdges[row].toFixed(1), chart.plotLeft - 12, cy)
        .attr({ align: 'right', zIndex: 2 })
        .css({ color: t.inkSoft, fontSize: '14px' })
        .add()
    );
  }
  drawn.push(
    r
      .text('Cycle amplitude, half-range (kN)', 0, 0)
      .attr({
        align: 'center',
        rotation: -90,
        x: chart.plotLeft - 78,
        y: chart.plotTop + chart.plotHeight / 2,
        zIndex: 2,
      })
      .css({ color: t.ink, fontSize: '16px' })
      .add()
  );

  // Mean tick labels (bottom, every 4th bin edge, rotated) + axis title.
  for (let col = 0; col <= N_MEAN; col += 4) {
    const cx = chart.plotLeft + col * cellW;
    drawn.push(
      r
        .text(meanEdges[col].toFixed(1), cx, chart.plotTop + chart.plotHeight + 18)
        .attr({ align: 'right', rotation: -40, zIndex: 2 })
        .css({ color: t.inkSoft, fontSize: '14px' })
        .add()
    );
  }
  drawn.push(
    r
      .text('Cycle mean load (kN)', chart.plotLeft + chart.plotWidth / 2, chart.plotTop + chart.plotHeight + 90)
      .attr({ align: 'center', zIndex: 2 })
      .css({ color: t.ink, fontSize: '16px' })
      .add()
  );

  // Log-scaled sequential colorbar in the freed right margin.
  const barLeft = chart.plotLeft + chart.plotWidth + 45;
  const barTop = chart.plotTop + 10;
  const barWidth = 26;
  const barHeight = chart.plotHeight - 20;
  const segments = 50;
  const segH = barHeight / segments;
  for (let i = 0; i < segments; i++) {
    const f = 1 - i / (segments - 1);
    const count = Math.pow(10, f * maxLog) - 1;
    drawn.push(
      r
        .rect(barLeft, barTop + i * segH, barWidth, segH + 0.5)
        .attr({ fill: countFill(count), zIndex: 2 })
        .add()
    );
  }
  drawn.push(
    r
      .rect(barLeft, barTop, barWidth, barHeight)
      .attr({ fill: 'none', stroke: t.inkSoft, 'stroke-width': 1, zIndex: 2 })
      .add()
  );
  // Ticks at round powers of ten up to maxCount, plus the exact max.
  const tickCounts = [1, 10, 100, 1000].filter((v) => v < maxCount);
  tickCounts.push(maxCount);
  tickCounts.forEach((count) => {
    const frac = 1 - Math.log10(count + 1) / maxLog;
    drawn.push(
      r
        .text(count >= 10 ? Math.round(count).toLocaleString() : count.toFixed(1), barLeft + barWidth + 10, barTop + frac * barHeight + 5)
        .attr({ align: 'left', zIndex: 2 })
        .css({ color: t.inkSoft, fontSize: '13px' })
        .add()
    );
  });
  drawn.push(
    r
      .text('Cycle count (log scale)', barLeft, barTop - 16)
      .attr({ align: 'left', zIndex: 2 })
      .css({ color: t.inkSoft, fontSize: '14px', fontWeight: '500' })
      .add()
  );
  drawn.push(
    r
      .rect(barLeft, barTop + barHeight + 10, barWidth, barWidth * 0.6)
      .attr({ fill: 'transparent', stroke: t.grid, 'stroke-width': 1, zIndex: 2 })
      .add()
  );
  drawn.push(
    r
      .text('0 cycles', barLeft + barWidth + 10, barTop + barHeight + 10 + barWidth * 0.35 + 4)
      .attr({ align: 'left', zIndex: 2 })
      .css({ color: t.inkSoft, fontSize: '13px' })
      .add()
  );
}

// Invisible scatter layer aligned to each drawn cell so hovering exposes a
// real Highcharts tooltip — the core bundle has no heatmap/colorAxis module,
// but a matched-axis scatter series recovers native hover interactivity
// without disturbing the hand-drawn grid above it.
const cellPoints = [];
for (let row = 0; row < N_AMP; row++) {
  for (let col = 0; col < N_MEAN; col++) {
    cellPoints.push({
      x: col + 0.5,
      y: row + 0.5,
      count: matrix[row][col],
      ampLo: ampEdges[row],
      ampHi: ampEdges[row + 1],
      meanLo: meanEdges[col],
      meanHi: meanEdges[col + 1],
    });
  }
}

Highcharts.chart('container', {
  chart: {
    backgroundColor: 'transparent',
    animation: false,
    style: { fontFamily: 'inherit' },
    margin: CHART_MARGIN,
    events: { load: drawAll, redraw: drawAll },
  },
  credits: { enabled: false },
  title: {
    text: TITLE_TEXT,
    style: { color: t.ink, fontSize: TITLE_FS + 'px', fontWeight: '600' },
  },
  subtitle: {
    text: `Rainflow-counted cycles from a simulated highway load history · ${Math.round(totalCycles)} cycles across ${N_AMP}×${N_MEAN} bins`,
    style: { color: t.inkSoft, fontSize: '14px' },
  },
  xAxis: { visible: false, min: 0, max: N_MEAN },
  yAxis: { visible: false, gridLineWidth: 0, min: 0, max: N_AMP },
  legend: { enabled: false },
  tooltip: {
    enabled: true,
    backgroundColor: t.elevatedBg,
    borderColor: t.inkSoft,
    borderRadius: 6,
    style: { color: t.ink, fontSize: '13px' },
    formatter: function () {
      const p = this.point;
      return (
        `<b>amplitude ${p.ampLo.toFixed(1)}–${p.ampHi.toFixed(1)} kN</b><br/>` +
        `mean ${p.meanLo.toFixed(1)}–${p.meanHi.toFixed(1)} kN<br/>` +
        `${p.count.toFixed(1)} cycles`
      );
    },
  },
  plotOptions: {
    series: { animation: false },
    scatter: {
      enableMouseTracking: true,
      stickyTracking: false,
      marker: {
        enabled: true,
        symbol: 'circle',
        radius: MARKER_RADIUS,
        fillColor: 'rgba(0,0,0,0.001)',
        lineWidth: 0,
        states: { hover: { enabled: false } },
      },
    },
  },
  series: [
    {
      type: 'scatter',
      name: 'Cycle count',
      data: cellPoints,
    },
  ],
});
Runnable source as JSON, for any HTTP client: https://api.anyplot.ai/specs/heatmap-rainflow/highcharts/code. Any spec id and library id listed in llms-full.txt fit the same URL shape; every URL below is complete and callable.
{
  "spec_id": "heatmap-rainflow",
  "language": "javascript",
  "library": "highcharts",
  "page": "https://anyplot.ai/heatmap-rainflow/javascript/highcharts",
  "hub": "https://anyplot.ai/heatmap-rainflow",
  "code_json": "https://api.anyplot.ai/specs/heatmap-rainflow/highcharts/code",
  "spec_json": "https://api.anyplot.ai/specs/heatmap-rainflow",
  "render_light_png": "https://storage.googleapis.com/anyplot-images/plots/heatmap-rainflow/javascript/highcharts/plot-light.png",
  "render_dark_png": "https://storage.googleapis.com/anyplot-images/plots/heatmap-rainflow/javascript/highcharts/plot-dark.png",
  "interactive_light_html": "https://storage.googleapis.com/anyplot-images/plots/heatmap-rainflow/javascript/highcharts/plot-light.html",
  "interactive_dark_html": "https://storage.googleapis.com/anyplot-images/plots/heatmap-rainflow/javascript/highcharts/plot-dark.html",
  "quality_score": 90.0,
  "license": "MIT",
  "guide": "https://anyplot.ai/llms.txt"
}
Part of Rainflow Counting Matrix for Fatigue Analysis on anyplot.ai.