The same plot in 14 other libraries — JavaScript: D3.js, Apache ECharts, Highcharts, MUI X Charts; Python: Altair, Bokeh, lets-plot, Matplotlib, Plotly, plotnine, Pygal, Seaborn; R: ggplot2; Julia: Makie.jl. Compare all 15 side by side: Basic Hexbin Plot in Python, R, Julia and JavaScript.
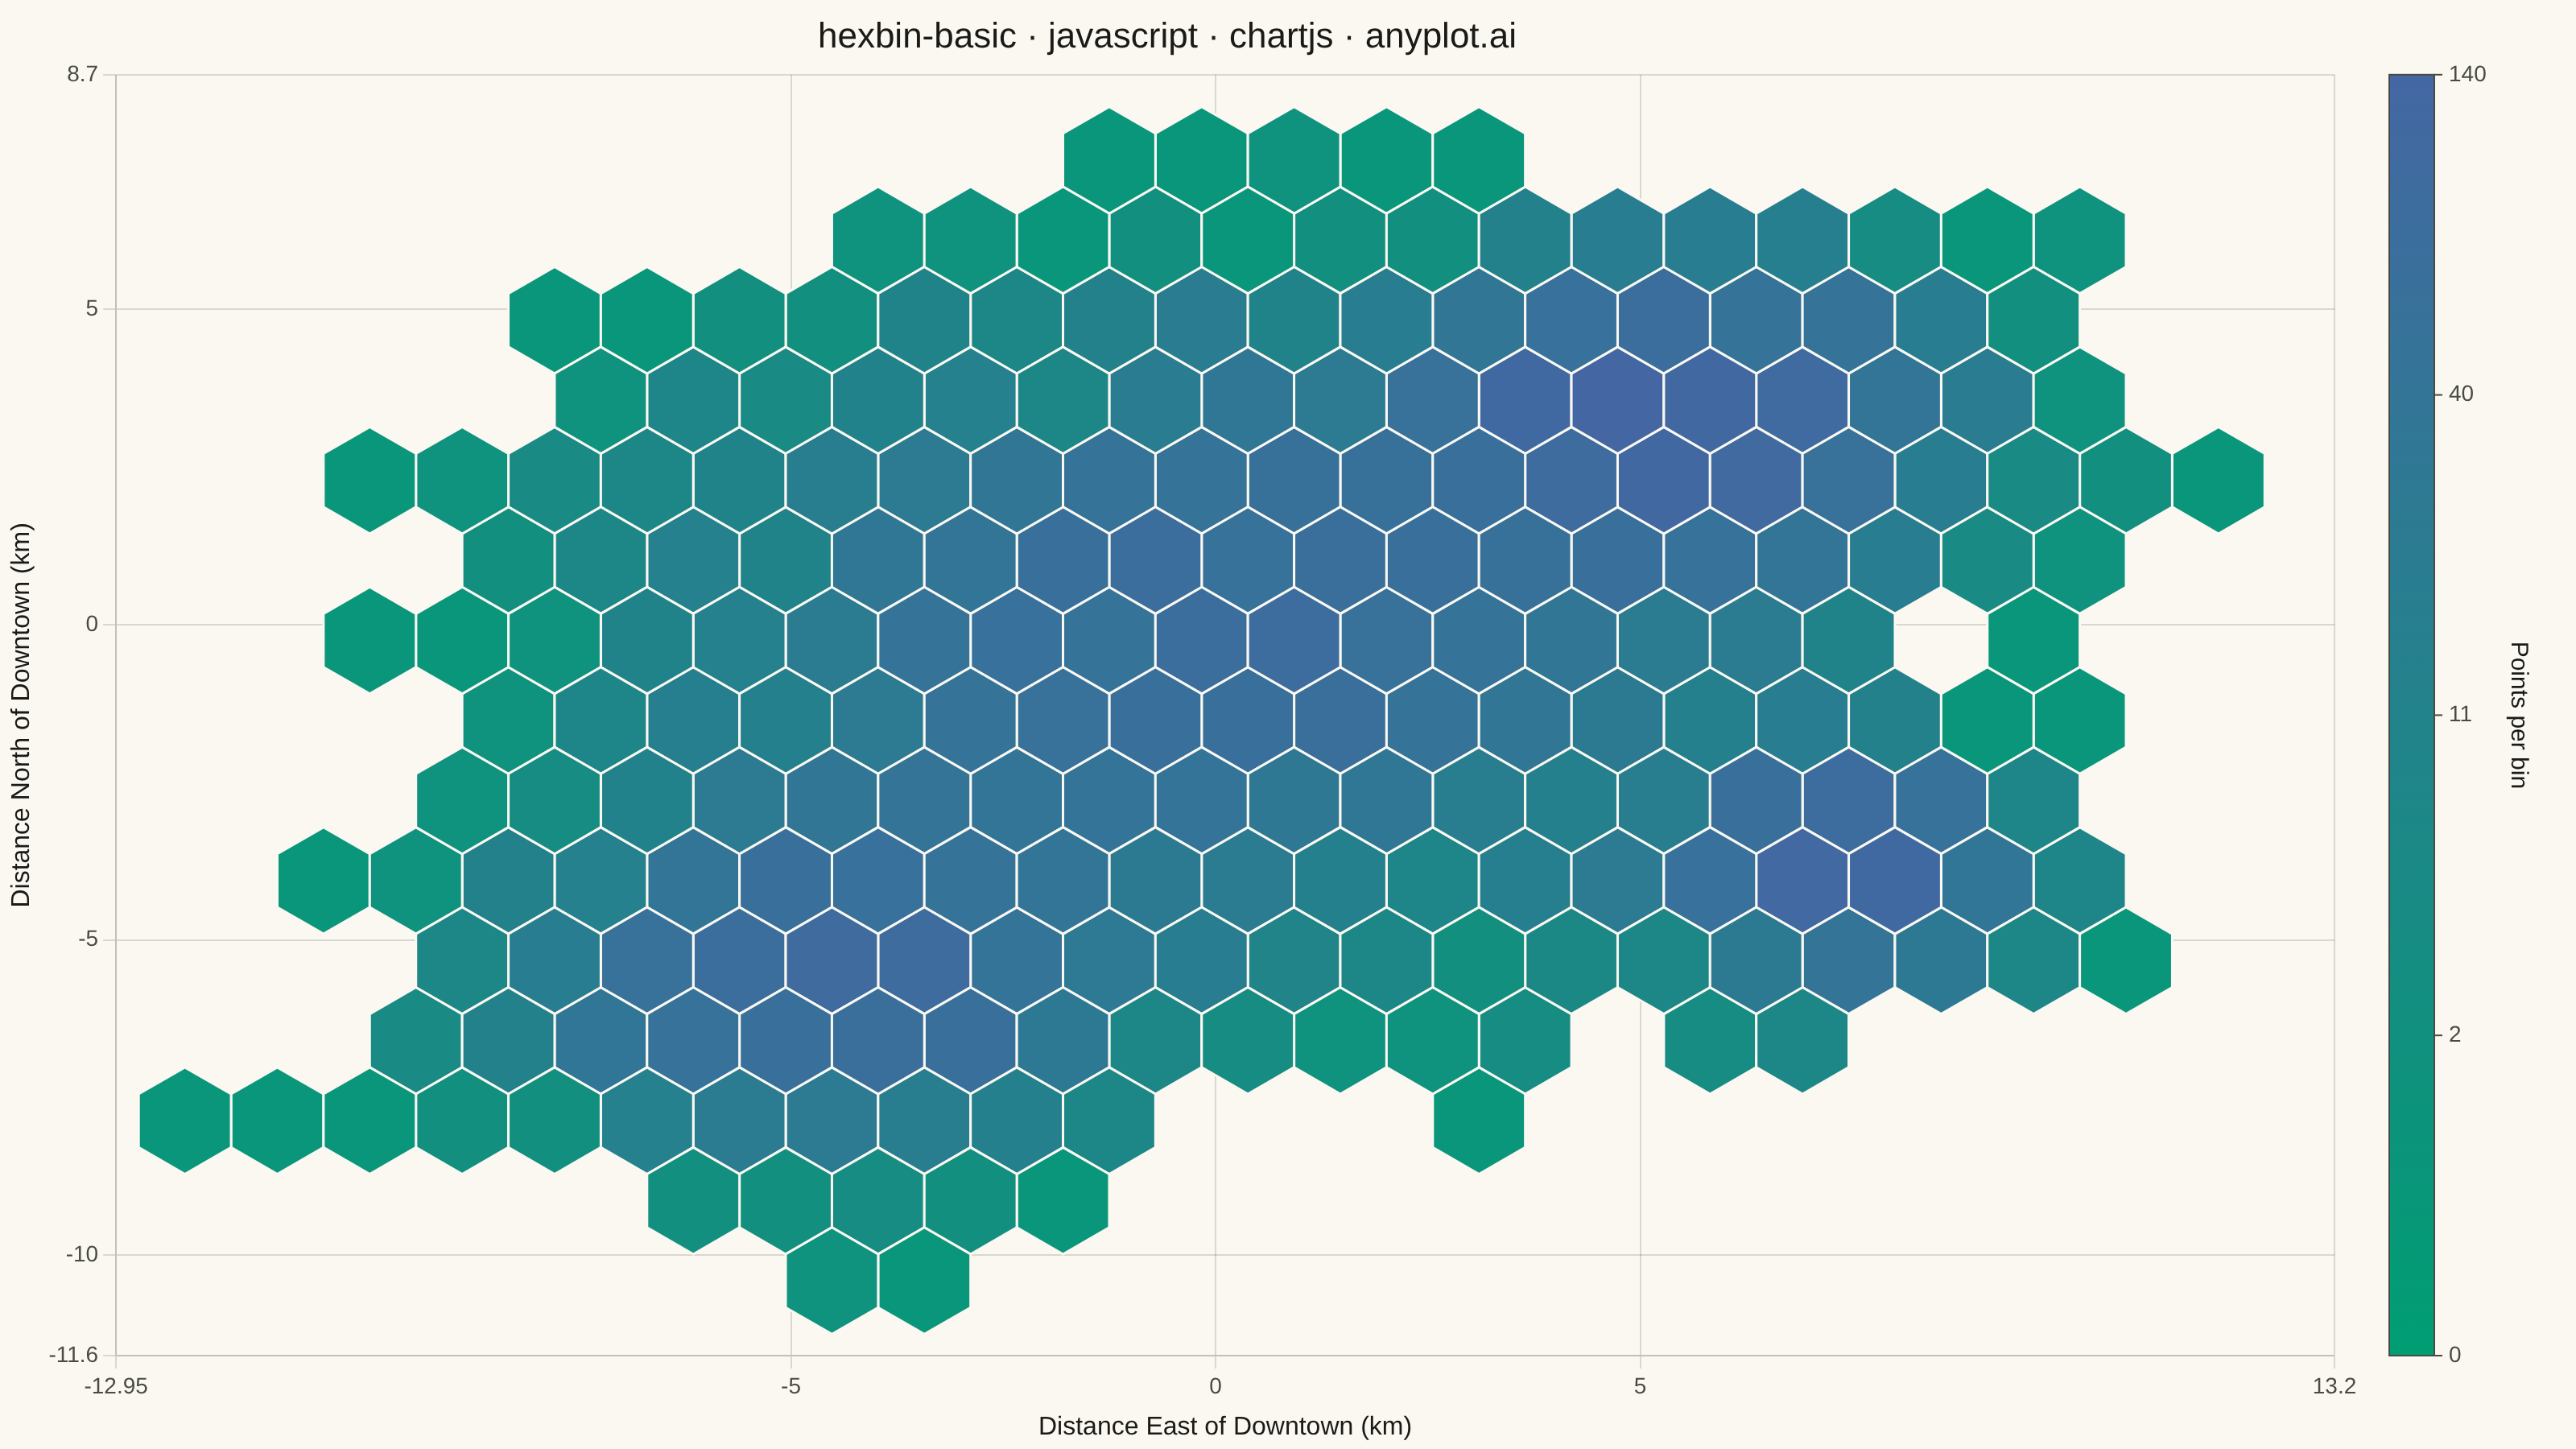
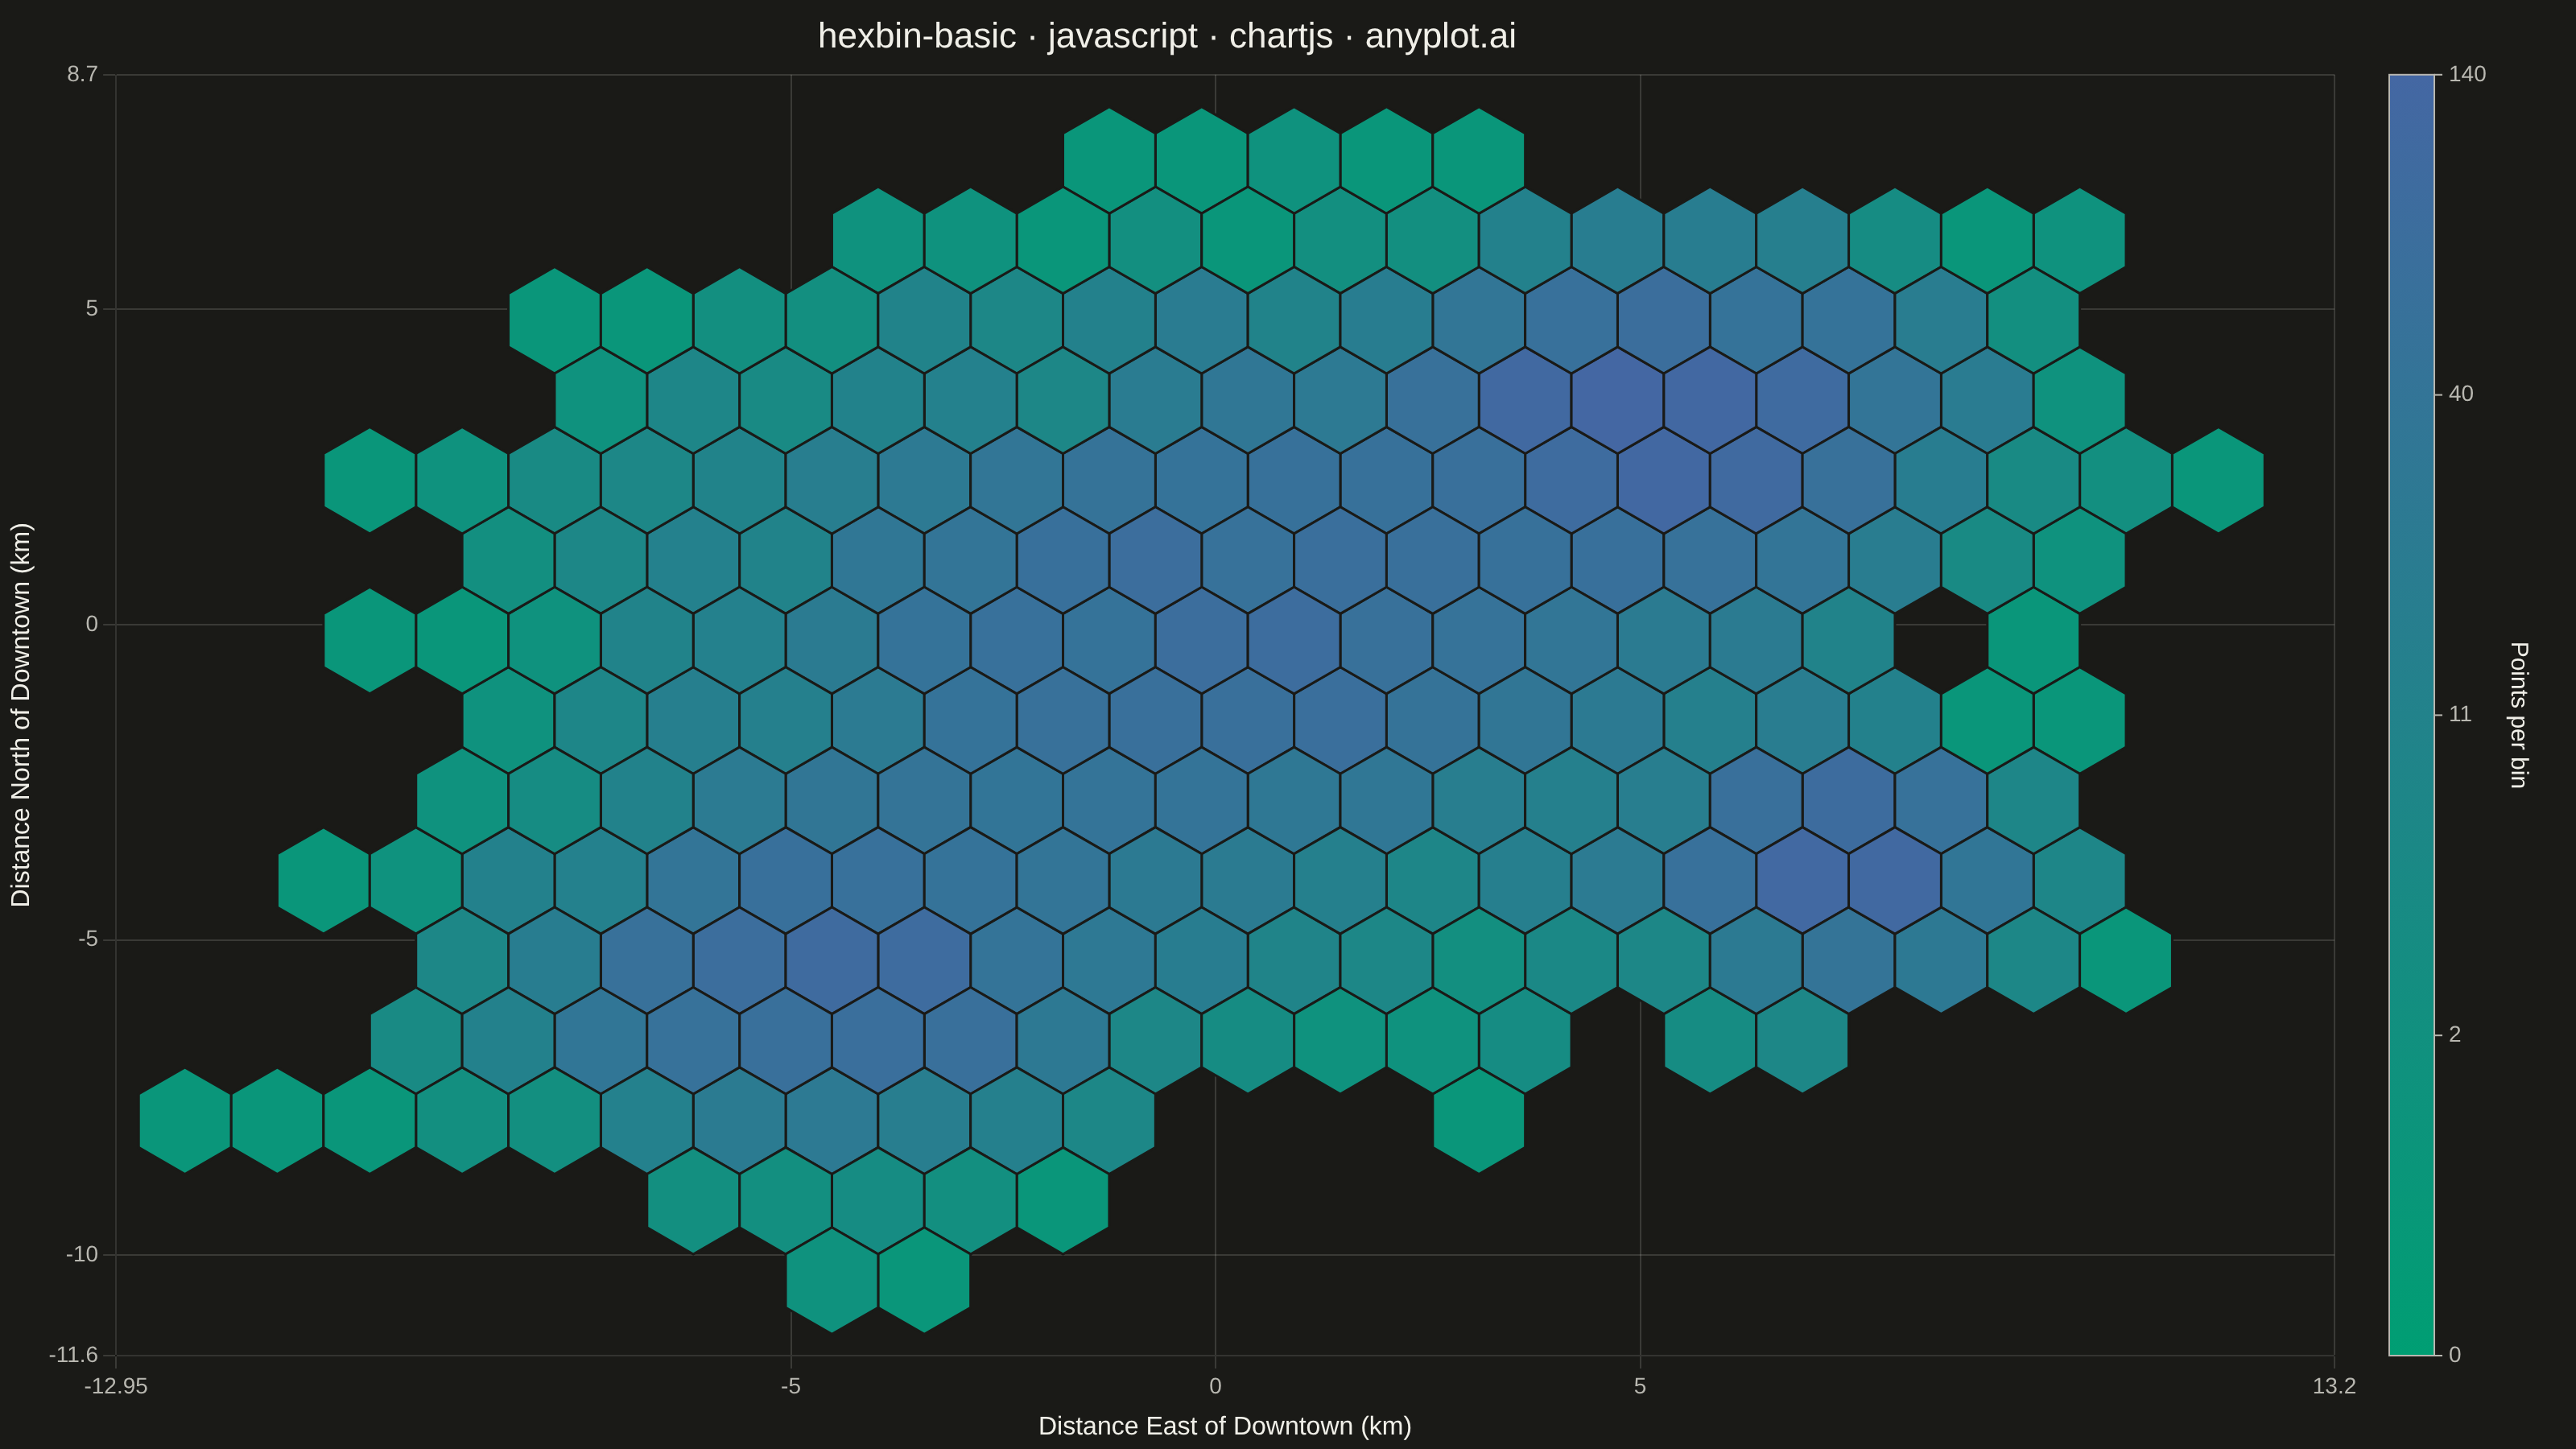
A hexagonal binning plot that visualizes the density of 2D point data by aggregating points into hexagonal bins. The color intensity of each hexagon represents the count of points within it, making it ideal for revealing density patterns in large datasets where traditional scatter plots would show overlapping points. Hexagonal bins provide better visual representation than square pixels due to their isotropy (equal distance to neighboring cells in all directions).
// anyplot.ai
// hexbin-basic: Basic Hexbin Plot
// Library: chartjs 4.4.7 | JavaScript 22.23.2
// Quality: 91/100 | Created: 2026-08-25

const t = window.ANYPLOT_TOKENS;

// --- Data: simulated GPS pings around a city center, clustered by land use --
// (deterministic LCG + Box-Muller — the browser has no seeded Math.random)
function makeRng(seed) {
  let s = seed >>> 0;
  return function rng() {
    s = (s * 1664525 + 1013904223) >>> 0;
    return s / 4294967296;
  };
}
function gaussian(rng) {
  const u1 = Math.max(rng(), 1e-9);
  const u2 = rng();
  return Math.sqrt(-2 * Math.log(u1)) * Math.cos(2 * Math.PI * u2);
}

const rng = makeRng(42);
const CLUSTERS = [
  { n: 2600, cx: 0.0, cy: 0.0, sx: 3.2, sy: 2.4 }, // downtown core
  { n: 1500, cx: 5.5, cy: 3.2, sx: 1.6, sy: 1.3 }, // business park
  { n: 1200, cx: -4.5, cy: -5.5, sx: 1.9, sy: 1.4 }, // airport corridor
  { n: 700, cx: 7.2, cy: -3.8, sx: 1.1, sy: 0.9 }, // suburban mall
];

const points = [];
for (const c of CLUSTERS) {
  for (let i = 0; i < c.n; i++) {
    points.push({ x: c.cx + gaussian(rng) * c.sx, y: c.cy + gaussian(rng) * c.sy });
  }
}

let xMin = Infinity;
let xMax = -Infinity;
let yMin = Infinity;
let yMax = -Infinity;
for (const p of points) {
  if (p.x < xMin) xMin = p.x;
  if (p.x > xMax) xMax = p.x;
  if (p.y < yMin) yMin = p.y;
  if (p.y > yMax) yMax = p.y;
}
const padX = (xMax - xMin) * 0.05;
const padY = (yMax - yMin) * 0.05;
const domain = { xMin: xMin - padX, xMax: xMax + padX, yMin: yMin - padY, yMax: yMax + padY };

// --- Hexagonal binning (pointy-top axial grid, gridsize controls resolution) -
// Binned and rendered entirely in PIXEL space (not data space): each point is
// converted to its pixel position first, then assigned to an axial hex grid
// with a fixed pixel radius. This keeps every hexagon geometrically regular
// on screen regardless of the mismatch between the data x:y domain ratio and
// the chart's actual pixel aspect ratio.
const GRIDSIZE = 24;

function pointToHex(x, y, size) {
  const q = ((Math.sqrt(3) / 3) * x - y / 3) / size;
  const r = ((2 / 3) * y) / size;
  return hexRound(q, r);
}
function hexRound(q, r) {
  const s = -q - r;
  let rq = Math.round(q);
  let rr = Math.round(r);
  const rs = Math.round(s);
  const qDiff = Math.abs(rq - q);
  const rDiff = Math.abs(rr - r);
  const sDiff = Math.abs(rs - s);
  if (qDiff > rDiff && qDiff > sDiff) rq = -rr - rs;
  else if (rDiff > sDiff) rr = -rq - rs;
  return { q: rq, r: rr };
}
function hexToPoint(q, r, size) {
  return { x: size * Math.sqrt(3) * (q + r / 2), y: size * 1.5 * r };
}

// --- Density color: imprint_seq (brand green -> blue), log-scaled -----------
function hexToRgb(hex) {
  const n = parseInt(hex.slice(1), 16);
  return { r: (n >> 16) & 255, g: (n >> 8) & 255, b: n & 255 };
}
const seqLow = hexToRgb(t.seq[0]);
const seqHigh = hexToRgb(t.seq[1]);
let maxCount = 0;
function densityColor(count) {
  const ratio = Math.log1p(count) / Math.log1p(maxCount);
  const r = Math.round(seqLow.r + (seqHigh.r - seqLow.r) * ratio);
  const g = Math.round(seqLow.g + (seqHigh.g - seqLow.g) * ratio);
  const b = Math.round(seqLow.b + (seqHigh.b - seqLow.b) * ratio);
  return "rgb(" + r + "," + g + "," + b + ")";
}

// --- Plugin: bin points (in pixel space) and draw the aggregated hexagons ---
// over the (empty) scatter axes. colorbarPlugin's afterDraw runs right after
// this afterDatasetsDraw within the same draw pass, so it always sees the
// maxCount computed here.
const HEX_ANGLES = [0, 1, 2, 3, 4, 5].map((i) => (Math.PI / 180) * (60 * i - 30));
const hexbinPlugin = {
  id: "hexbinPlugin",
  afterDatasetsDraw(chart) {
    const { ctx, scales, chartArea } = chart;
    const hexSizePx = (chartArea.right - chartArea.left) / GRIDSIZE / Math.sqrt(3);

    const bins = new Map();
    for (const p of points) {
      const px = scales.x.getPixelForValue(p.x);
      const py = scales.y.getPixelForValue(p.y);
      const { q, r } = pointToHex(px, py, hexSizePx);
      const key = q + "," + r;
      bins.set(key, (bins.get(key) || 0) + 1);
    }
    maxCount = 0;
    const hexBins = [];
    for (const [key, count] of bins) {
      const [q, r] = key.split(",").map(Number);
      const center = hexToPoint(q, r, hexSizePx);
      hexBins.push({ x: center.x, y: center.y, count });
      if (count > maxCount) maxCount = count;
    }

    ctx.save();
    for (const bin of hexBins) {
      ctx.beginPath();
      HEX_ANGLES.forEach((angle, i) => {
        const vx = bin.x + hexSizePx * Math.cos(angle);
        const vy = bin.y + hexSizePx * Math.sin(angle);
        if (i === 0) ctx.moveTo(vx, vy);
        else ctx.lineTo(vx, vy);
      });
      ctx.closePath();
      ctx.fillStyle = densityColor(bin.count);
      ctx.fill();
      ctx.strokeStyle = t.pageBg;
      ctx.lineWidth = 1.5;
      ctx.stroke();
    }
    ctx.restore();
  },
};

// --- Plugin: density color bar (Chart.js has no built-in colorbar) ----------
const colorbarPlugin = {
  id: "colorbarPlugin",
  afterDraw(chart) {
    const { ctx, chartArea } = chart;
    const barWidth = 28;
    const barX = chartArea.right + 34;
    const barTop = chartArea.top;
    const barHeight = chartArea.bottom - chartArea.top;

    const gradient = ctx.createLinearGradient(0, chartArea.bottom, 0, barTop);
    gradient.addColorStop(0, t.seq[0]);
    gradient.addColorStop(1, t.seq[1]);

    ctx.save();
    ctx.fillStyle = gradient;
    ctx.fillRect(barX, barTop, barWidth, barHeight);
    ctx.strokeStyle = t.inkSoft;
    ctx.lineWidth = 1;
    ctx.strokeRect(barX, barTop, barWidth, barHeight);

    ctx.fillStyle = t.inkSoft;
    ctx.font = "14px sans-serif";
    ctx.textAlign = "left";
    ctx.textBaseline = "middle";
    for (const frac of [0, 0.25, 0.5, 0.75, 1]) {
      const count = Math.round(Math.expm1(frac * Math.log1p(maxCount)));
      const py = chartArea.bottom - frac * barHeight;
      ctx.beginPath();
      ctx.moveTo(barX + barWidth, py);
      ctx.lineTo(barX + barWidth + 5, py);
      ctx.stroke();
      ctx.fillText(String(count), barX + barWidth + 9, py);
    }

    ctx.translate(barX + barWidth + 48, barTop + barHeight / 2);
    ctx.rotate(Math.PI / 2);
    ctx.textAlign = "center";
    ctx.textBaseline = "alphabetic";
    ctx.fillStyle = t.ink;
    ctx.font = "15px sans-serif";
    ctx.fillText("Points per bin", 0, 0);
    ctx.restore();
  },
};

// --- Mount -------------------------------------------------------------------
const canvas = document.createElement("canvas");
document.getElementById("container").appendChild(canvas);

// --- Chart (empty scatter dataset supplies the axes; plugins draw the bins) -
new Chart(canvas, {
  type: "scatter",
  data: { datasets: [{ data: [] }] },
  options: {
    responsive: true,
    maintainAspectRatio: false,
    animation: false,
    layout: { padding: { right: 150 } },
    plugins: {
      title: {
        display: true,
        text: "hexbin-basic · javascript · chartjs · anyplot.ai",
        color: t.ink,
        font: { size: 22, weight: "500" },
      },
      legend: { display: false },
      tooltip: { enabled: false },
    },
    scales: {
      x: {
        type: "linear",
        min: domain.xMin,
        max: domain.xMax,
        title: { display: true, text: "Distance East of Downtown (km)", color: t.ink, font: { size: 16 } },
        ticks: { color: t.inkSoft, font: { size: 14 } },
        grid: { color: t.grid },
      },
      y: {
        type: "linear",
        min: domain.yMin,
        max: domain.yMax,
        title: { display: true, text: "Distance North of Downtown (km)", color: t.ink, font: { size: 16 } },
        ticks: { color: t.inkSoft, font: { size: 14 } },
        grid: { color: t.grid },
      },
    },
  },
  plugins: [hexbinPlugin, colorbarPlugin],
});
Runnable source as JSON, for any HTTP client: https://api.anyplot.ai/specs/hexbin-basic/chartjs/code. Any spec id and library id listed in llms-full.txt fit the same URL shape; every URL below is complete and callable.
{
  "spec_id": "hexbin-basic",
  "language": "javascript",
  "library": "chartjs",
  "page": "https://anyplot.ai/hexbin-basic/javascript/chartjs",
  "hub": "https://anyplot.ai/hexbin-basic",
  "code_json": "https://api.anyplot.ai/specs/hexbin-basic/chartjs/code",
  "spec_json": "https://api.anyplot.ai/specs/hexbin-basic",
  "render_light_png": "https://storage.googleapis.com/anyplot-images/plots/hexbin-basic/javascript/chartjs/plot-light.png",
  "render_dark_png": "https://storage.googleapis.com/anyplot-images/plots/hexbin-basic/javascript/chartjs/plot-dark.png",
  "interactive_light_html": "https://storage.googleapis.com/anyplot-images/plots/hexbin-basic/javascript/chartjs/plot-light.html",
  "interactive_dark_html": "https://storage.googleapis.com/anyplot-images/plots/hexbin-basic/javascript/chartjs/plot-dark.html",
  "quality_score": 91.0,
  "license": "MIT",
  "guide": "https://anyplot.ai/llms.txt"
}
Part of Basic Hexbin Plot on anyplot.ai.