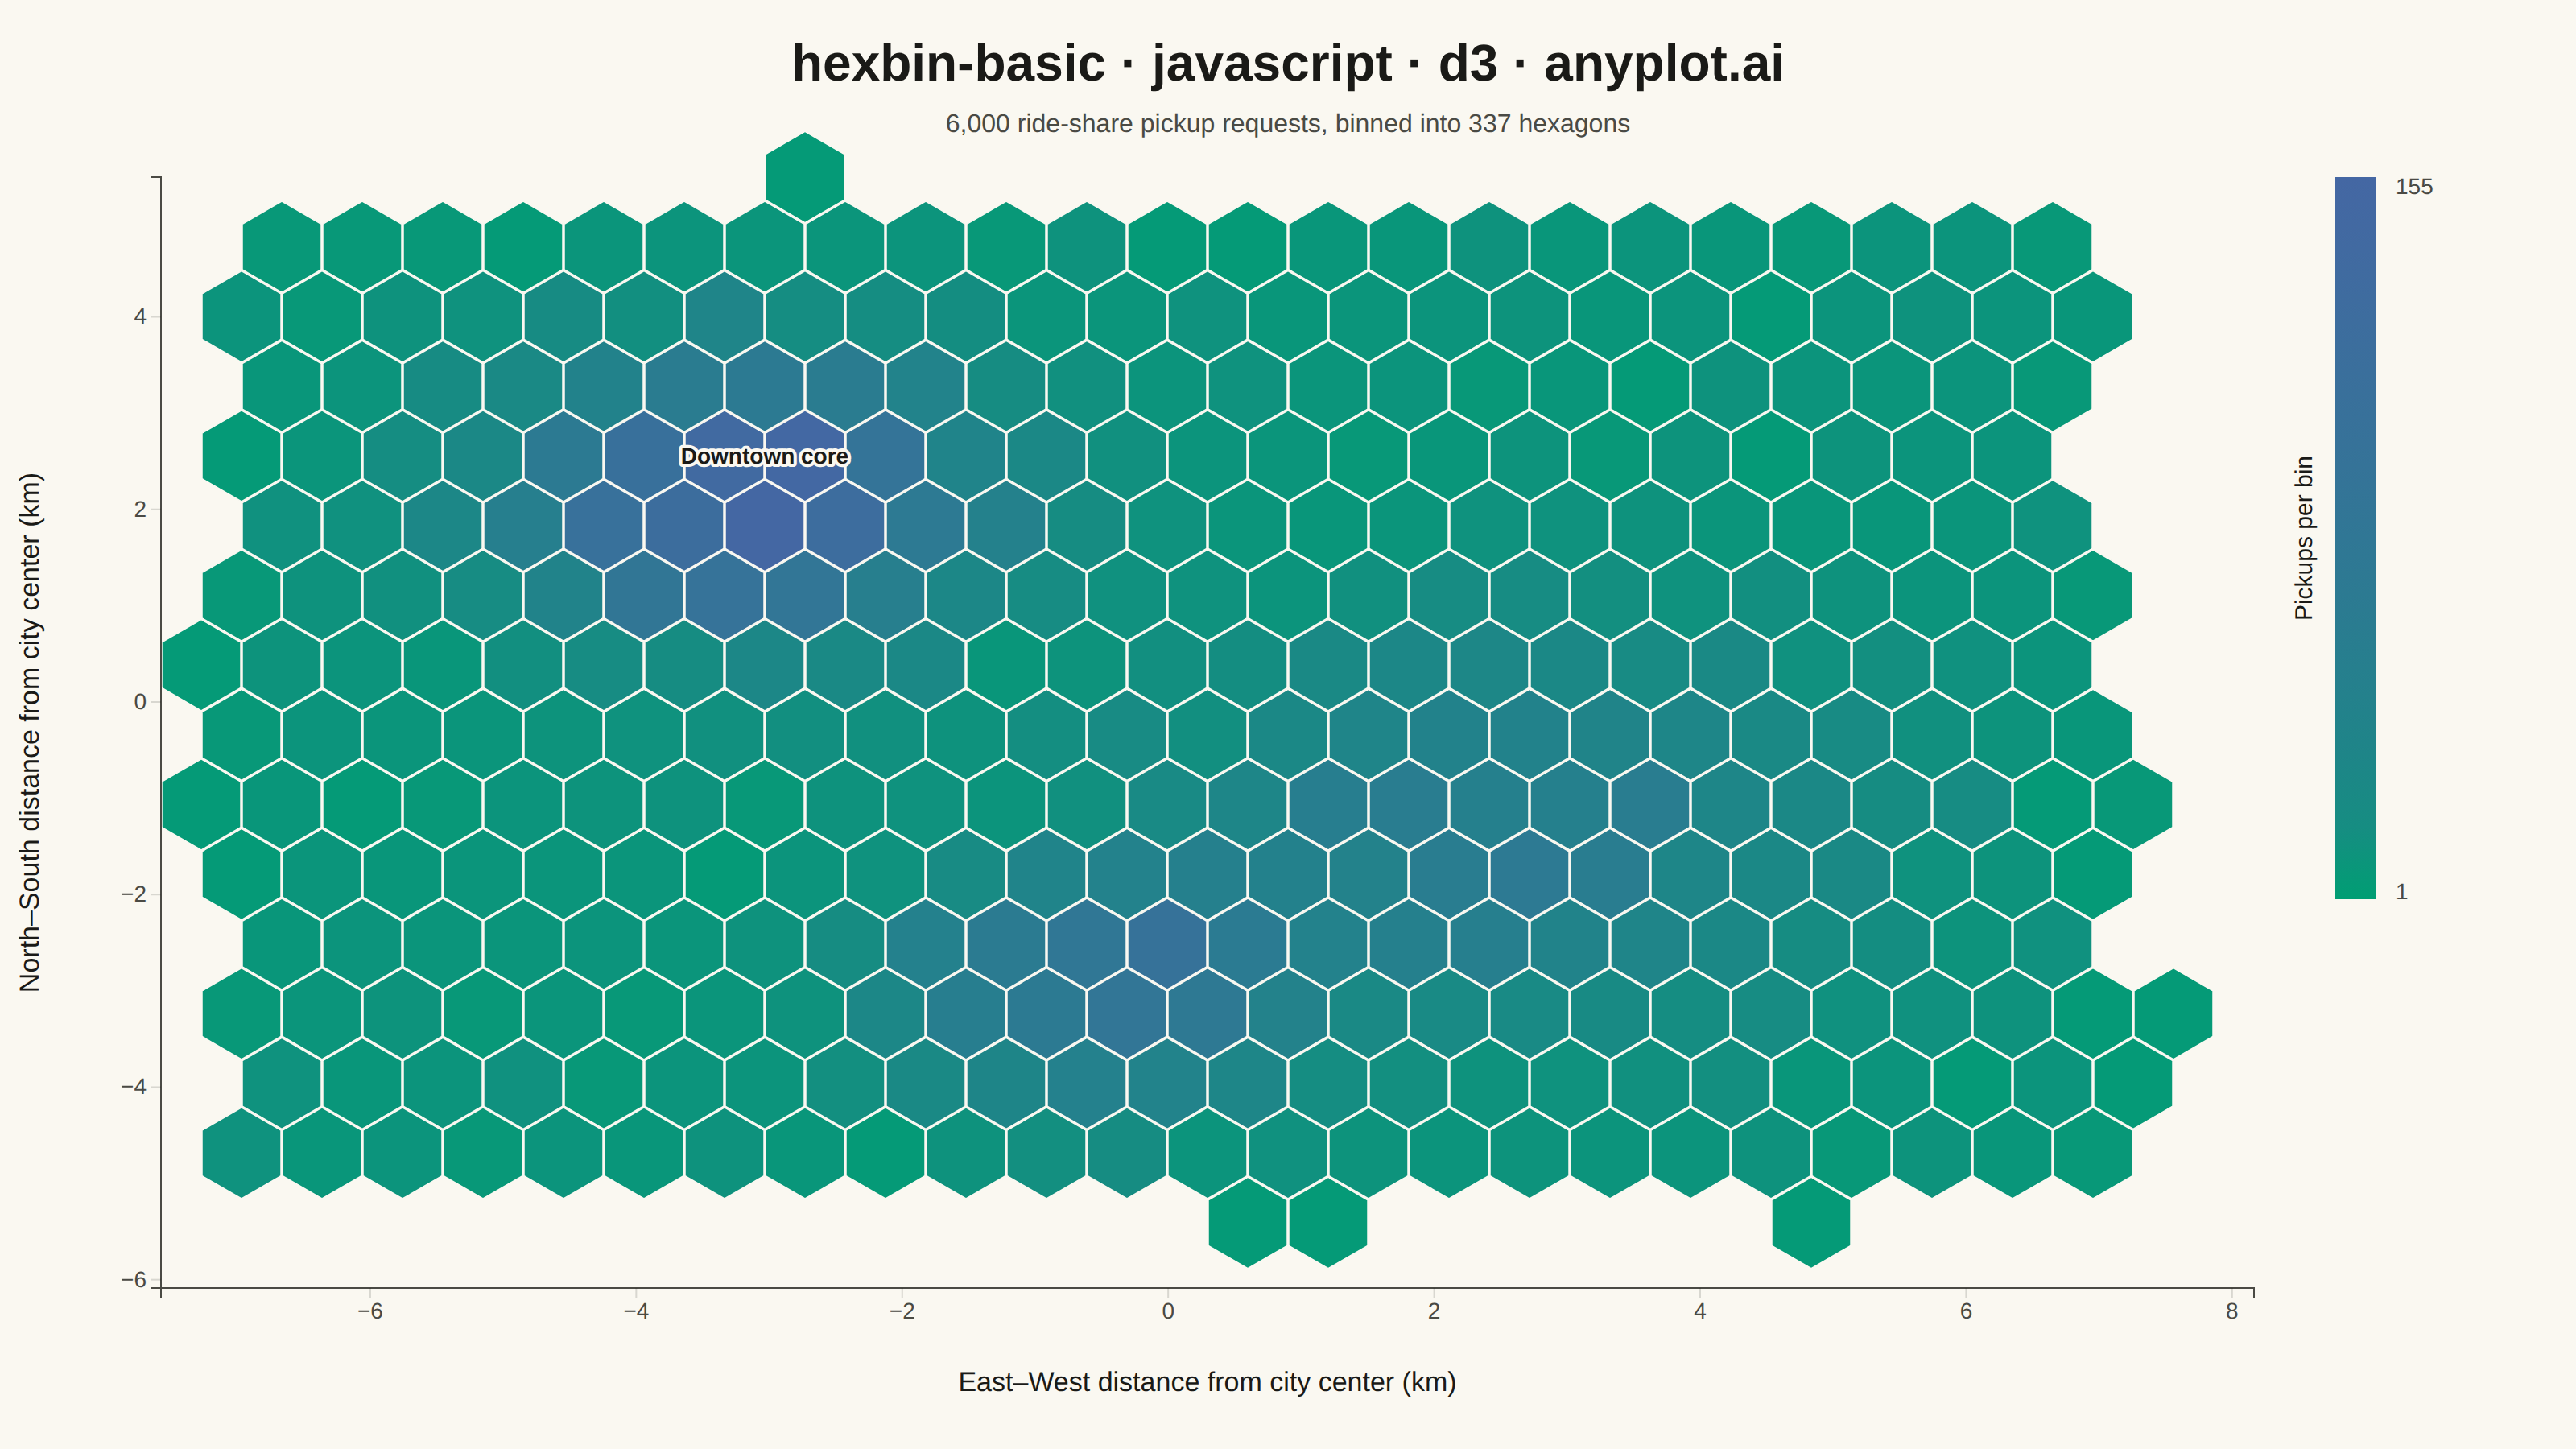
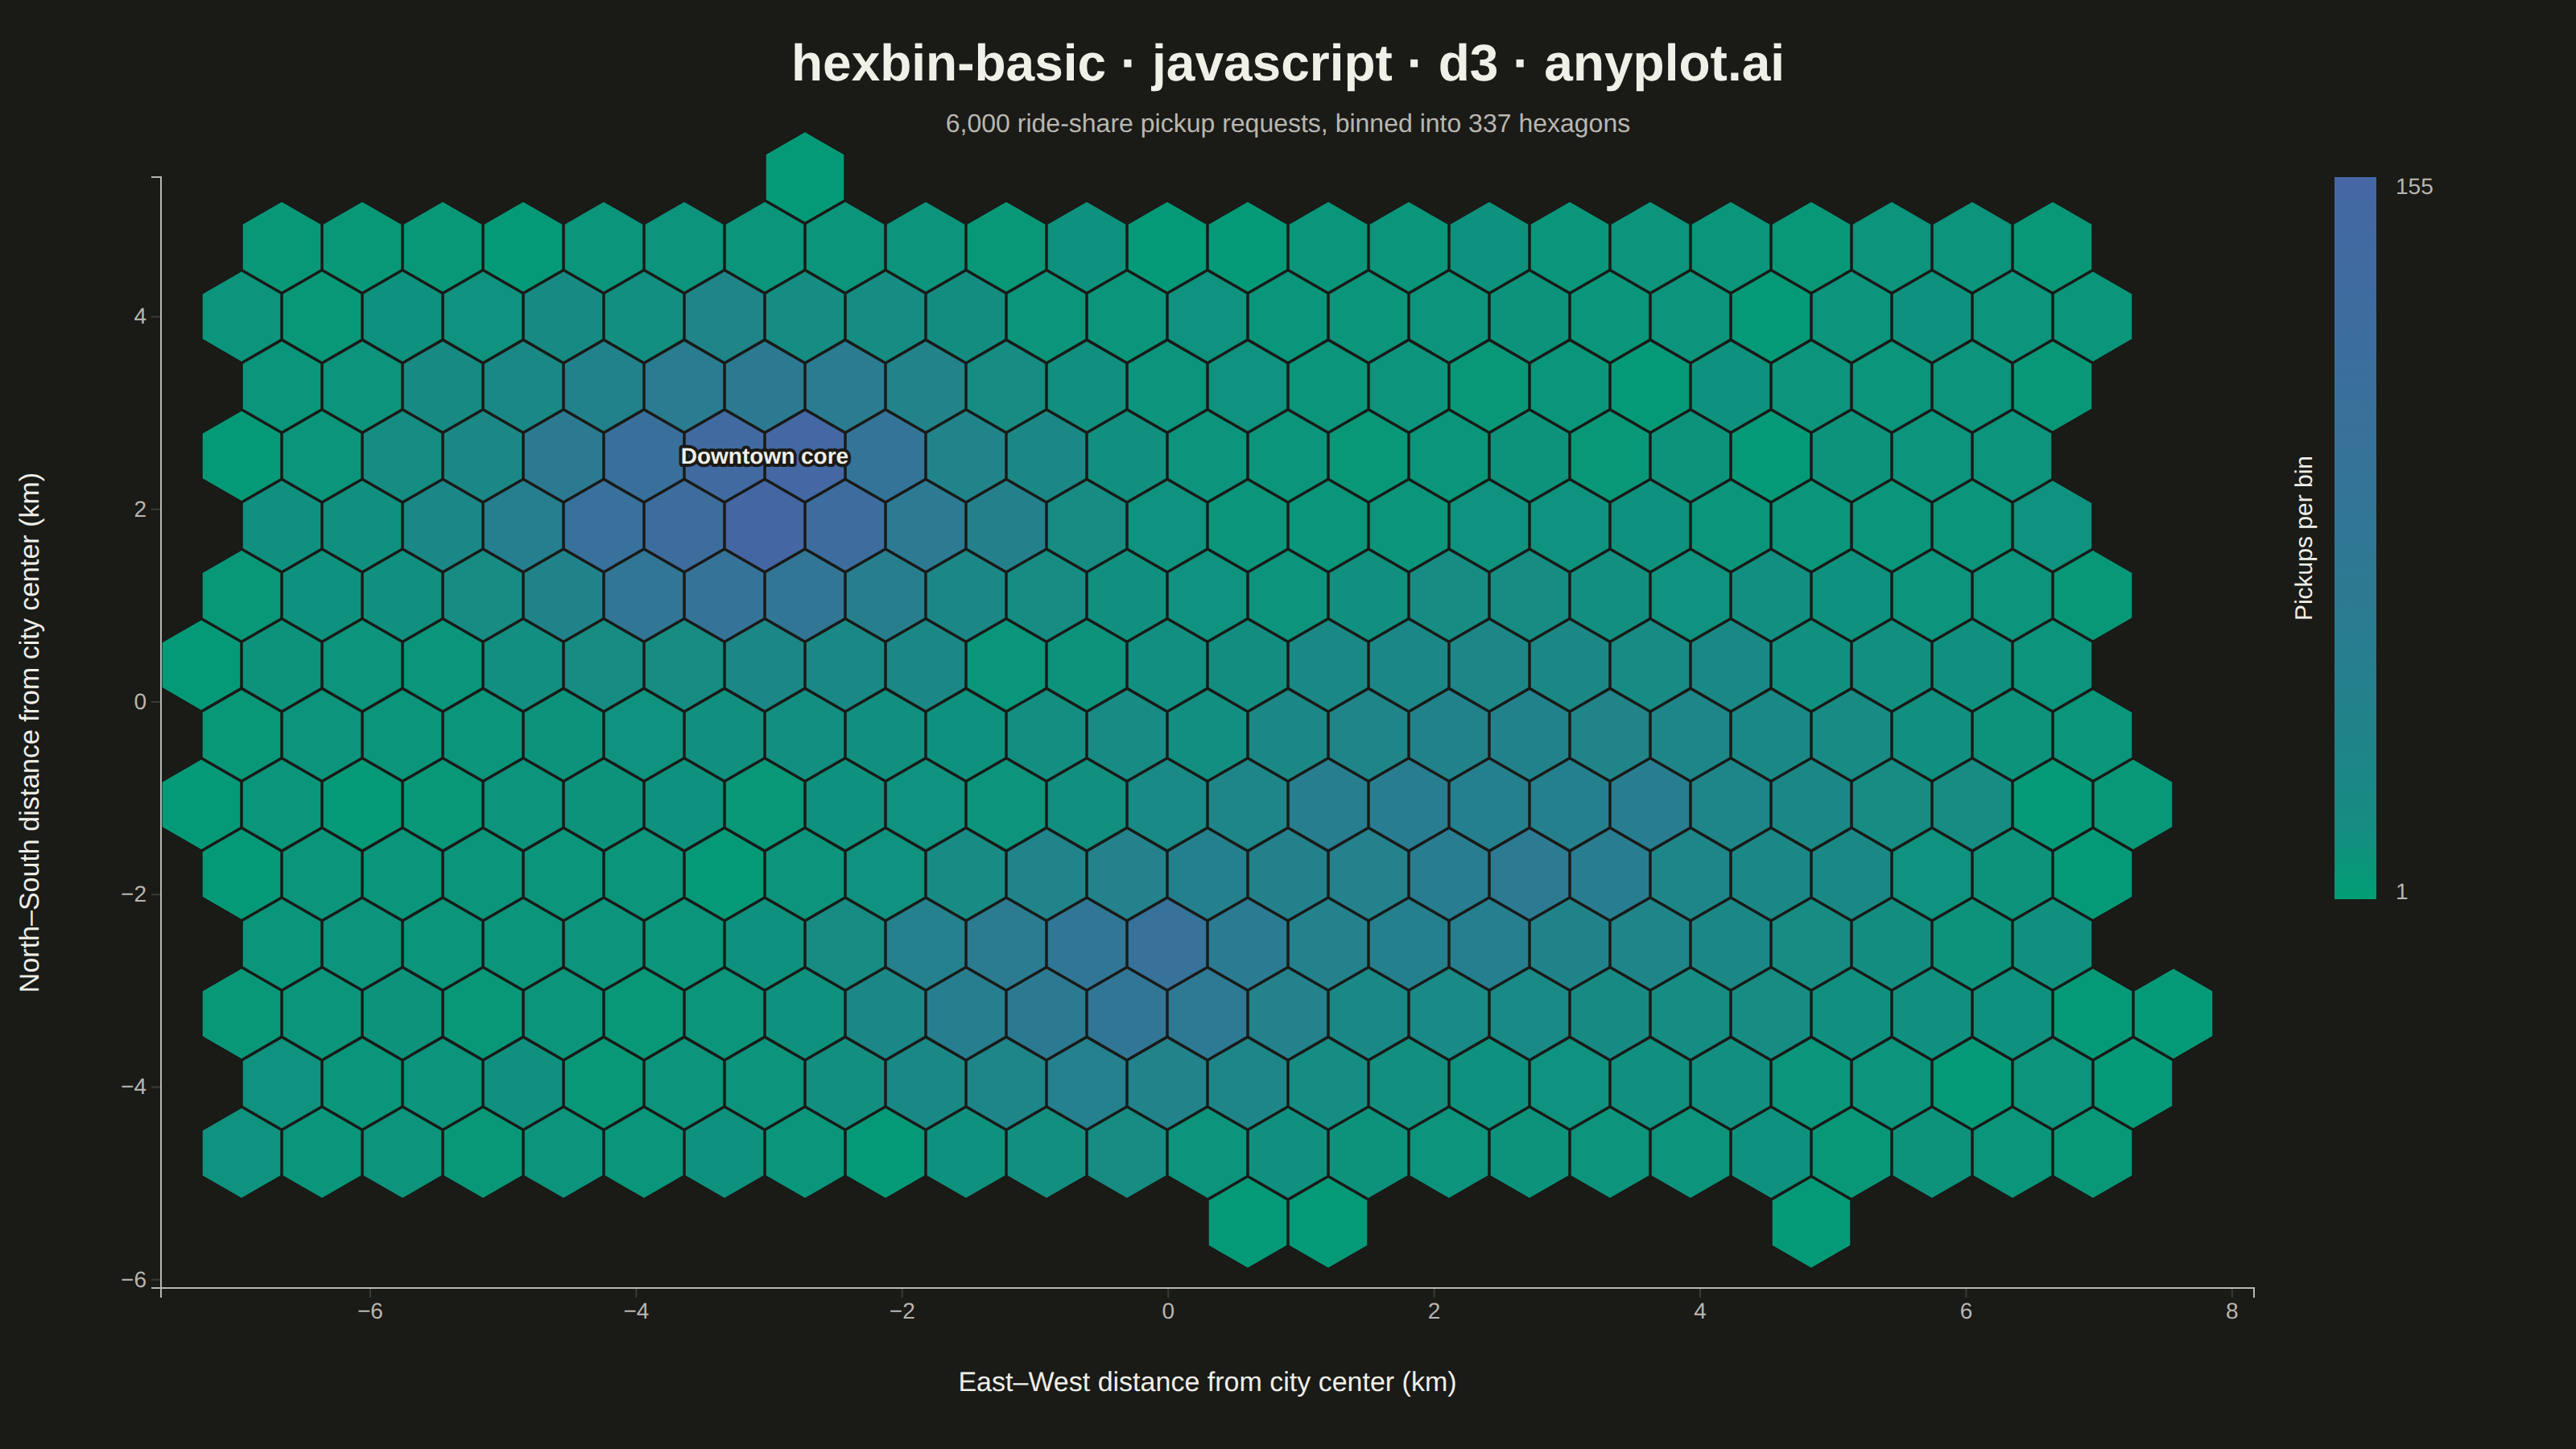
The same plot in 14 other libraries — JavaScript: Chart.js, Apache ECharts, Highcharts, MUI X Charts; Python: Altair, Bokeh, lets-plot, Matplotlib, Plotly, plotnine, Pygal, Seaborn; R: ggplot2; Julia: Makie.jl. Compare all 15 side by side: Basic Hexbin Plot in Python, R, Julia and JavaScript.
A hexagonal binning plot that visualizes the density of 2D point data by aggregating points into hexagonal bins. The color intensity of each hexagon represents the count of points within it, making it ideal for revealing density patterns in large datasets where traditional scatter plots would show overlapping points. Hexagonal bins provide better visual representation than square pixels due to their isotropy (equal distance to neighboring cells in all directions).
// anyplot.ai
// hexbin-basic: Basic Hexbin Plot
// Library: d3 7.9.0 | JavaScript 22.23.2
// Quality: 93/100 | Created: 2026-08-25

const t = window.ANYPLOT_TOKENS;
const { width, height } = window.ANYPLOT_SIZE;

// --- Tiny fixed-seed LCG + Box-Muller (no seeded RNG in the browser) -------
let seed = 42;
const rand = () => {
  seed = (seed * 1664525 + 1013904223) % 4294967296;
  return seed / 4294967296;
};
const randNormal = () => {
  const u1 = Math.max(rand(), 1e-9);
  const u2 = rand();
  return Math.sqrt(-2 * Math.log(u1)) * Math.cos(2 * Math.PI * u2);
};

// --- Data: ride-share pickup requests across a metro area (km from center) -
const clusters = [
  { cx: -3.2, cy: 2.1, sx: 1.1, sy: 0.9, n: 2200 }, // downtown core
  { cx: 2.6, cy: -1.4, sx: 1.6, sy: 1.3, n: 1600 }, // transit hub
  { cx: -0.5, cy: -3.0, sx: 0.9, sy: 0.7, n: 900 }, // stadium district
];
const points = [];
for (const c of clusters) {
  for (let i = 0; i < c.n; i++) {
    points.push([c.cx + randNormal() * c.sx, c.cy + randNormal() * c.sy]);
  }
}
// Diffuse background demand across the wider metro area.
for (let i = 0; i < 1300; i++) {
  points.push([(rand() * 2 - 1) * 7, (rand() * 2 - 1) * 5]);
}

// --- Layout -------------------------------------------------------------
const margin = { top: 110, right: 200, bottom: 100, left: 100 };
const iw = width - margin.left - margin.right;
const ih = height - margin.top - margin.bottom;

// --- Scales ---------------------------------------------------------------
const [x0, x1] = d3.extent(points, (d) => d[0]);
const [y0, y1] = d3.extent(points, (d) => d[1]);
const xPad = (x1 - x0) * 0.04;
const yPad = (y1 - y0) * 0.04;
const x = d3.scaleLinear().domain([x0 - xPad, x1 + xPad]).range([0, iw]);
const y = d3.scaleLinear().domain([y0 - yPad, y1 + yPad]).range([ih, 0]);

// --- Hexagonal binning ------------------------------------------------------
// Bins run on pixel space (after x/y scaling), using a pointy-top axial hex
// grid: convert each point to fractional axial (q, r), then round to the
// nearest hex via cube-coordinate rounding (the standard technique for
// snapping to the closest hexagon center on a regular grid).
const gridSize = 26; // hexagons across the plot width — controls bin resolution
const hexRadius = iw / gridSize / Math.sqrt(3);

const cubeRound = (xf, yf, zf) => {
  let rx = Math.round(xf);
  let ry = Math.round(yf);
  let rz = Math.round(zf);
  const dx = Math.abs(rx - xf);
  const dy = Math.abs(ry - yf);
  const dz = Math.abs(rz - zf);
  if (dx > dy && dx > dz) rx = -ry - rz;
  else if (dy > dz) ry = -rx - rz;
  else rz = -rx - ry;
  return [rx, rz]; // axial (q, r)
};
const pixelToHex = (px, py) => {
  const qf = ((Math.sqrt(3) / 3) * px - py / 3) / hexRadius;
  const rf = ((2 / 3) * py) / hexRadius;
  return cubeRound(qf, -qf - rf, rf);
};
const hexCenter = (q, r) => [hexRadius * Math.sqrt(3) * (q + r / 2), hexRadius * 1.5 * r];
const hexPath = (cx, cy, r) => {
  const pts = d3.range(6).map((i) => {
    const angle = (Math.PI / 180) * (60 * i - 30);
    return [cx + r * Math.cos(angle), cy + r * Math.sin(angle)];
  });
  return `M${pts.map((p) => p.join(",")).join("L")}Z`;
};

const counts = new Map();
for (const [px, py] of points) {
  const [q, r] = pixelToHex(x(px), y(py));
  const key = `${q},${r}`;
  counts.set(key, (counts.get(key) || 0) + 1);
}
const bins = Array.from(counts, ([key, count]) => {
  const [q, r] = key.split(",").map(Number);
  const [cx, cy] = hexCenter(q, r);
  return { cx, cy, count };
});
const maxCount = d3.max(bins, (d) => d.count);

// Sqrt-transformed domain so the single densest hexagon doesn't swamp the
// scale (the spec's "consider log scale when density varies widely"); sqrt is
// preferred over log here because bin counts start at 1 (log(1) = 0 would
// collapse the low end of the ramp) and the count range (1-155) is moderate
// enough that sqrt already spreads it well without a log's extreme low-end stretch.
const colorScale = d3.scaleSequential(d3.interpolateRgbBasis(t.seq)).domain([0, Math.sqrt(maxCount)]);
const hotspot = bins.reduce((best, d) => (d.count > best.count ? d : best), bins[0]);

// --- SVG mount --------------------------------------------------------------
const svg = d3.select("#container").append("svg").attr("width", width).attr("height", height);
const g = svg.append("g").attr("transform", `translate(${margin.left},${margin.top})`);

const drawRadius = hexRadius * 0.98; // hairline gap between neighboring hexes
g.selectAll(".hex")
  .data(bins)
  .join("path")
  .attr("class", "hex")
  .attr("d", (d) => hexPath(d.cx, d.cy, drawRadius))
  .attr("fill", (d) => colorScale(Math.sqrt(d.count)))
  .attr("stroke", t.pageBg)
  .attr("stroke-width", 0.75);

// Direct on-chart label for the densest hexagon (the "downtown core" cluster),
// with a page-background halo stroke so it reads over any hex fill color.
g.append("text")
  .attr("x", hotspot.cx)
  .attr("y", hotspot.cy - drawRadius - 10)
  .attr("text-anchor", "middle")
  .attr("fill", t.ink)
  .style("font-size", "14px")
  .style("font-weight", "600")
  .style("paint-order", "stroke")
  .attr("stroke", t.pageBg)
  .attr("stroke-width", 4)
  .attr("stroke-linejoin", "round")
  .text("Downtown core");

// --- Axes -------------------------------------------------------------------
const xAxis = g.append("g").attr("transform", `translate(0,${ih})`).call(d3.axisBottom(x).ticks(8));
const yAxis = g.append("g").call(d3.axisLeft(y).ticks(6));
for (const ax of [xAxis, yAxis]) {
  ax.selectAll("text").attr("fill", t.inkSoft).style("font-size", "14px");
  ax.selectAll("line").attr("stroke", t.grid);
  ax.select(".domain").attr("stroke", t.inkSoft);
}

g.append("text")
  .attr("x", iw / 2)
  .attr("y", ih + 64)
  .attr("text-anchor", "middle")
  .attr("fill", t.ink)
  .style("font-size", "17px")
  .text("East–West distance from city center (km)");

svg
  .append("text")
  .attr("transform", "rotate(-90)")
  .attr("x", -(margin.top + ih / 2))
  .attr("y", 24)
  .attr("text-anchor", "middle")
  .attr("fill", t.ink)
  .style("font-size", "17px")
  .text("North–South distance from city center (km)");

// --- Color legend: vertical Imprint-seq gradient bar -----------------------
const legendX = margin.left + iw + 50;
const legendTop = margin.top;
const legendH = ih * 0.65;
const legendW = 26;

const grad = svg
  .append("defs")
  .append("linearGradient")
  .attr("id", "hexbin-seq")
  .attr("x1", "0%")
  .attr("y1", "100%")
  .attr("x2", "0%")
  .attr("y2", "0%");
d3.range(0, 101, 10).forEach((p) => {
  grad.append("stop").attr("offset", `${p}%`).attr("stop-color", colorScale(Math.sqrt(maxCount * (p / 100))));
});

svg.append("rect").attr("x", legendX).attr("y", legendTop).attr("width", legendW).attr("height", legendH).attr("fill", "url(#hexbin-seq)");
svg
  .append("text")
  .attr("x", legendX + legendW + 12)
  .attr("y", legendTop)
  .attr("dominant-baseline", "hanging")
  .attr("fill", t.inkSoft)
  .style("font-size", "14px")
  .text(maxCount.toLocaleString());
svg
  .append("text")
  .attr("x", legendX + legendW + 12)
  .attr("y", legendTop + legendH)
  .attr("fill", t.inkSoft)
  .style("font-size", "14px")
  .text("1");
svg
  .append("text")
  .attr("transform", `translate(${legendX - 14}, ${legendTop + legendH / 2}) rotate(-90)`)
  .attr("text-anchor", "middle")
  .attr("fill", t.ink)
  .style("font-size", "15px")
  .text("Pickups per bin");

// --- Title & subtitle ---------------------------------------------------
svg
  .append("text")
  .attr("x", width / 2)
  .attr("y", 50)
  .attr("text-anchor", "middle")
  .attr("fill", t.ink)
  .style("font-size", "32px")
  .style("font-weight", "600")
  .text("hexbin-basic · javascript · d3 · anyplot.ai");

svg
  .append("text")
  .attr("x", width / 2)
  .attr("y", 82)
  .attr("text-anchor", "middle")
  .attr("fill", t.inkSoft)
  .style("font-size", "16px")
  .text(`${points.length.toLocaleString()} ride-share pickup requests, binned into ${bins.length} hexagons`);
Runnable source as JSON, for any HTTP client: https://api.anyplot.ai/specs/hexbin-basic/d3/code. Any spec id and library id listed in llms-full.txt fit the same URL shape; every URL below is complete and callable.
{
  "spec_id": "hexbin-basic",
  "language": "javascript",
  "library": "d3",
  "page": "https://anyplot.ai/hexbin-basic/javascript/d3",
  "hub": "https://anyplot.ai/hexbin-basic",
  "code_json": "https://api.anyplot.ai/specs/hexbin-basic/d3/code",
  "spec_json": "https://api.anyplot.ai/specs/hexbin-basic",
  "render_light_png": "https://storage.googleapis.com/anyplot-images/plots/hexbin-basic/javascript/d3/plot-light.png",
  "render_dark_png": "https://storage.googleapis.com/anyplot-images/plots/hexbin-basic/javascript/d3/plot-dark.png",
  "interactive_light_html": "https://storage.googleapis.com/anyplot-images/plots/hexbin-basic/javascript/d3/plot-light.html",
  "interactive_dark_html": "https://storage.googleapis.com/anyplot-images/plots/hexbin-basic/javascript/d3/plot-dark.html",
  "quality_score": 93.0,
  "license": "MIT",
  "guide": "https://anyplot.ai/llms.txt"
}
Part of Basic Hexbin Plot on anyplot.ai.