The same plot in 14 other libraries — JavaScript: Chart.js, D3.js, Apache ECharts, Highcharts; Python: Altair, Bokeh, lets-plot, Matplotlib, Plotly, plotnine, Pygal, Seaborn; R: ggplot2; Julia: Makie.jl. Compare all 15 side by side: Basic Hexbin Plot in Python, R, Julia and JavaScript.
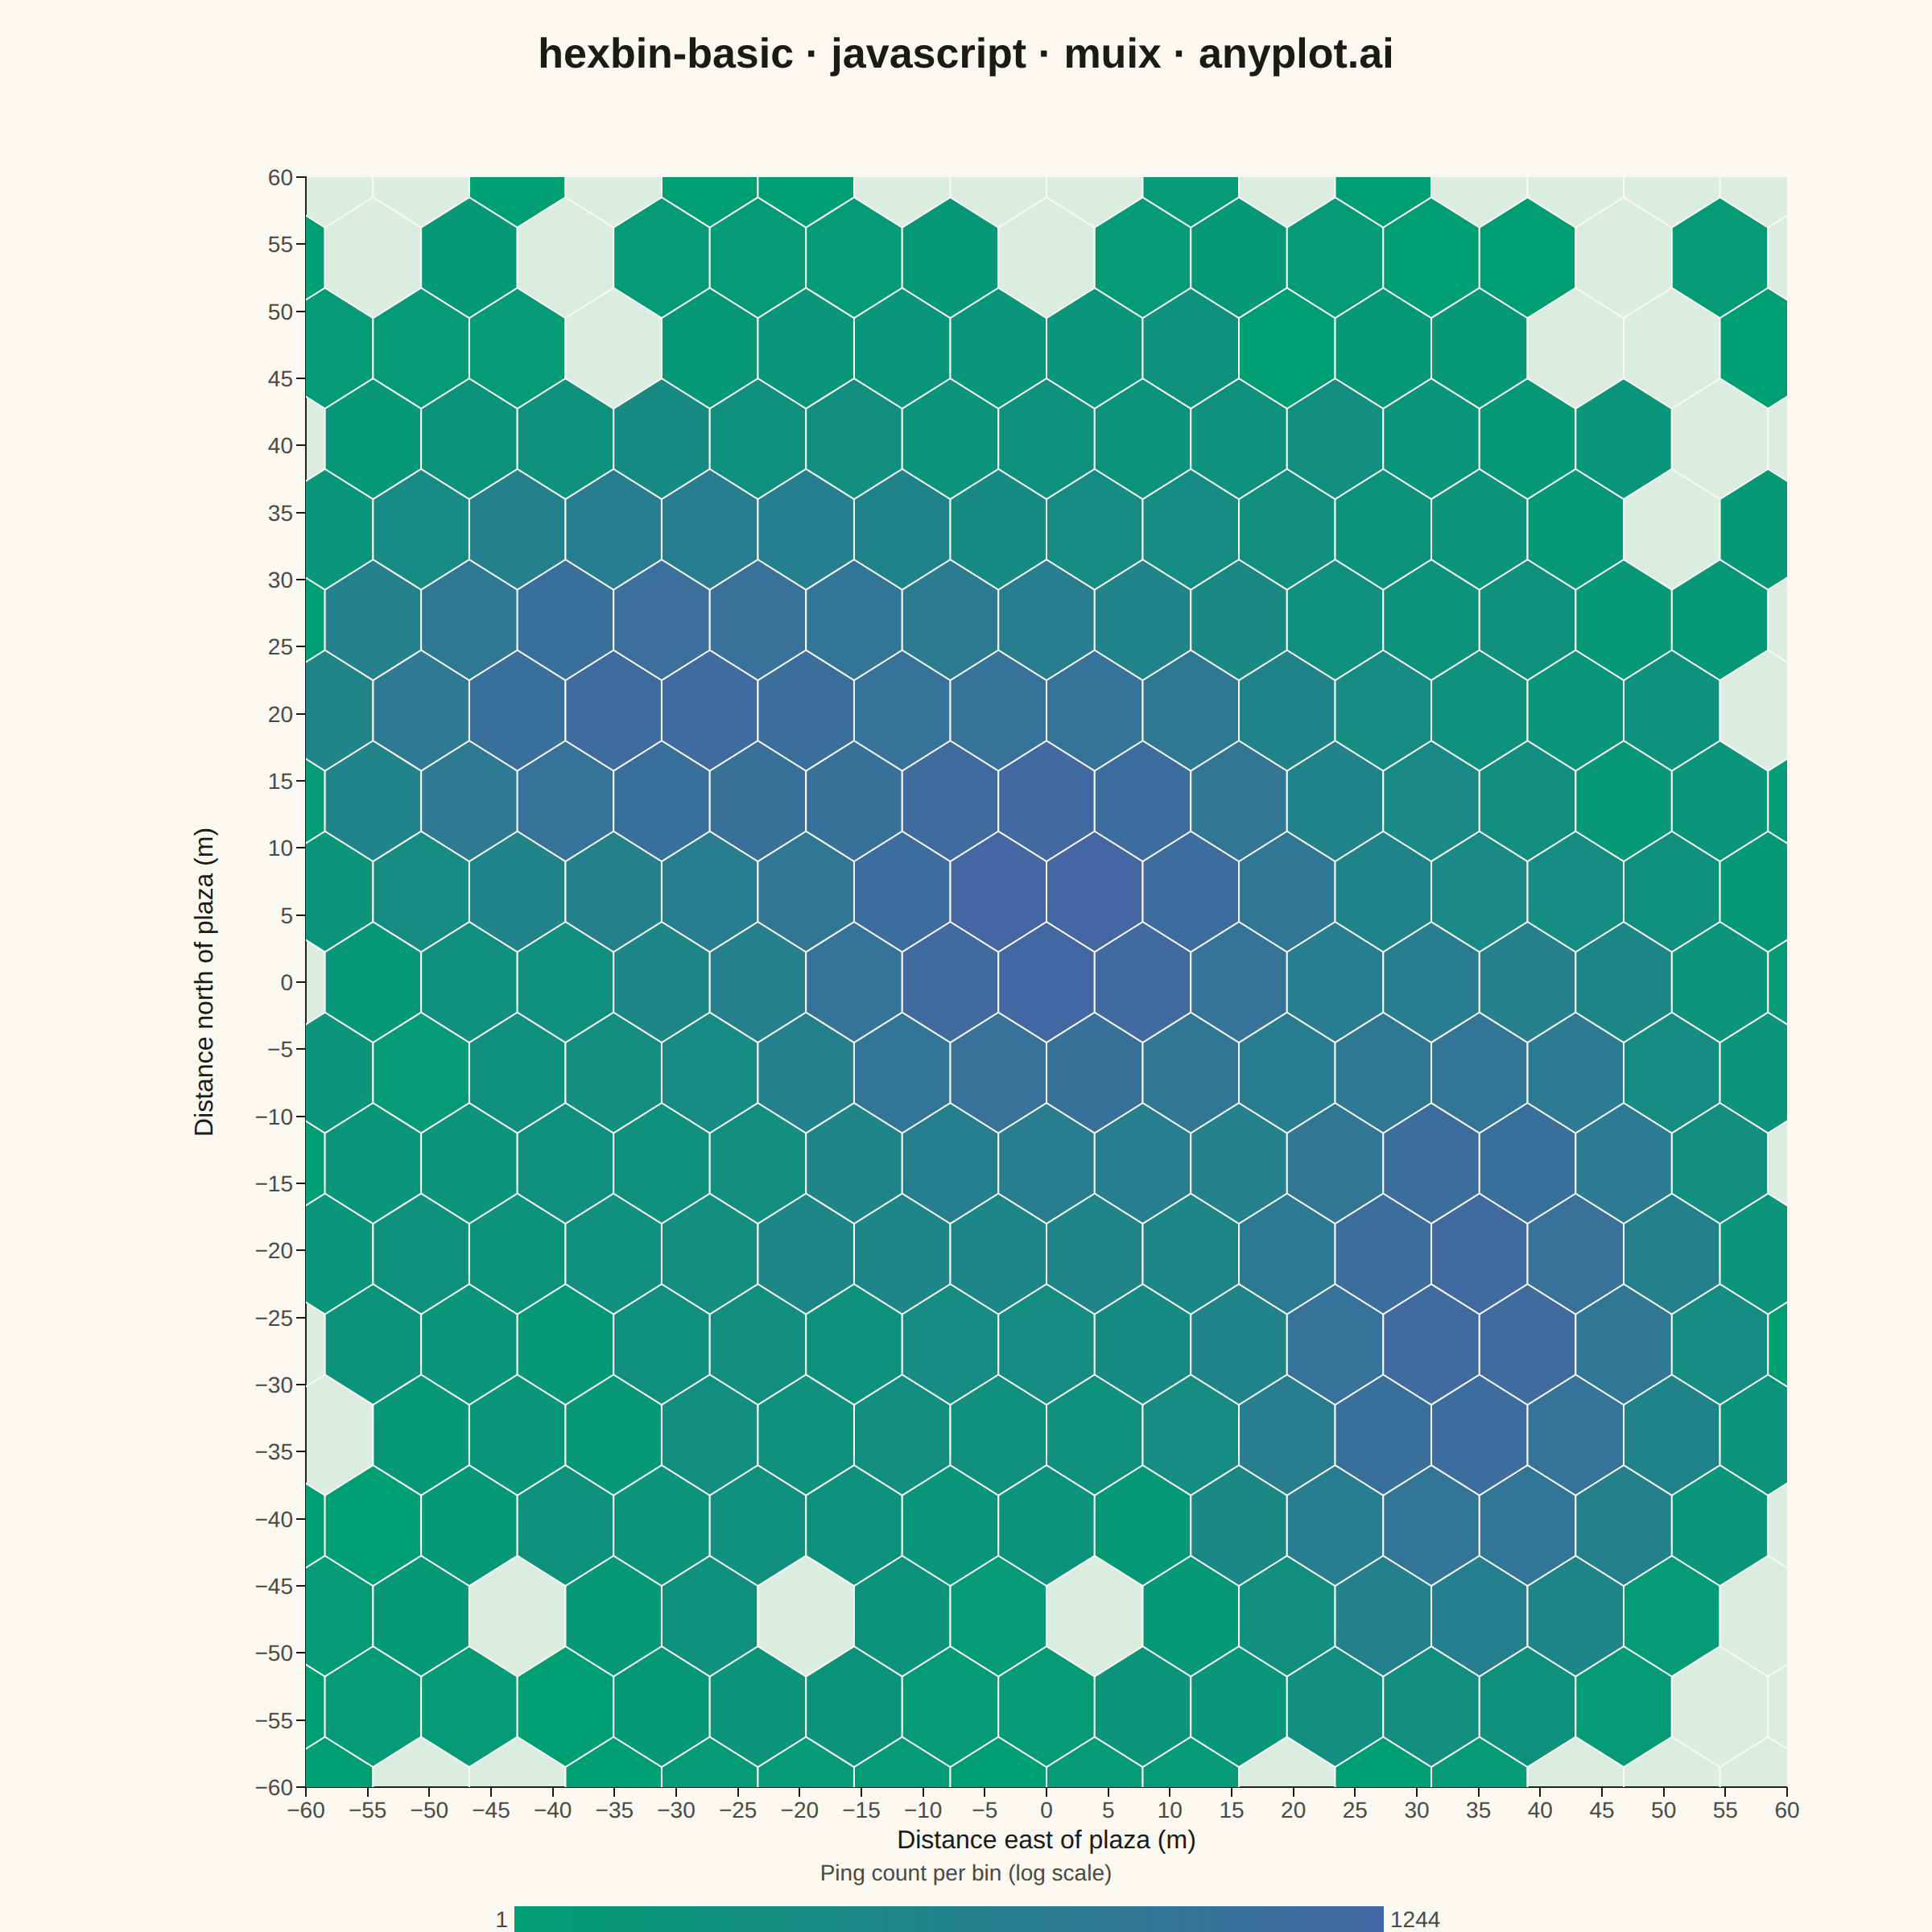
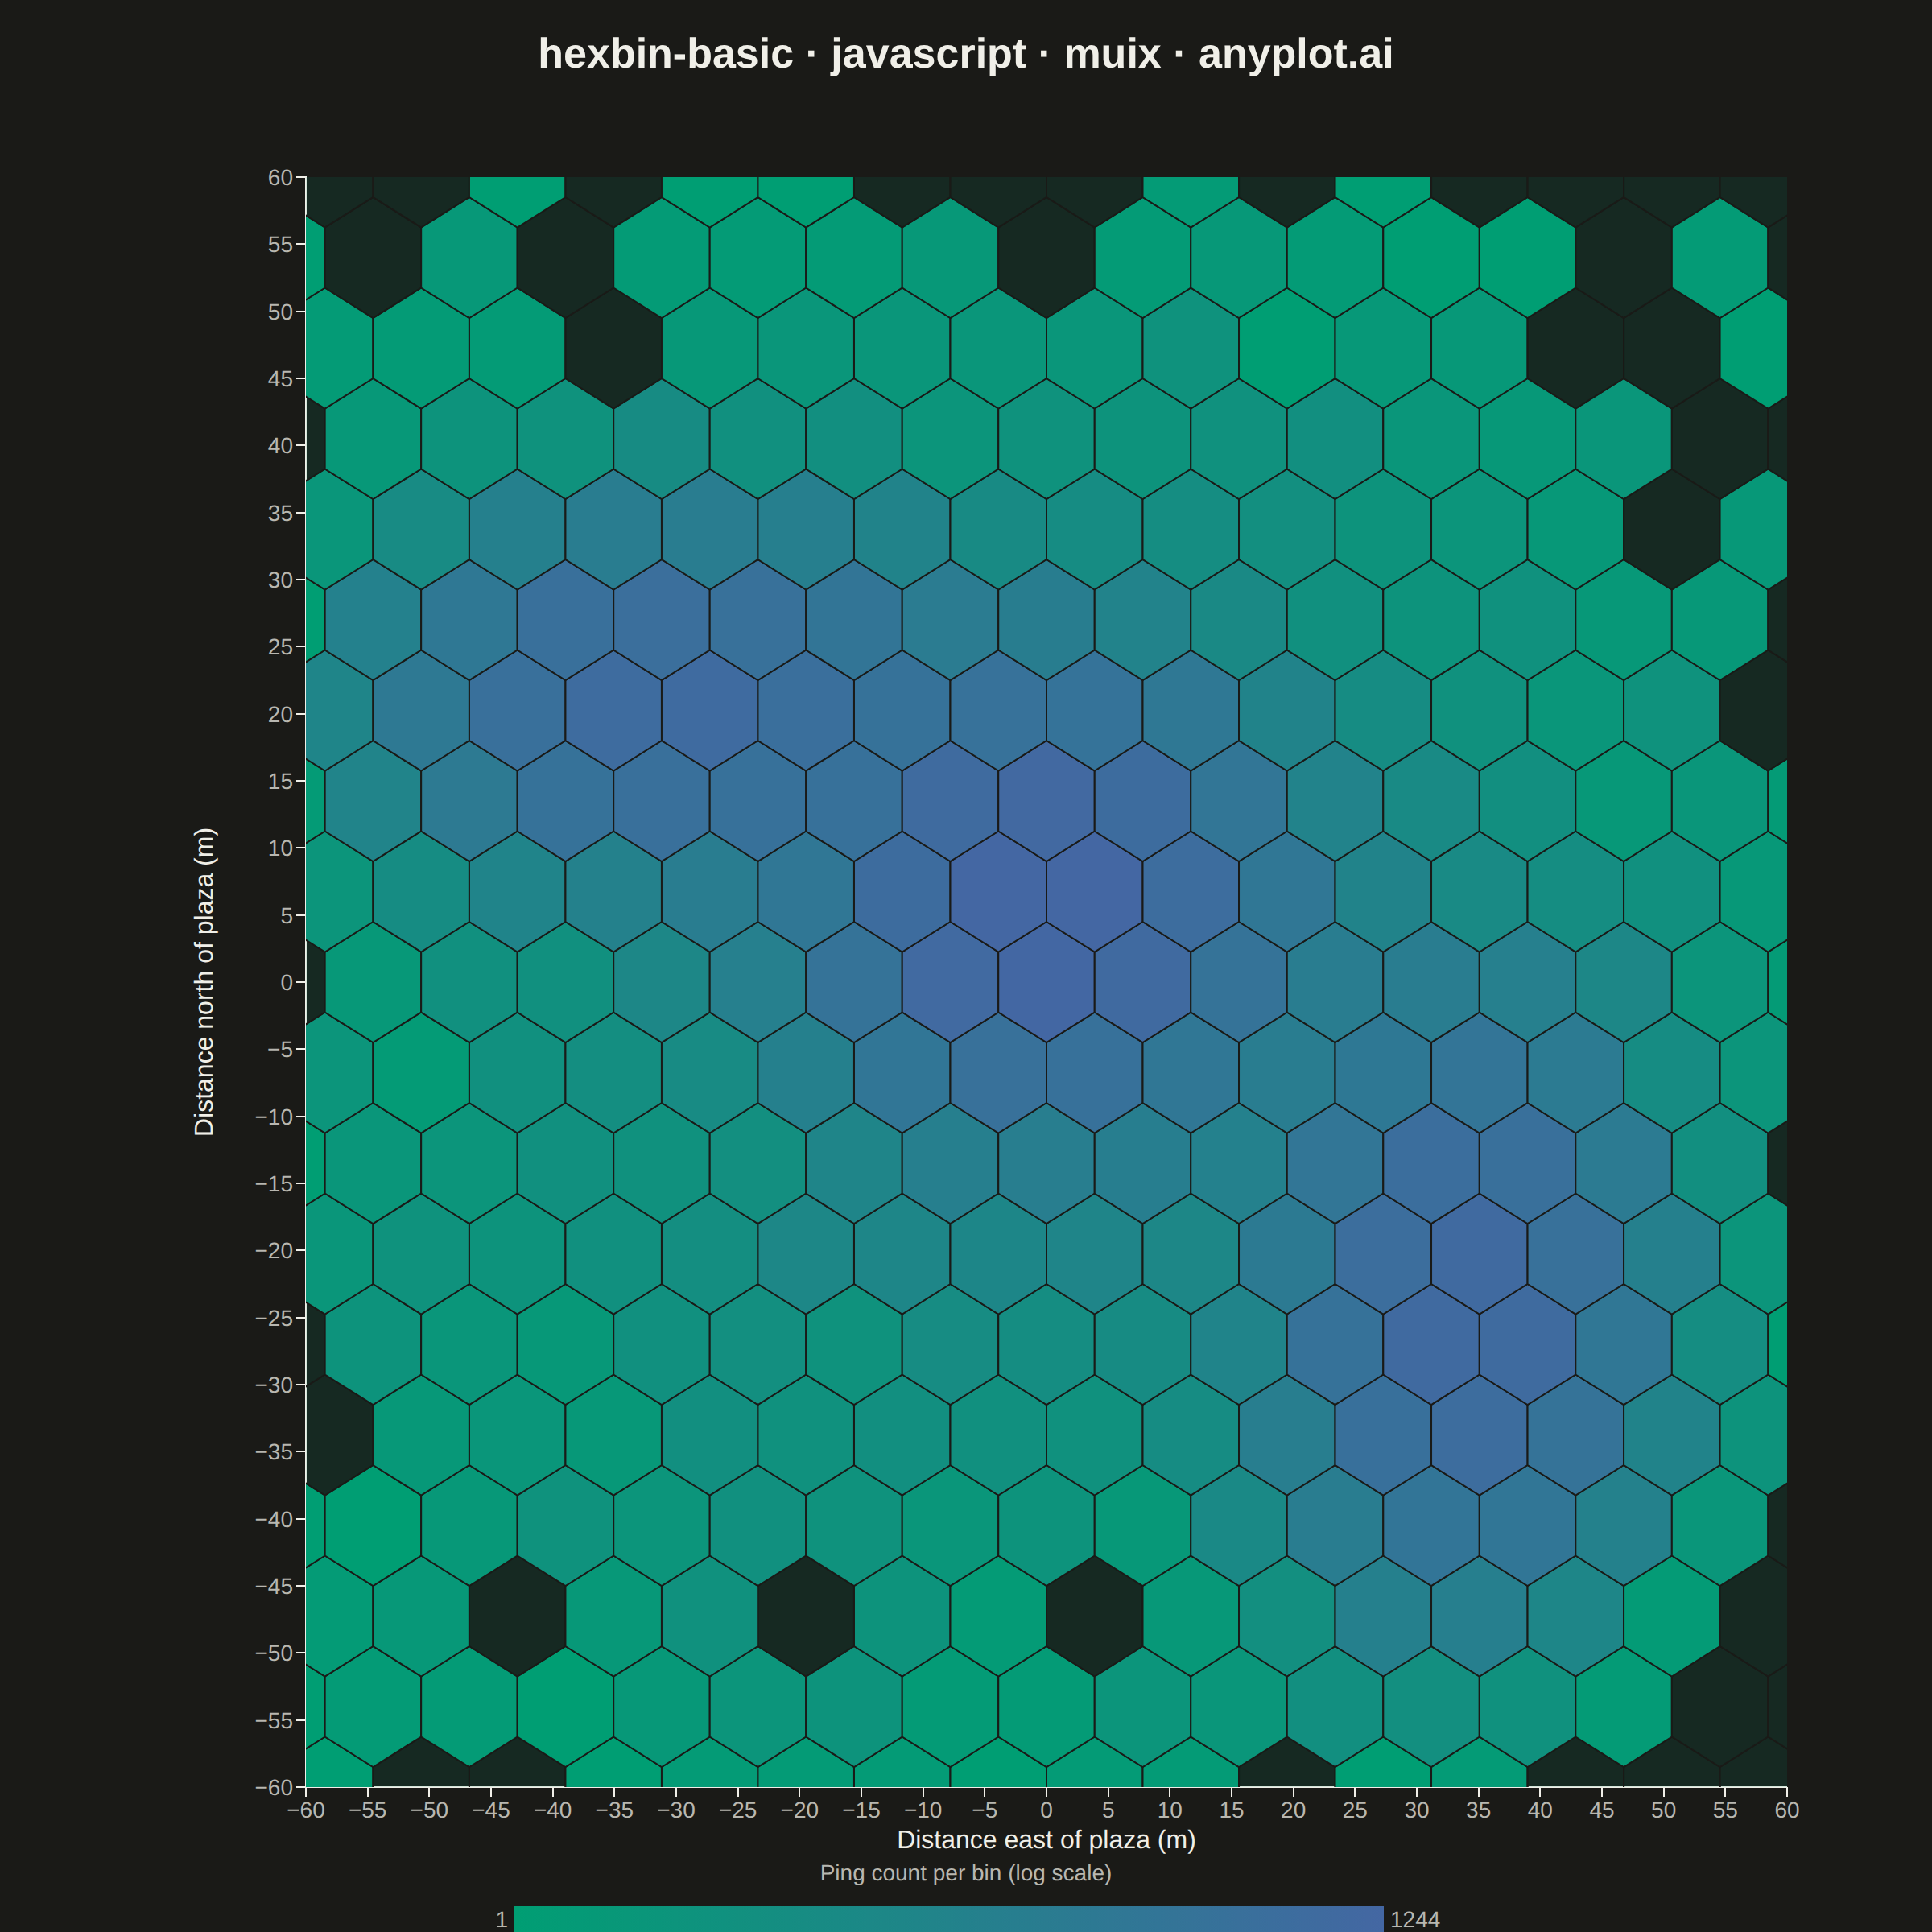
A hexagonal binning plot that visualizes the density of 2D point data by aggregating points into hexagonal bins. The color intensity of each hexagon represents the count of points within it, making it ideal for revealing density patterns in large datasets where traditional scatter plots would show overlapping points. Hexagonal bins provide better visual representation than square pixels due to their isotropy (equal distance to neighboring cells in all directions).
// anyplot.ai
// hexbin-basic: Basic Hexbin Plot
// Library: muix 7.29.1 | JavaScript 22.23.2
// Quality: 88/100 | Created: 2026-08-25
//# anyplot-orientation: square
// anyplot.ai
// hexbin-basic: Basic Hexbin Plot
// Library: MUI X Charts | React | Node 22
// License: @mui/x-charts — MIT (community). Pro/Premium are out of scope.
// Quality: pending | Created: 2026-08-25
import { ScatterChart } from "@mui/x-charts/ScatterChart";
import { ContinuousColorLegend } from "@mui/x-charts/ChartsLegend";
import Box from "@mui/material/Box";
import Typography from "@mui/material/Typography";

const t = window.ANYPLOT_TOKENS;

// Deterministic LCG (seed 42) — no Math.random() in the browser harness
function makeLcg(seed) {
  let state = seed >>> 0;
  return () => {
    state = (Math.imul(state, 1664525) + 1013904223) >>> 0;
    return state / 4294967296;
  };
}
const rng = makeLcg(42);

// Box-Muller standard normal draw, fed by the LCG above.
function gaussian() {
  const u1 = Math.max(rng(), 1e-9);
  const u2 = rng();
  return Math.sqrt(-2 * Math.log(u1)) * Math.cos(2 * Math.PI * u2);
}

// --- Data: pedestrian GPS pings across a city district ---------------------
// Three named foot-traffic hotspots plus a wide, low-weight ambient cluster
// standing in for baseline city-wide movement — the kind of dataset where a
// scatter plot degenerates into a solid smear of overlapping points and a
// hexbin is the tool that recovers the density structure.
const DOMAIN = 60; // both axes span [-DOMAIN, DOMAIN] meters from the plaza
const CLUSTERS = [
  { cx: 0, cy: 6, sx: 9, sy: 8, weight: 0.42 }, // Central Plaza
  { cx: 34, cy: -24, sx: 7, sy: 10, weight: 0.28 }, // Transit Hub
  { cx: -31, cy: 21, sx: 11, sy: 6, weight: 0.22 }, // Waterfront Promenade
  { cx: 0, cy: 0, sx: 30, sy: 26, weight: 0.08 }, // Ambient foot traffic
];

const POINT_COUNT = 30000;
const points = [];
let attempts = 0;
while (points.length < POINT_COUNT && attempts < POINT_COUNT * 4) {
  attempts += 1;
  const r = rng();
  let acc = 0;
  let cluster = CLUSTERS[CLUSTERS.length - 1];
  for (let c = 0; c < CLUSTERS.length; c += 1) {
    acc += CLUSTERS[c].weight;
    if (r <= acc) {
      cluster = CLUSTERS[c];
      break;
    }
  }
  const x = cluster.cx + gaussian() * cluster.sx;
  const y = cluster.cy + gaussian() * cluster.sy;
  if (Math.abs(x) > DOMAIN || Math.abs(y) > DOMAIN) continue;
  points.push({ x, y });
}

// --- Hexagonal binning -------------------------------------------------
// HEX_RADIUS (data-space units) is the hexbin equivalent of a "gridsize"
// knob: smaller radius -> more, smaller hexagons; larger radius -> coarser,
// smoother density. Offset-grid math follows the standard flat/pointy-top
// hexbin layout (as used by d3-hexbin): columns spaced `r*sqrt(3)` apart,
// rows spaced `1.5r` apart, odd rows offset by half a column.
const HEX_RADIUS = 4.5;
const hexDx = HEX_RADIUS * Math.sqrt(3);
const hexDy = HEX_RADIUS * 1.5;

function hexBin(rawPoints) {
  const binsById = new Map();
  rawPoints.forEach(({ x: px, y: py }) => {
    const py1 = py / hexDy;
    let pj = Math.round(py1);
    let px1 = px / hexDx - (pj & 1) / 2;
    let pi = Math.round(px1);
    const py2 = py1 - pj;
    if (Math.abs(py2) * 3 > 1) {
      const px2 = px1 - pi;
      const pi2 = pi + (px1 < pi ? -1 : 1) / 2;
      const pj2 = pj + (py1 < pj ? -1 : 1);
      const px3 = px1 - pi2;
      const py3 = py2 - pj2;
      if (px2 * px2 + py2 * py2 > px3 * px3 + py3 * py3) {
        pi = pi2 + (pj & 1 ? 1 : -1) / 2;
        pj = pj2;
      }
    }
    const id = `${pi}-${pj}`;
    const existing = binsById.get(id);
    if (existing) {
      existing.count += 1;
    } else {
      binsById.set(id, {
        id,
        cx: (pi + (pj & 1) / 2) * hexDx,
        cy: pj * hexDy,
        count: 1,
      });
    }
  });
  return Array.from(binsById.values());
}

const hexBins = hexBin(points);
const binCountMax = Math.max(...hexBins.map((b) => b.count));
const binCountMin = Math.min(...hexBins.map((b) => b.count));

// Color on a log scale — a handful of hotspot bins vastly outnumber the
// sparse fringe bins, so log contrast separates the density tiers far
// better than a linear ramp would.
const colorDomainMin = Math.log1p(binCountMin);
const colorDomainMax = Math.log1p(binCountMax);

// Every hex cell that overlaps the domain, occupied or not — filling in the
// zero-count cells (instead of only plotting occupied bins) avoids blank
// "swiss cheese" gaps in the sparse fringe; empty cells get a faint fixed
// tint below instead of participating in the log-count color scale.
function fullHexGrid() {
  const cells = [];
  const rowPad = 1;
  const pjMin = Math.floor(-DOMAIN / hexDy) - rowPad;
  const pjMax = Math.ceil(DOMAIN / hexDy) + rowPad;
  for (let pj = pjMin; pj <= pjMax; pj += 1) {
    const offset = (pj & 1) / 2;
    const piMin = Math.floor(-DOMAIN / hexDx - offset) - rowPad;
    const piMax = Math.ceil(DOMAIN / hexDx - offset) + rowPad;
    for (let pi = piMin; pi <= piMax; pi += 1) {
      const cx = (pi + (pj & 1) / 2) * hexDx;
      const cy = pj * hexDy;
      if (Math.abs(cx) > DOMAIN + HEX_RADIUS || Math.abs(cy) > DOMAIN + HEX_RADIUS) continue;
      cells.push({ id: `${pi}-${pj}`, cx, cy });
    }
  }
  return cells;
}

const occupiedById = new Map(hexBins.map((bin) => [bin.id, bin]));
const hexBinPoints = fullHexGrid().map((cell) => {
  const occupied = occupiedById.get(cell.id);
  const count = occupied ? occupied.count : 0;
  return {
    id: cell.id,
    x: cell.cx,
    y: cell.cy,
    z: count > 0 ? Math.log1p(count) : colorDomainMin,
    isEmpty: count === 0,
  };
});

// Community @mui/x-charts has no hexbin/heatmap component (Pro-only) — a
// ScatterChart with a custom hexagon-path marker, positioned from the
// underlying linear scales, reproduces a true hexagonal tiling instead of
// circular bubbles.
function HexCell(props) {
  const { series, xScale, yScale, colorGetter, color } = props;
  const radiusX = Math.abs(xScale(HEX_RADIUS) - xScale(0));
  const radiusY = Math.abs(yScale(HEX_RADIUS) - yScale(0));

  // Bins whose data-space center lands just past [-DOMAIN, DOMAIN] (the
  // offset hex grid doesn't align exactly to the axis edge) would otherwise
  // draw over the axis ticks/labels — clip the whole layer to the plot's own
  // drawing rect, read straight from the scales' pixel ranges.
  const [xr0, xr1] = xScale.range();
  const [yr0, yr1] = yScale.range();
  const clipX = Math.min(xr0, xr1);
  const clipY = Math.min(yr0, yr1);
  const clipWidth = Math.abs(xr1 - xr0);
  const clipHeight = Math.abs(yr1 - yr0);

  return (
    <g clipPath="url(#hexbin-plot-clip)">
      <defs>
        <clipPath id="hexbin-plot-clip">
          <rect x={clipX} y={clipY} width={clipWidth} height={clipHeight} />
        </clipPath>
      </defs>
      {series.data.map((point, i) => {
        const ccx = xScale(point.x);
        const ccy = yScale(point.y);
        let d = "";
        for (let k = 0; k < 6; k += 1) {
          const angle = (k * Math.PI) / 3;
          const vx = ccx + Math.sin(angle) * radiusX;
          const vy = ccy - Math.cos(angle) * radiusY;
          d += `${k === 0 ? "M" : "L"}${vx},${vy}`;
        }
        return (
          <path
            key={point.id}
            d={`${d}Z`}
            fill={point.isEmpty ? t.seq[0] : colorGetter ? colorGetter(i) : color}
            fillOpacity={point.isEmpty ? 0.12 : 1}
            stroke={t.pageBg}
            strokeWidth={1}
          />
        );
      })}
    </g>
  );
}

// --- Chart (default-exported component — the harness mounts it) -----------
export default function Chart() {
  const { width, height } = window.ANYPLOT_SIZE;
  const titleHeight = 70;

  return (
    <Box sx={{ width, height, bgcolor: t.pageBg, display: "flex", flexDirection: "column" }}>
      <Typography
        sx={{
          color: t.ink,
          fontSize: 26,
          fontWeight: 600,
          textAlign: "center",
          lineHeight: 1.2,
          pt: "18px",
          height: titleHeight,
          fontFamily: "inherit",
        }}
      >
        hexbin-basic · javascript · muix · anyplot.ai
      </Typography>
      <Box sx={{ position: "relative", flex: 1 }}>
        <ScatterChart
          width={width}
          height={height - titleHeight}
          series={[
            {
              id: "hex-density",
              type: "scatter",
              data: hexBinPoints,
              label: "Ping count",
              zAxisId: "count",
            },
          ]}
          xAxis={[
            {
              scaleType: "linear",
              min: -DOMAIN,
              max: DOMAIN,
              label: "Distance east of plaza (m)",
              tickLabelStyle: { fontSize: 14, fill: t.inkSoft },
              labelStyle: { fontSize: 16, fill: t.ink },
            },
          ]}
          yAxis={[
            {
              scaleType: "linear",
              min: -DOMAIN,
              max: DOMAIN,
              label: "Distance north of plaza (m)",
              tickFontSize: 42,
              tickLabelStyle: { fontSize: 14, fill: t.inkSoft },
              labelStyle: { fontSize: 16, fill: t.ink },
            },
          ]}
          zAxis={[
            {
              id: "count",
              min: colorDomainMin,
              max: colorDomainMax,
              colorMap: {
                type: "continuous",
                min: colorDomainMin,
                max: colorDomainMax,
                color: [t.seq[0], t.seq[1]],
              },
            },
          ]}
          margin={{ top: 40, right: 90, bottom: 90, left: 190 }}
          slots={{ scatter: HexCell }}
          slotProps={{ legend: { hidden: true } }}
          skipAnimation
        >
          <ContinuousColorLegend
            axisId="count"
            axisDirection="z"
            direction="row"
            position={{ horizontal: "middle", vertical: "bottom" }}
            length="45%"
            thickness={16}
            minLabel={`${binCountMin}`}
            maxLabel={`${binCountMax}`}
            labelStyle={{ fontSize: 14, fill: t.inkSoft, fontFamily: "inherit" }}
          />
        </ScatterChart>
        <Typography
          sx={{
            position: "absolute",
            left: 0,
            right: 0,
            bottom: 26,
            textAlign: "center",
            color: t.inkSoft,
            fontSize: 14,
            fontFamily: "inherit",
          }}
        >
          Ping count per bin (log scale)
        </Typography>
      </Box>
    </Box>
  );
}
Runnable source as JSON, for any HTTP client: https://api.anyplot.ai/specs/hexbin-basic/muix/code. Any spec id and library id listed in llms-full.txt fit the same URL shape; every URL below is complete and callable.
{
  "spec_id": "hexbin-basic",
  "language": "javascript",
  "library": "muix",
  "page": "https://anyplot.ai/hexbin-basic/javascript/muix",
  "hub": "https://anyplot.ai/hexbin-basic",
  "code_json": "https://api.anyplot.ai/specs/hexbin-basic/muix/code",
  "spec_json": "https://api.anyplot.ai/specs/hexbin-basic",
  "render_light_png": "https://storage.googleapis.com/anyplot-images/plots/hexbin-basic/javascript/muix/plot-light.png",
  "render_dark_png": "https://storage.googleapis.com/anyplot-images/plots/hexbin-basic/javascript/muix/plot-dark.png",
  "interactive_light_html": "https://storage.googleapis.com/anyplot-images/plots/hexbin-basic/javascript/muix/plot-light.html",
  "interactive_dark_html": "https://storage.googleapis.com/anyplot-images/plots/hexbin-basic/javascript/muix/plot-dark.html",
  "quality_score": 88.0,
  "license": "MIT",
  "guide": "https://anyplot.ai/llms.txt"
}
Part of Basic Hexbin Plot on anyplot.ai.