The same plot in 14 other libraries — Python: Altair, Bokeh, lets-plot, Matplotlib, Plotly, plotnine, Pygal, Seaborn; R: ggplot2; JavaScript: Chart.js, D3.js, Apache ECharts, Highcharts, MUI X Charts. Compare all 15 side by side: Basic Hexbin Plot in Python, R, Julia and JavaScript.
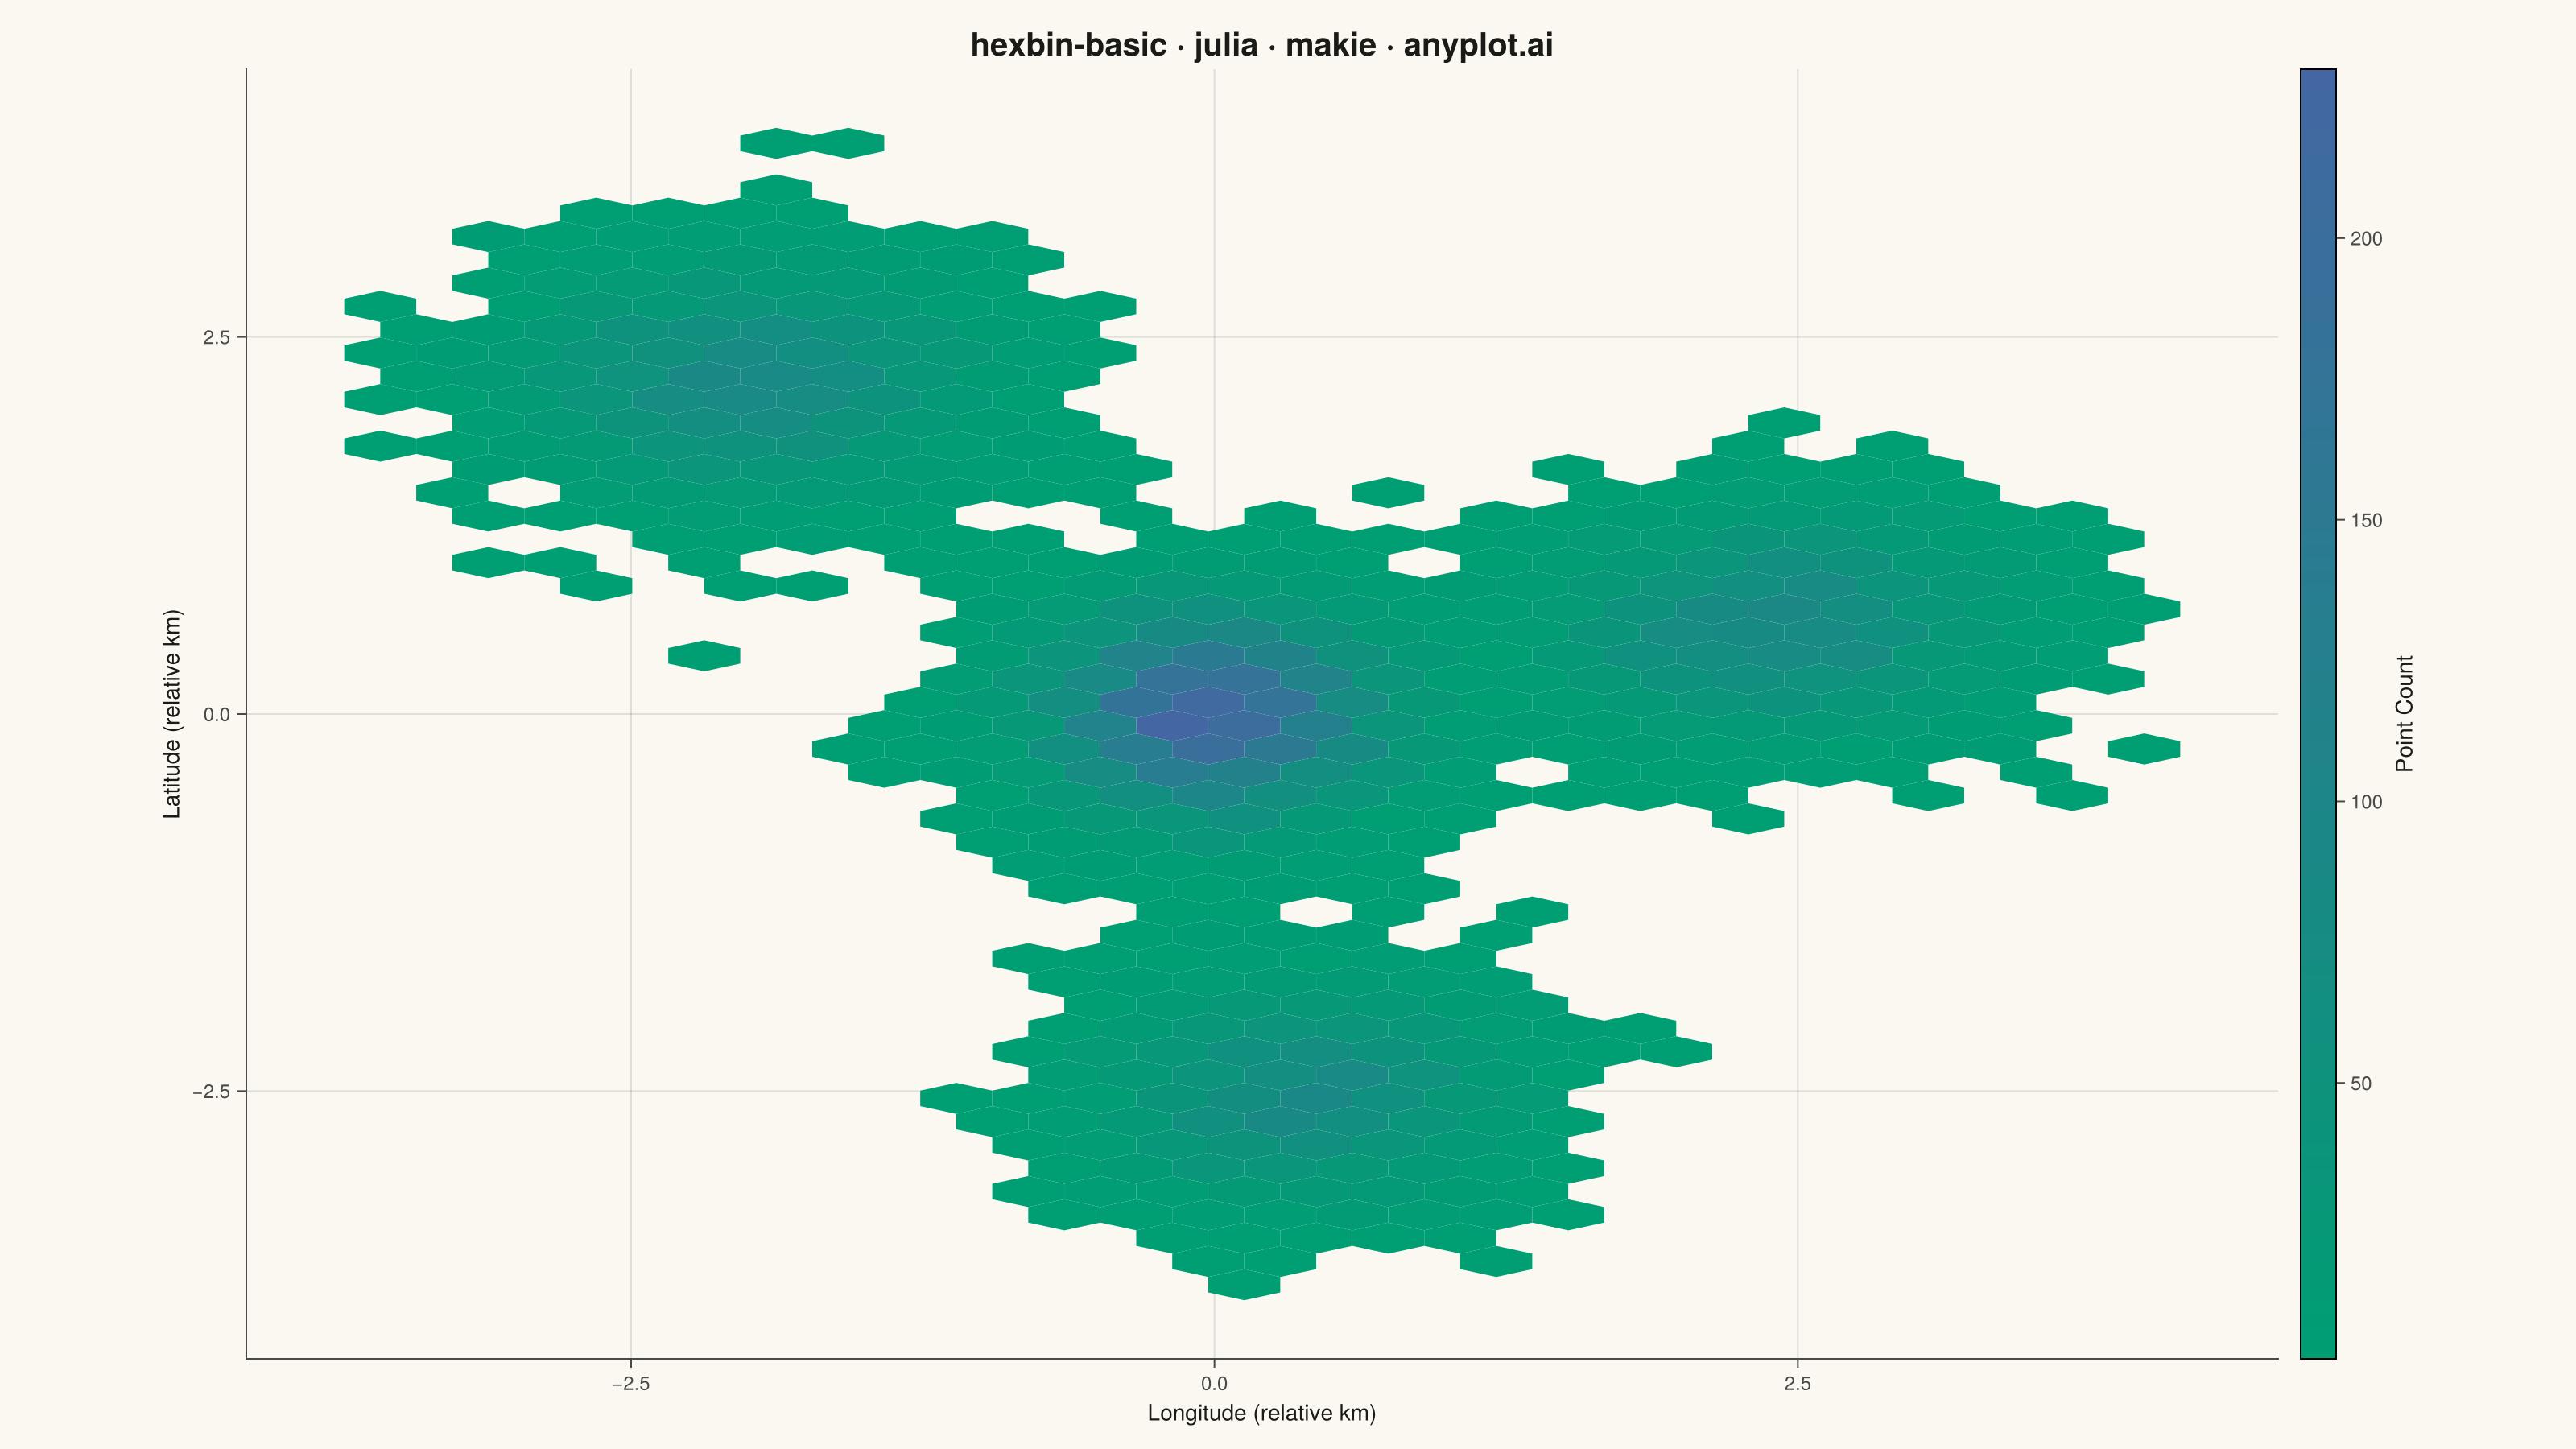
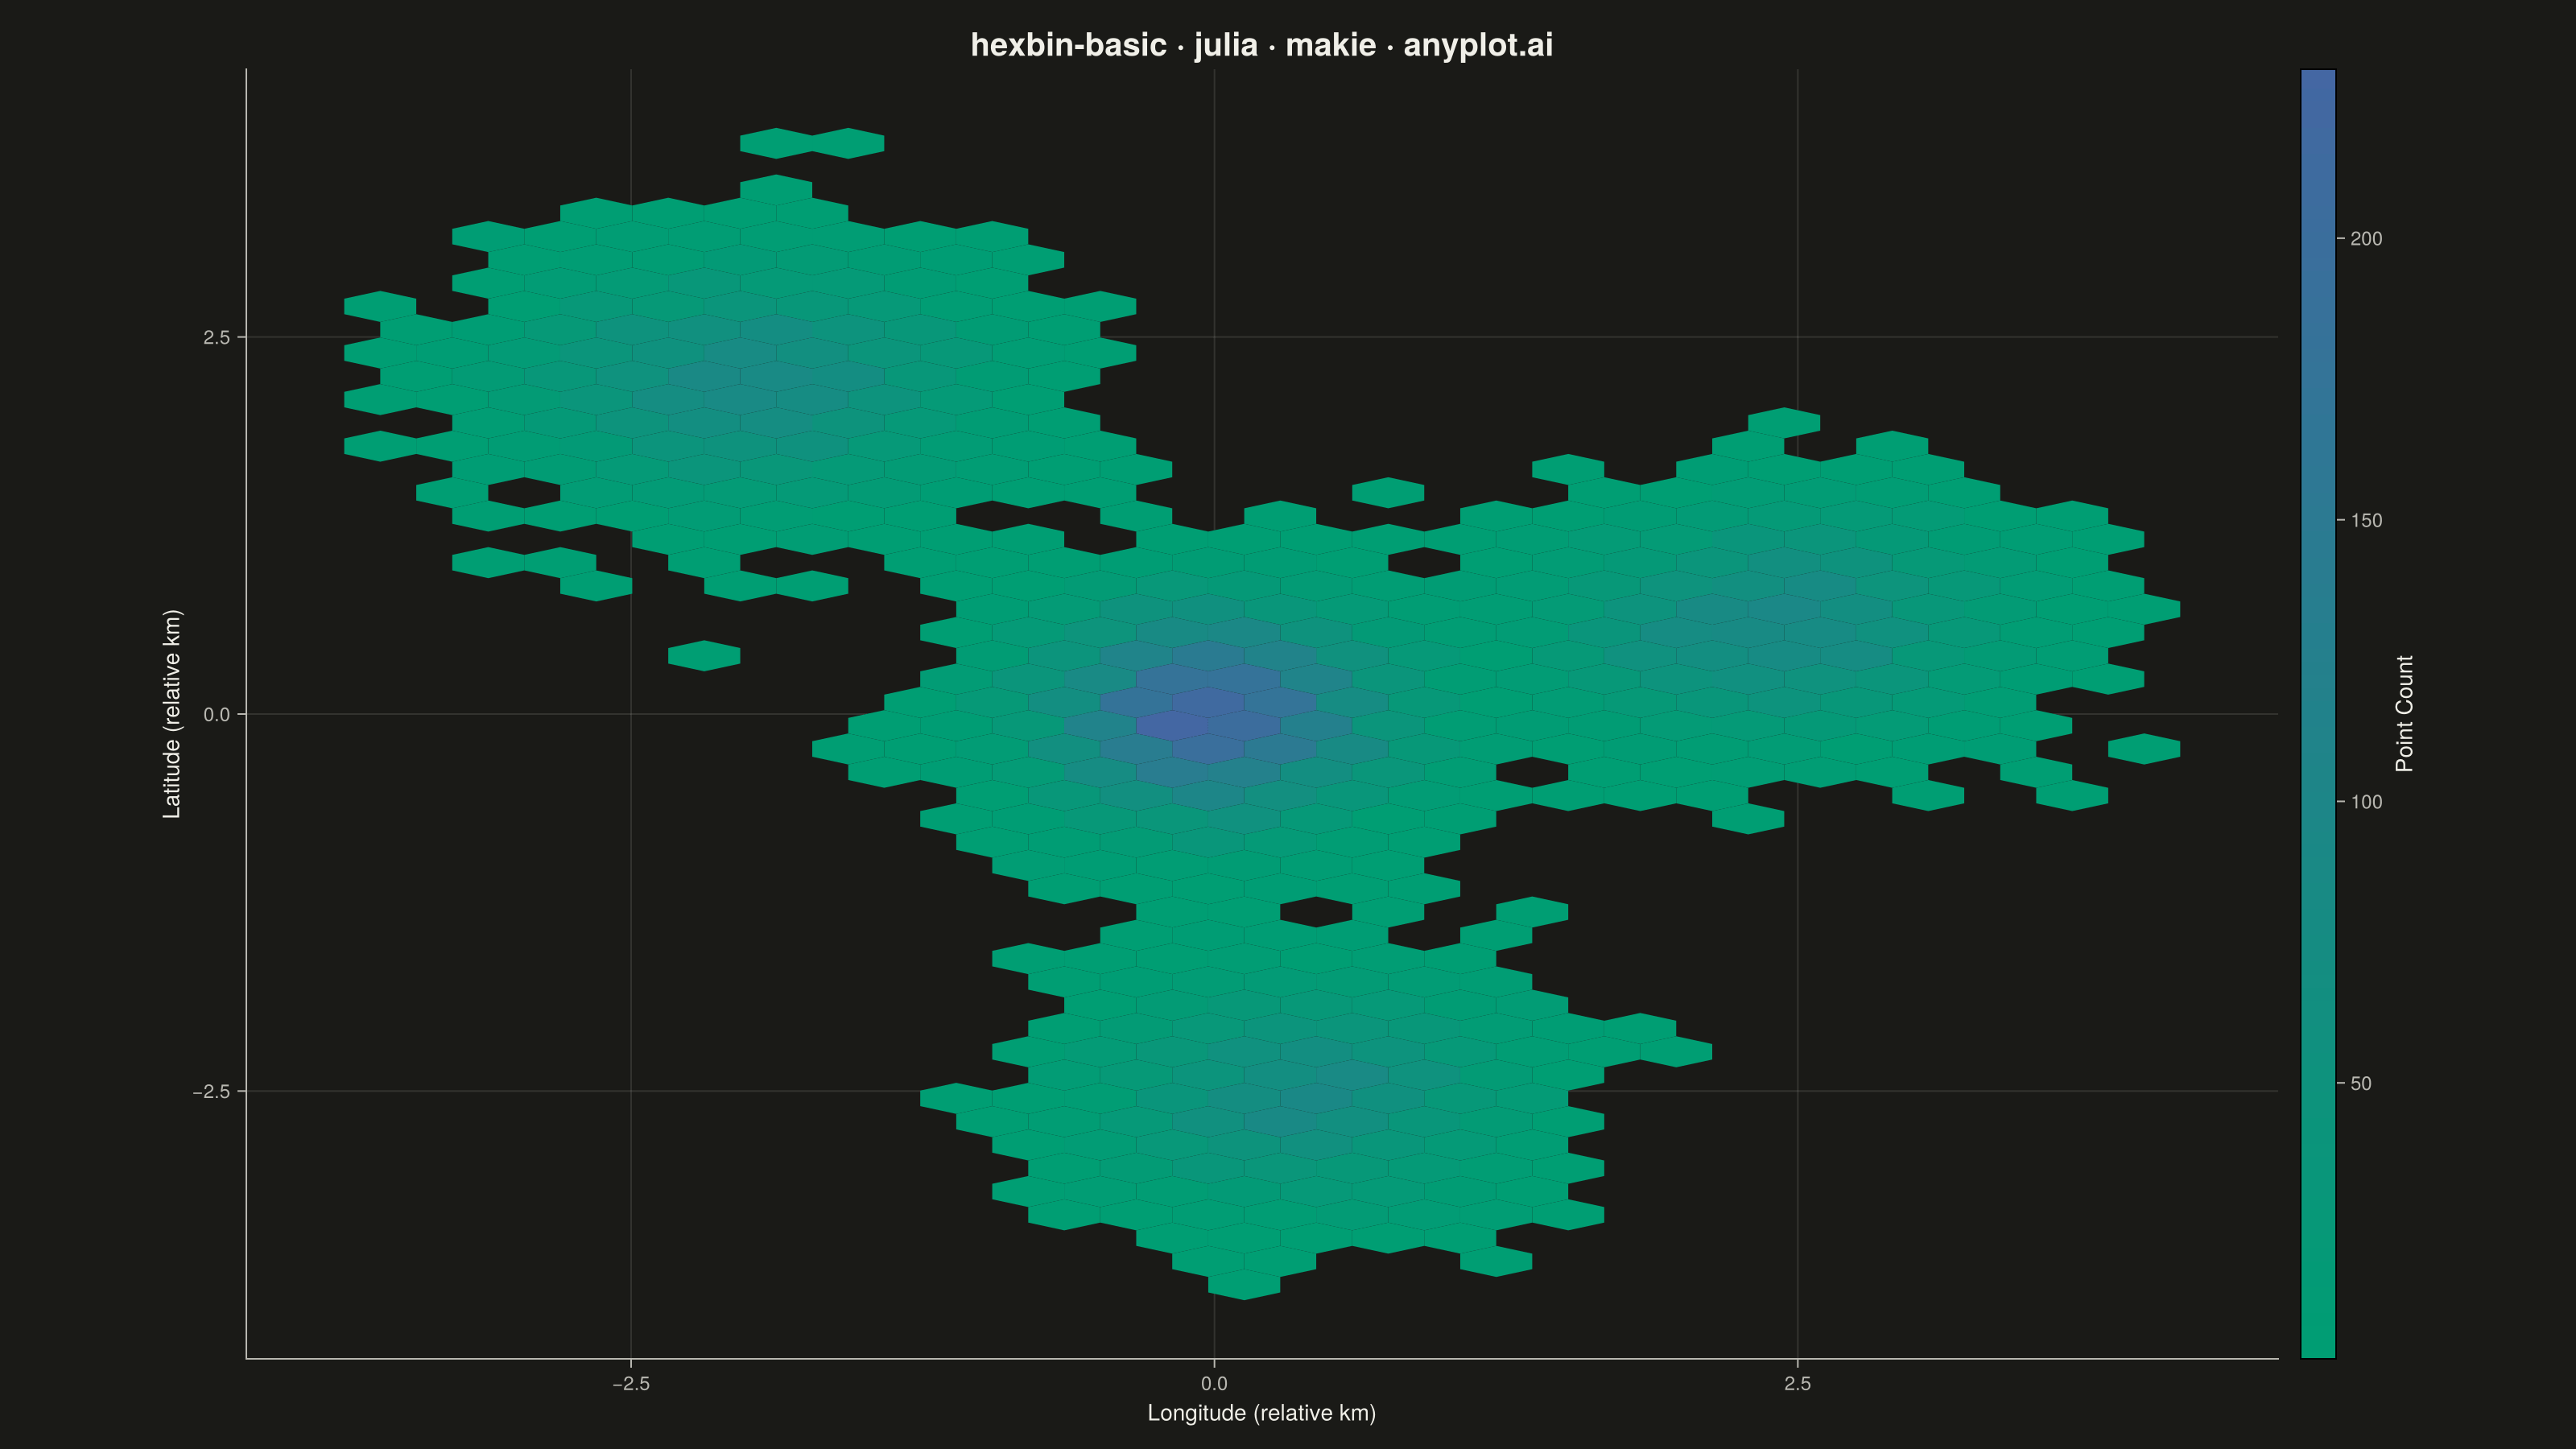
A hexagonal binning plot that visualizes the density of 2D point data by aggregating points into hexagonal bins. The color intensity of each hexagon represents the count of points within it, making it ideal for revealing density patterns in large datasets where traditional scatter plots would show overlapping points. Hexagonal bins provide better visual representation than square pixels due to their isotropy (equal distance to neighboring cells in all directions).
# anyplot.ai
# hexbin-basic: Basic Hexbin Plot
# Library: makie 0.22.10 | Julia 1.11.9
# Quality: 85/100 | Created: 2026-05-29

using CairoMakie
using Colors
using ColorSchemes
using Random

Random.seed!(42)

# Theme tokens
const THEME       = get(ENV, "ANYPLOT_THEME", "light")
const PAGE_BG     = THEME == "light" ? colorant"#FAF8F1" : colorant"#1A1A17"
const ELEVATED_BG = THEME == "light" ? colorant"#FFFDF6" : colorant"#242420"
const INK         = THEME == "light" ? colorant"#1A1A17" : colorant"#F0EFE8"
const INK_SOFT    = THEME == "light" ? colorant"#4A4A44" : colorant"#B8B7B0"

# Imprint sequential colormap: brand green → blue (single-polarity density)
const ANYPLOT_SEQ = cgrad([colorant"#009E73", colorant"#4467A3"])

# Data: simulated urban GPS coordinates with clustered hotspots (12000 points)
# City center — highest density
n1 = 5000
x1 = randn(n1) .* 0.4 .+ 0.0
y1 = randn(n1) .* 0.4 .+ 0.0

# Northern district
n2 = 2500
x2 = randn(n2) .* 0.5 .+ -2.0
y2 = randn(n2) .* 0.4 .+ 2.2

# Eastern commercial zone
n3 = 2500
x3 = randn(n3) .* 0.5 .+ 2.4
y3 = randn(n3) .* 0.4 .+ 0.6

# Southern transit hub
n4 = 2000
x4 = randn(n4) .* 0.45 .+ 0.4
y4 = randn(n4) .* 0.40 .+ -2.5

x_coords = vcat(x1, x2, x3, x4)
y_coords = vcat(y1, y2, y3, y4)

# Figure
fig = Figure(
    size            = (1600, 900),
    fontsize        = 14,
    backgroundcolor = PAGE_BG,
)

ax = Axis(
    fig[1, 1];
    title              = "hexbin-basic · julia · makie · anyplot.ai",
    titlesize          = 20,
    titlecolor         = INK,
    xlabel             = "Longitude (relative km)",
    ylabel             = "Latitude (relative km)",
    xlabelsize         = 14,
    ylabelsize         = 14,
    xlabelcolor        = INK,
    ylabelcolor        = INK,
    xticklabelsize     = 12,
    yticklabelsize     = 12,
    xticklabelcolor    = INK_SOFT,
    yticklabelcolor    = INK_SOFT,
    xtickcolor         = INK_SOFT,
    ytickcolor         = INK_SOFT,
    backgroundcolor    = PAGE_BG,
    topspinevisible    = false,
    rightspinevisible  = false,
    leftspinecolor     = INK_SOFT,
    bottomspinecolor   = INK_SOFT,
    xgridcolor         = RGBAf(INK.r, INK.g, INK.b, 0.12f0),
    ygridcolor         = RGBAf(INK.r, INK.g, INK.b, 0.12f0),
    xminorgridvisible  = false,
    yminorgridvisible  = false,
)

# Log colorscale surfaces peripheral mid-density clusters that would otherwise wash out
hb = hexbin!(ax, x_coords, y_coords;
    bins        = 50,
    colormap    = ANYPLOT_SEQ,
    colorscale  = log10,
    strokewidth = 0,
)

# Colorbar with log-scale ticks at interpretable landmark counts
Colorbar(fig[1, 2], hb;
    label          = "Point Count",
    labelsize      = 14,
    labelcolor     = INK,
    ticklabelsize  = 11,
    ticklabelcolor = INK_SOFT,
    tickcolor      = INK_SOFT,
    ticks          = ([1, 5, 20, 80, 250], ["1", "5", "20", "80", "250"]),
    width          = 22,
)

# Focal annotation: ring + label calling out the city center peak-density cluster
scatter!(ax, [0.0], [0.0];
    marker      = :circle,
    markersize  = 42,
    color       = :transparent,
    strokewidth = 2.2,
    strokecolor = INK,
)
text!(ax, 0.5, 0.1;
    text     = "City Center\n(peak density)",
    color    = INK,
    fontsize = 11,
    align    = (:left, :center),
)

colsize!(fig.layout, 1, Relative(0.87))
colgap!(fig.layout, 14)

# Save
save("plot-$(THEME).png", fig; px_per_unit = 2)
Runnable source as JSON, for any HTTP client: https://api.anyplot.ai/specs/hexbin-basic/makie/code. Any spec id and library id listed in llms-full.txt fit the same URL shape; every URL below is complete and callable.
{
  "spec_id": "hexbin-basic",
  "language": "julia",
  "library": "makie",
  "page": "https://anyplot.ai/hexbin-basic/julia/makie",
  "hub": "https://anyplot.ai/hexbin-basic",
  "code_json": "https://api.anyplot.ai/specs/hexbin-basic/makie/code",
  "spec_json": "https://api.anyplot.ai/specs/hexbin-basic",
  "render_light_png": "https://storage.googleapis.com/anyplot-images/plots/hexbin-basic/julia/makie/plot-light.png",
  "render_dark_png": "https://storage.googleapis.com/anyplot-images/plots/hexbin-basic/julia/makie/plot-dark.png",
  "quality_score": 85.0,
  "license": "MIT",
  "guide": "https://anyplot.ai/llms.txt"
}
Part of Basic Hexbin Plot on anyplot.ai.