The same plot in 14 other libraries — JavaScript: Chart.js, D3.js, Highcharts, MUI X Charts; Python: Altair, Bokeh, lets-plot, Matplotlib, Plotly, plotnine, Pygal, Seaborn; R: ggplot2; Julia: Makie.jl. Compare all 15 side by side: Basic Hexbin Plot in Python, R, Julia and JavaScript.
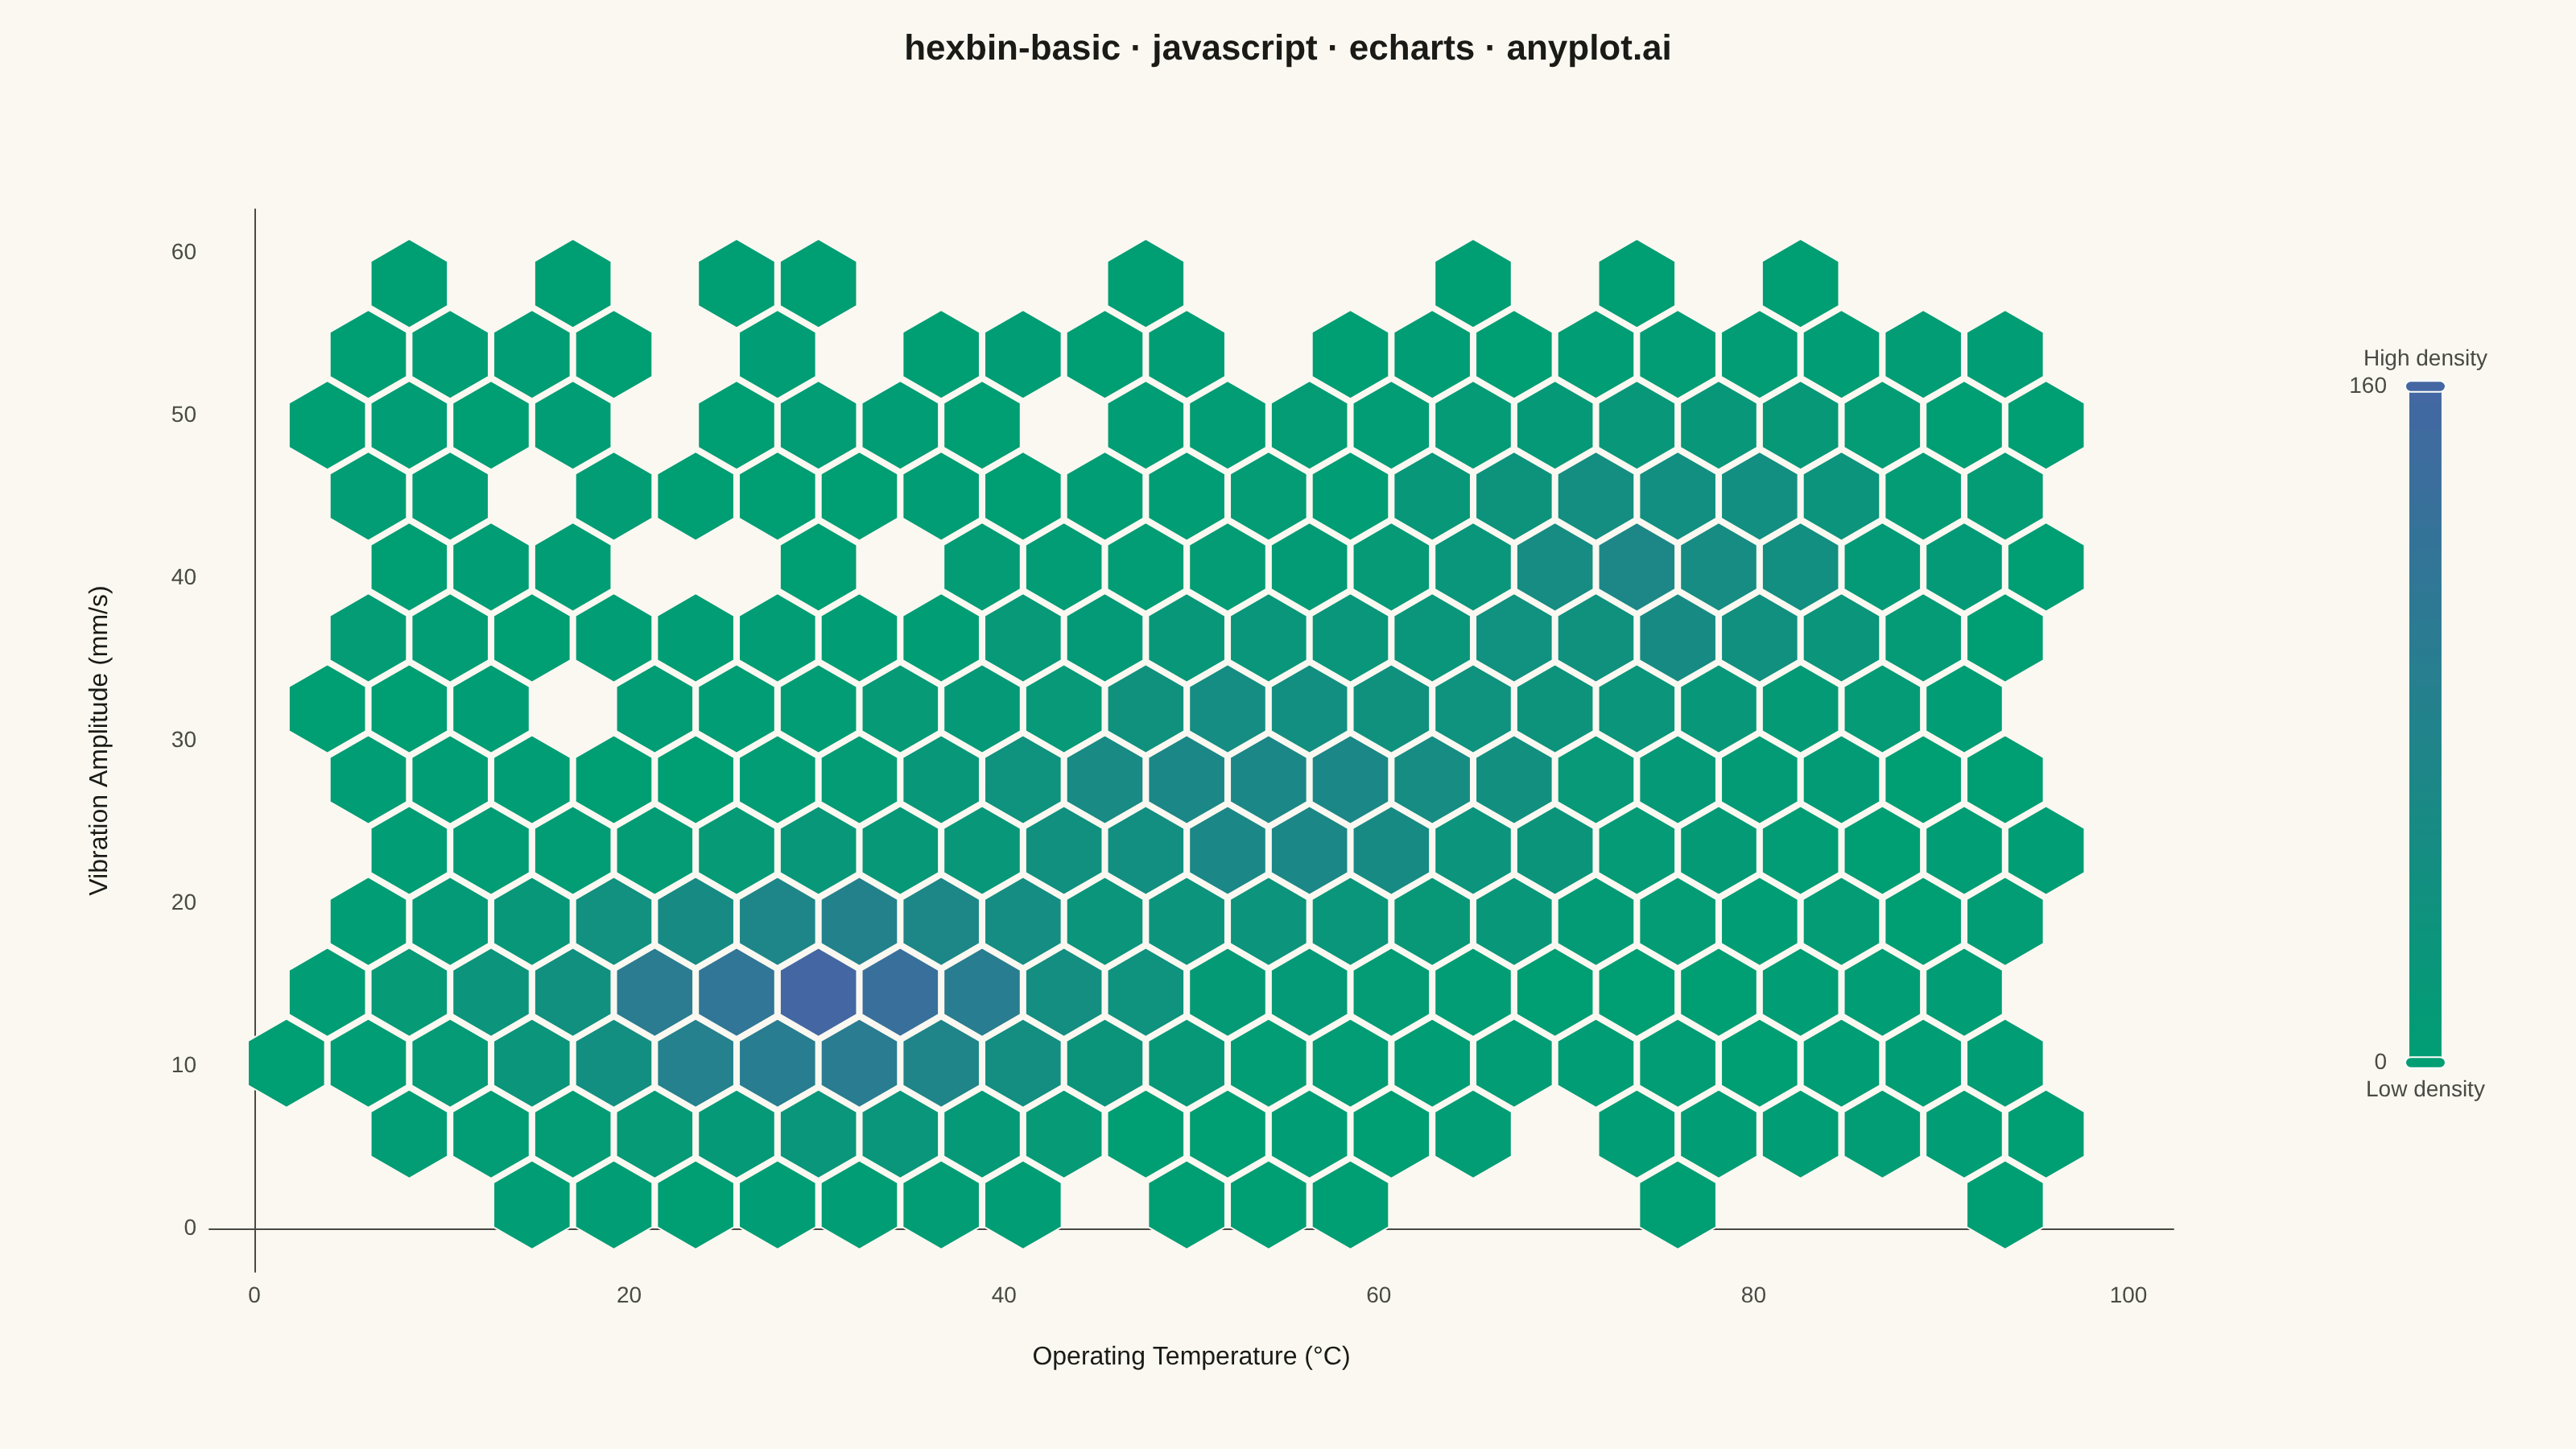
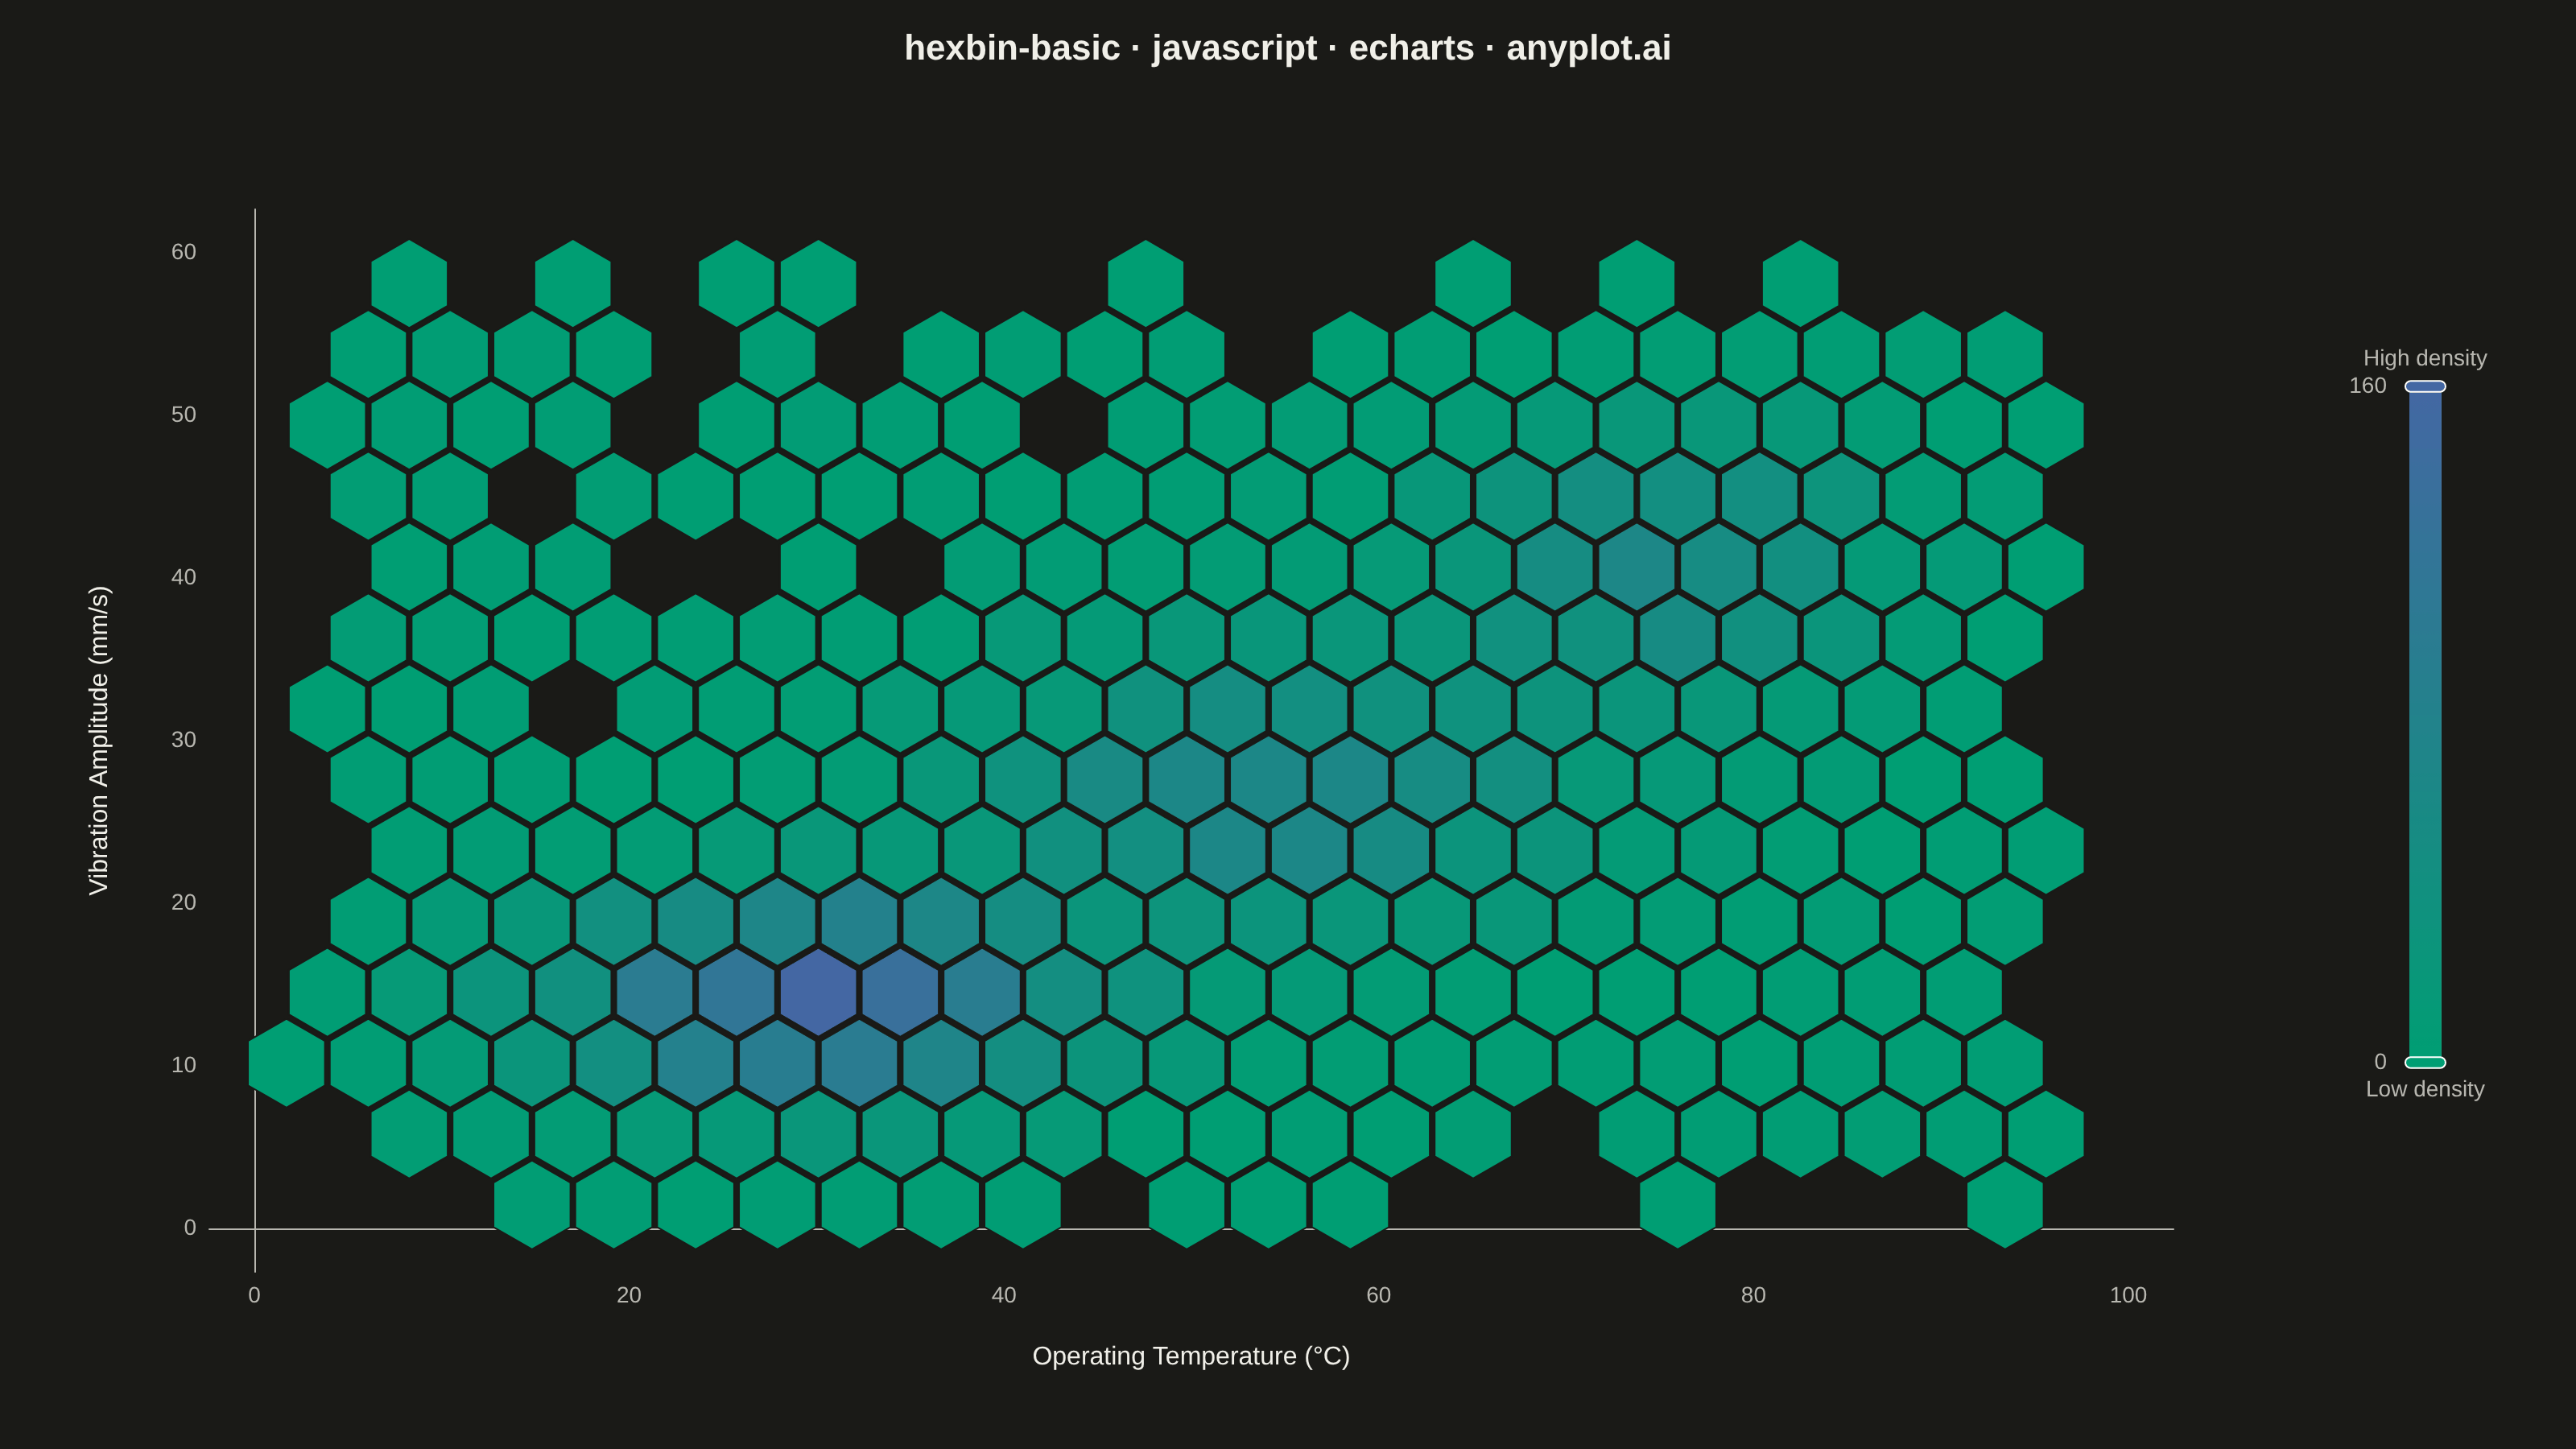
A hexagonal binning plot that visualizes the density of 2D point data by aggregating points into hexagonal bins. The color intensity of each hexagon represents the count of points within it, making it ideal for revealing density patterns in large datasets where traditional scatter plots would show overlapping points. Hexagonal bins provide better visual representation than square pixels due to their isotropy (equal distance to neighboring cells in all directions).
// anyplot.ai
// hexbin-basic: Basic Hexbin Plot
// Library: echarts 6.1.0 | JavaScript 22.23.2
// Quality: 93/100 | Created: 2026-08-25

const t = window.ANYPLOT_TOKENS;
const size = window.ANYPLOT_SIZE;

// --- Data (in-memory, deterministic) ----------------------------------------
// Tiny LCG so the browser (no seeded Math.random) still reproduces the same
// sensor readings on every render.
function makeLcg(seed) {
  let state = seed >>> 0;
  return function lcg() {
    state = (state * 1664525 + 1013904223) >>> 0;
    return state / 4294967296;
  };
}

function randomNormal(rng, mean, std) {
  const u1 = Math.max(rng(), 1e-9);
  const u2 = rng();
  const z = Math.sqrt(-2 * Math.log(u1)) * Math.cos(2 * Math.PI * u2);
  return mean + z * std;
}

const DATA_X_MIN = 0;
const DATA_X_MAX = 100;
const DATA_Y_MIN = 0;
const DATA_Y_MAX = 60;

const rng = makeLcg(42);

// Three industrial-IoT operating regimes plus background noise: temperature
// (°C) vs. vibration amplitude (mm/s) readings from a fleet of sensors.
const regimes = [
  { cx: 30, cy: 14, sx: 9, sy: 4, n: 1800 }, // normal operation
  { cx: 55, cy: 27, sx: 10, sy: 6, n: 1400 }, // elevated load
  { cx: 76, cy: 41, sx: 7, sy: 5, n: 800 }, // thermal-stress zone
];

const readings = [];
regimes.forEach((regime) => {
  for (let i = 0; i < regime.n; i++) {
    const temperature = randomNormal(rng, regime.cx, regime.sx);
    const vibration = randomNormal(rng, regime.cy, regime.sy);
    readings.push([
      Math.min(Math.max(temperature, DATA_X_MIN + 1), DATA_X_MAX - 1),
      Math.min(Math.max(vibration, DATA_Y_MIN + 1), DATA_Y_MAX - 1),
    ]);
  }
});
for (let i = 0; i < 500; i++) {
  readings.push([5 + rng() * 90, 2 + rng() * 55]);
}

// --- Hexagonal binning --------------------------------------------------------
// ECharts has no built-in hexbin series, so bins are aggregated by hand and
// drawn with a "custom" series (a native ECharts capability, not a workaround).
// Binning runs in CSS-mount pixel space (matching the grid rect + axis domain
// below) rather than data space, so the hexagons stay perfectly regular even
// though the x/y axes cover different physical units and ranges.
const GRID_LEFT = 130;
const GRID_RIGHT = 250;
const GRID_TOP = 130;
const GRID_BOTTOM = 110;
const plotWidth = size.width - GRID_LEFT - GRID_RIGHT;
const plotHeight = size.height - GRID_TOP - GRID_BOTTOM;

const HEX_COLUMNS = 24;
const hexPxRadius = plotWidth / (HEX_COLUMNS * Math.sqrt(3));
const dx = hexPxRadius * Math.sqrt(3);
const dy = hexPxRadius * 1.5;

// Pad the axis domain by one hex radius on every side so bins centered near
// the true data extent stay fully inside the plot frame instead of spilling
// past the axis line and covering tick labels.
const xPad = (hexPxRadius / plotWidth) * (DATA_X_MAX - DATA_X_MIN);
const yPad = (hexPxRadius / plotHeight) * (DATA_Y_MAX - DATA_Y_MIN);
const X_MIN = DATA_X_MIN - xPad;
const X_MAX = DATA_X_MAX + xPad;
const Y_MIN = DATA_Y_MIN - yPad;
const Y_MAX = DATA_Y_MAX + yPad;

const xToPx = (x) => GRID_LEFT + ((x - X_MIN) / (X_MAX - X_MIN)) * plotWidth;
const yToPx = (y) => GRID_TOP + (1 - (y - Y_MIN) / (Y_MAX - Y_MIN)) * plotHeight;
const pxToX = (px) => X_MIN + ((px - GRID_LEFT) / plotWidth) * (X_MAX - X_MIN);
const pxToY = (py) => Y_MIN + (1 - (py - GRID_TOP) / plotHeight) * (Y_MAX - Y_MIN);

function binReadings(points) {
  const bins = new Map();
  points.forEach(([x, y]) => {
    const px = xToPx(x);
    const py = yToPx(y);
    const rowF = py / dy;
    let pj = Math.round(rowF);
    let colF = px / dx - (pj & 1 ? 0.5 : 0);
    let pi = Math.round(colF);
    const dRow = rowF - pj;

    if (Math.abs(dRow) * 3 > 1) {
      const dCol = colF - pi;
      const pi2 = pi + (colF < pi ? -1 : 1) * 0.5;
      const pj2 = pj + (rowF < pj ? -1 : 1);
      const dCol2 = colF - pi2;
      const dRow2 = rowF - pj2;
      if (dCol * dCol + dRow * dRow > dCol2 * dCol2 + dRow2 * dRow2) {
        pi = pi2 + (pj & 1 ? 1 : -1) * 0.5;
        pj = pj2;
      }
    }

    const key = `${pi}|${pj}`;
    let bin = bins.get(key);
    if (!bin) {
      bin = { cxPx: (pi + (pj & 1 ? 0.5 : 0)) * dx, cyPx: pj * dy, count: 0 };
      bins.set(key, bin);
    }
    bin.count += 1;
  });
  return [...bins.values()];
}

const hexBins = binReadings(readings);
const maxCount = Math.max(...hexBins.map((b) => b.count));
const hexSeriesData = hexBins.map((b) => [pxToX(b.cxPx), pxToY(b.cyPx), b.count]);

// --- Custom renderer: regular hexagon per bin --------------------------------
// A fixed pixel radius (matching the pixel-space binning above) keeps every
// hexagon a true regular hexagon and tiling gap-free, independent of the
// axes' data-to-pixel scale.
function renderHex(params, api) {
  const center = api.coord([api.value(0), api.value(1)]);
  const r = hexPxRadius * 0.94;
  const points = [];
  for (let k = 0; k < 6; k++) {
    const angle = (Math.PI / 180) * (60 * k - 30);
    points.push([center[0] + r * Math.cos(angle), center[1] + r * Math.sin(angle)]);
  }
  return {
    type: "polygon",
    shape: { points },
    style: api.style({ fill: api.visual("color"), stroke: t.pageBg, lineWidth: 1 }),
  };
}

// --- Init ---------------------------------------------------------------------
const chart = echarts.init(document.getElementById("container"));

// --- Option ---------------------------------------------------------------------
chart.setOption({
  animation: false,
  backgroundColor: "transparent",
  title: {
    text: "hexbin-basic · javascript · echarts · anyplot.ai",
    left: "center",
    textStyle: { color: t.ink, fontSize: 22 },
  },
  tooltip: {
    trigger: "item",
    formatter: (p) =>
      `Temperature: ${p.value[0].toFixed(1)} °C<br/>Vibration: ${p.value[1].toFixed(1)} mm/s<br/>Readings: ${p.value[2]}`,
  },
  grid: { left: GRID_LEFT, right: GRID_RIGHT, top: GRID_TOP, bottom: GRID_BOTTOM },
  xAxis: {
    type: "value",
    min: X_MIN,
    max: X_MAX,
    name: "Operating Temperature (°C)",
    nameLocation: "middle",
    nameGap: 45,
    nameTextStyle: { color: t.ink, fontSize: 16 },
    axisLabel: { color: t.inkSoft, fontSize: 14, showMinLabel: false, showMaxLabel: false },
    axisLine: { lineStyle: { color: t.inkSoft } },
    axisTick: { show: false },
    splitLine: { show: false },
  },
  yAxis: {
    type: "value",
    min: Y_MIN,
    max: Y_MAX,
    name: "Vibration Amplitude (mm/s)",
    nameLocation: "middle",
    nameGap: 60,
    nameTextStyle: { color: t.ink, fontSize: 16 },
    axisLabel: { color: t.inkSoft, fontSize: 14, showMinLabel: false, showMaxLabel: false },
    axisLine: { lineStyle: { color: t.inkSoft } },
    axisTick: { show: false },
    splitLine: { show: false },
  },
  visualMap: {
    type: "continuous",
    dimension: 2,
    seriesIndex: 0,
    min: 0,
    max: maxCount,
    orient: "vertical",
    right: 40,
    top: "middle",
    itemHeight: 420,
    text: ["High density", "Low density"],
    textStyle: { color: t.inkSoft, fontSize: 14 },
    inRange: { color: t.seq },
    calculable: true,
  },
  series: [
    {
      type: "custom",
      name: "Sensor Reading Density",
      coordinateSystem: "cartesian2d",
      renderItem: renderHex,
      data: hexSeriesData,
      encode: { x: 0, y: 1, tooltip: [0, 1, 2] },
    },
  ],
});
Runnable source as JSON, for any HTTP client: https://api.anyplot.ai/specs/hexbin-basic/echarts/code. Any spec id and library id listed in llms-full.txt fit the same URL shape; every URL below is complete and callable.
{
  "spec_id": "hexbin-basic",
  "language": "javascript",
  "library": "echarts",
  "page": "https://anyplot.ai/hexbin-basic/javascript/echarts",
  "hub": "https://anyplot.ai/hexbin-basic",
  "code_json": "https://api.anyplot.ai/specs/hexbin-basic/echarts/code",
  "spec_json": "https://api.anyplot.ai/specs/hexbin-basic",
  "render_light_png": "https://storage.googleapis.com/anyplot-images/plots/hexbin-basic/javascript/echarts/plot-light.png",
  "render_dark_png": "https://storage.googleapis.com/anyplot-images/plots/hexbin-basic/javascript/echarts/plot-dark.png",
  "interactive_light_html": "https://storage.googleapis.com/anyplot-images/plots/hexbin-basic/javascript/echarts/plot-light.html",
  "interactive_dark_html": "https://storage.googleapis.com/anyplot-images/plots/hexbin-basic/javascript/echarts/plot-dark.html",
  "quality_score": 93.0,
  "license": "MIT",
  "guide": "https://anyplot.ai/llms.txt"
}
Part of Basic Hexbin Plot on anyplot.ai.